First of all, happy new year!!! I hope 2023 turns out to be a healthy and prosperous year for all!
As we look back on 2022, it was anything but that. We started the year on a very sour note and things went downhill from there - at least from a stock market perspective. There is reason for hope as we open 2023, but we'll need a few things to change before we can truly move higher.
Large Caps Must Rebound
Our major indices like the S&P 500 and NASDAQ 100 are driven mostly by large cap performance. These are two market-cap-weighted indices, meaning that large cap stocks like Apple, Inc. (AAPL) and Microsoft (MSFT) will carry a heavy burden. The following six companies represent more than 20% of the S&P 500 and nearly 42% of the NASDAQ 100. If they don't rebound and begin to outperform, it'll likely be another difficult year ahead. Here's a quick glance at each of the six on long-term monthly charts:
AAPL:
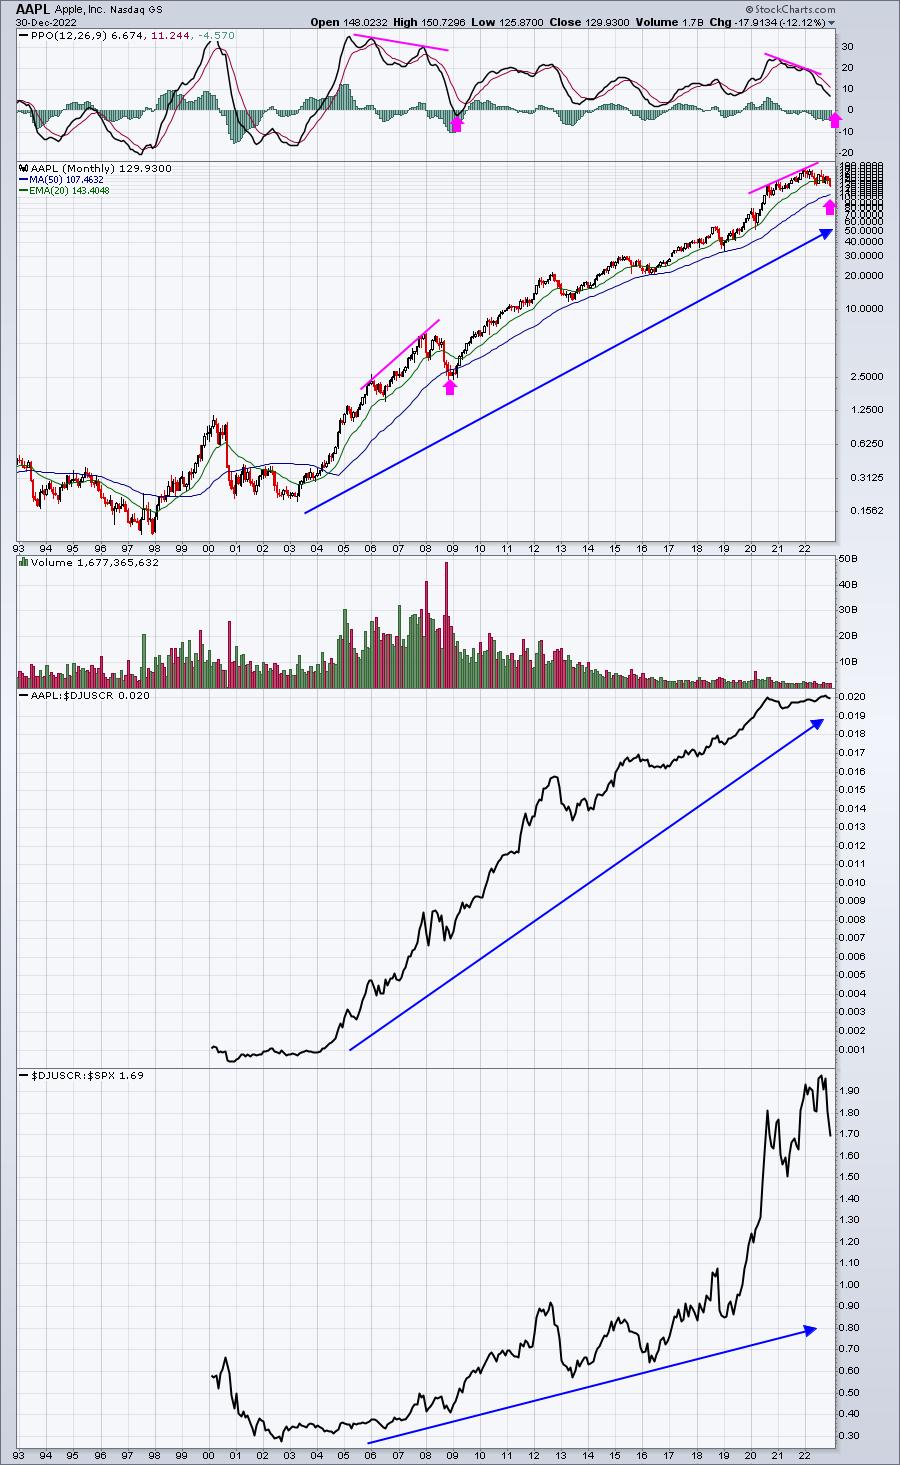
AAPL remains in a long-term uptrend, which is good news. However, it did recently print a negative divergence. When we saw the negative divergence in 2008, we know what happened. It was a brutal trip down to the 50-month SMA to "reset" the PPO at its zero line. Right now, AAPL's 50-month SMA is at 107. AAPL did break below its 2022 support of 129.50 late last week. If it's unable to right the ship, a potential trip to the 50-month SMA cannot be ruled out.
MSFT:
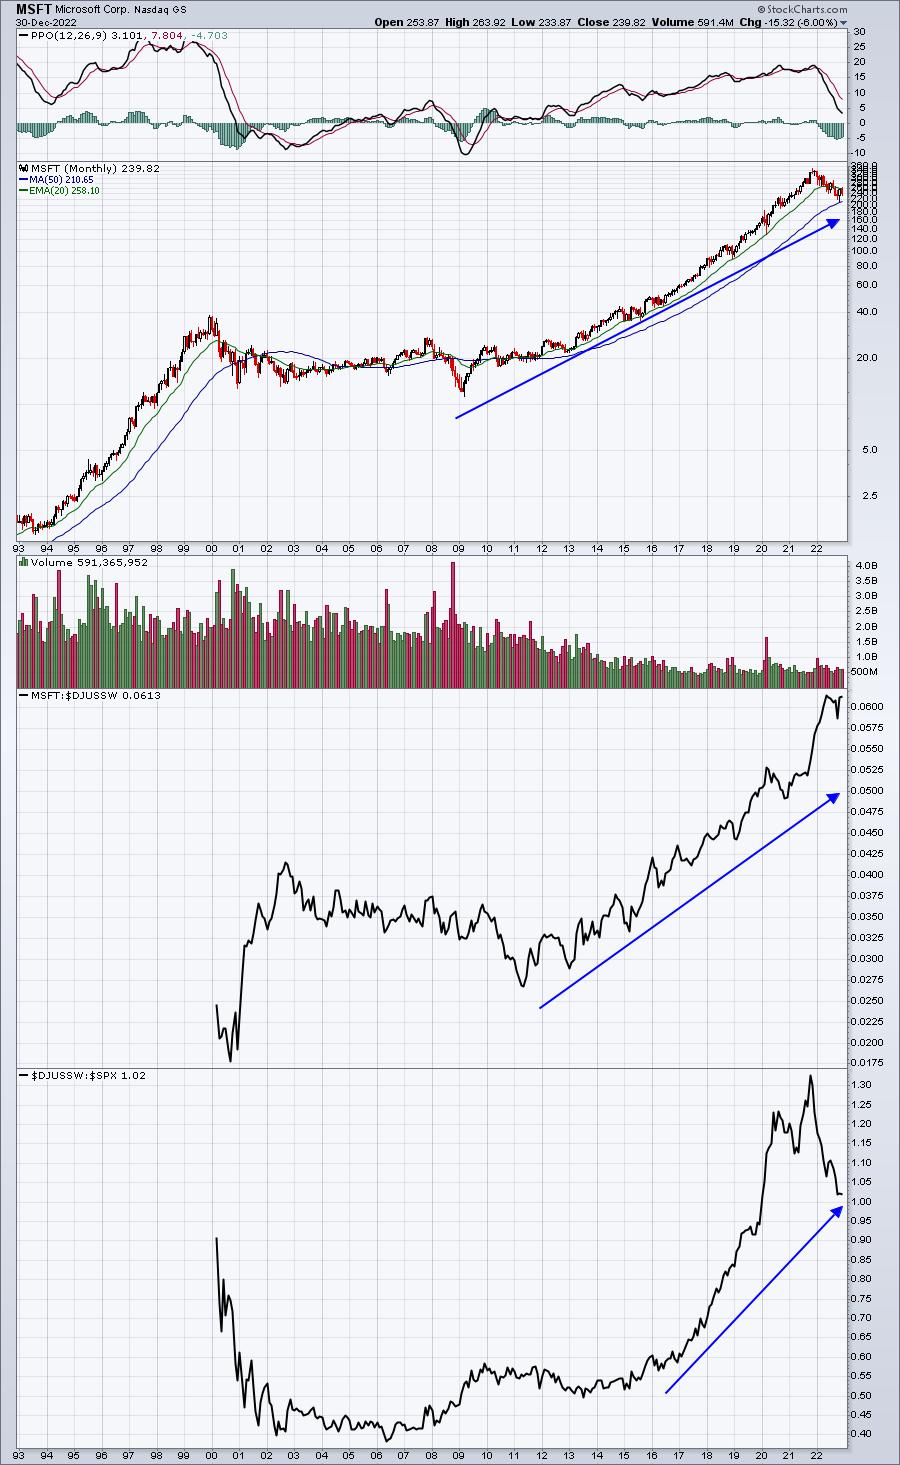
The monthly PPO was very stretched on MSFT as it moved unabatedly higher for a decade. The 2022 selloff was a necessary one, but now that MSFT has seen a 50-month SMA test, I feel better about this one advancing in 2023.
AMZN:
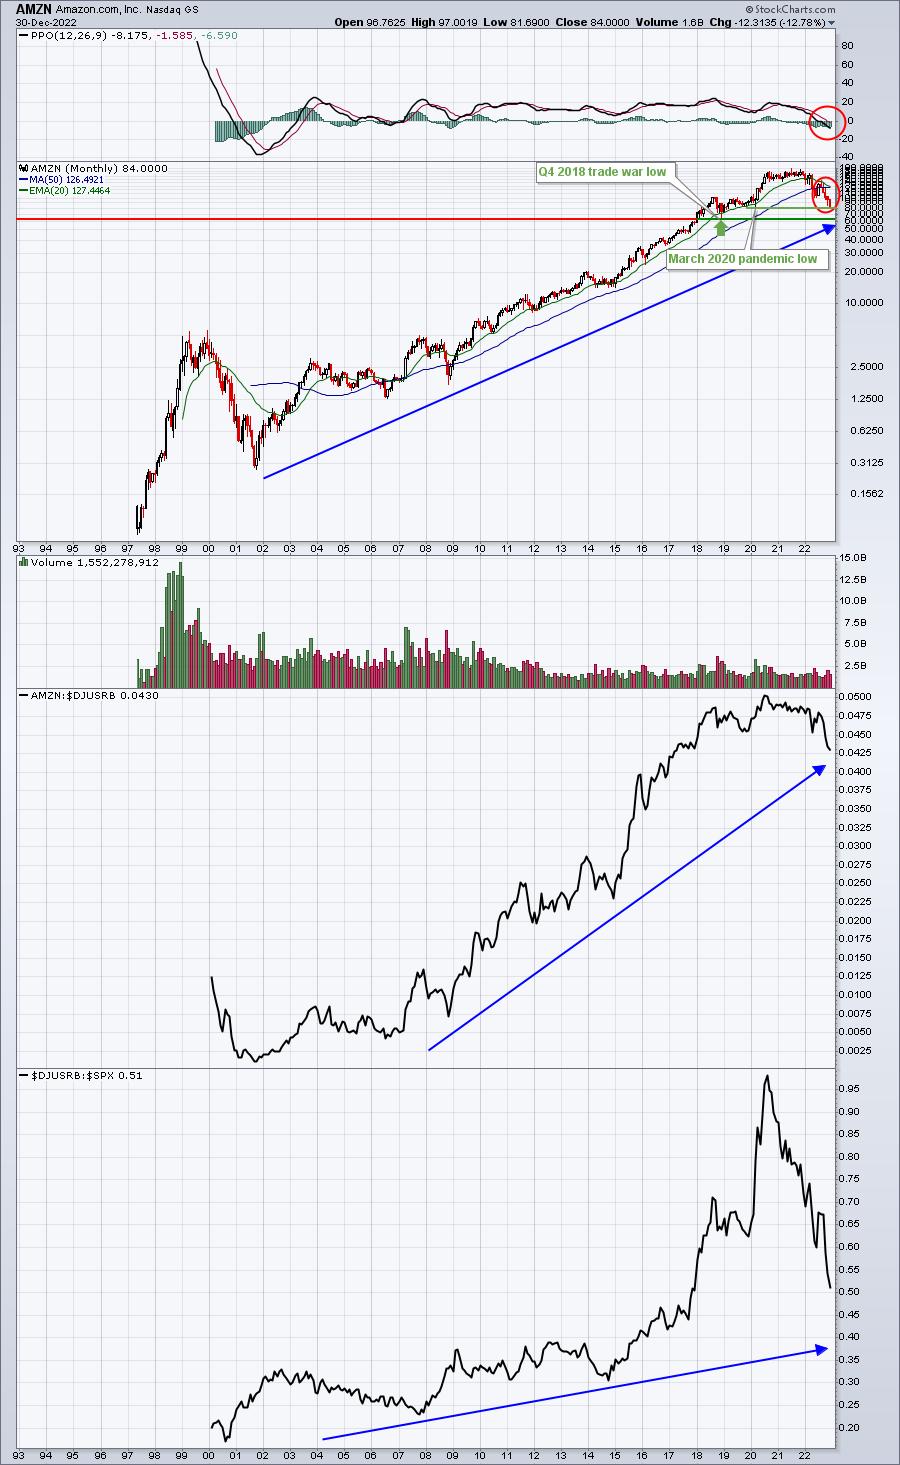
AMZN was one of the biggest beneficiaries of the COVID-19 pandemic. At its March 2020 pandemic-driven low, AMZN traded at 81.11. After rising to 177.20 in early-September 2020, well over a doubling of its stock price in just 6 months, we had one more move higher to 188.21 in July 2021. From there, however, it's been a ski slope on AMZN's chart. On Friday, AMZN closed out 2022 at 84.00 - almost exactly where its 2020 pandemic run began.
GOOGL:
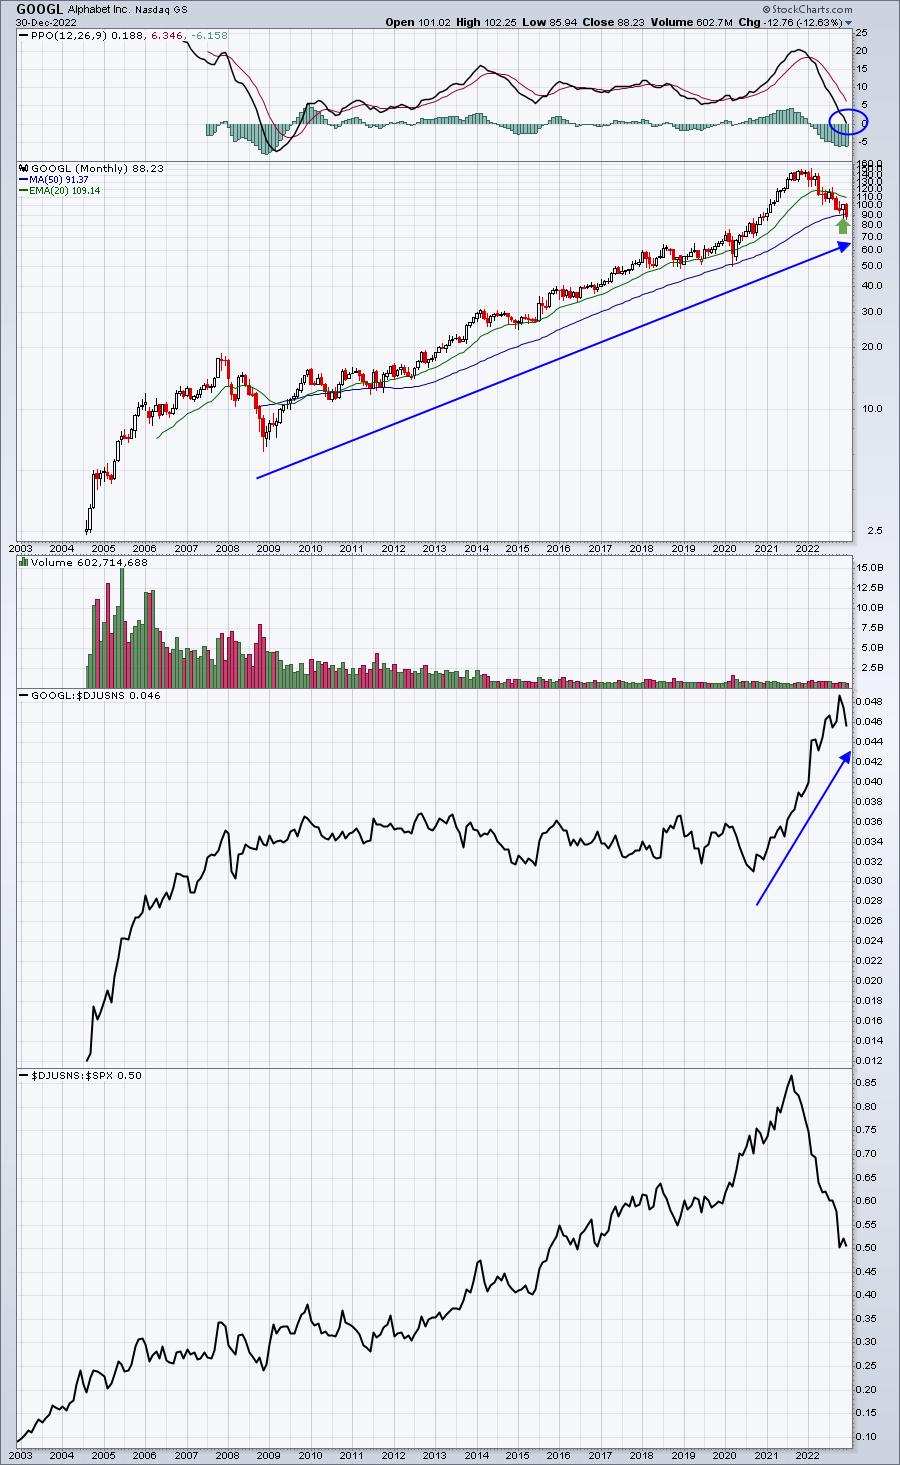
Alphabet (GOOGL) has seen a steady drop in 2022, but it has crushed many of its internet peers. GOOGL remains a clear leader in the space. However, the internet group ($DJUSNS), as a whole, was the fourth worst performing industry group (out of 104). GOOGL has now tested its monthly PPO centerline and its 50-month SMA.
TSLA:
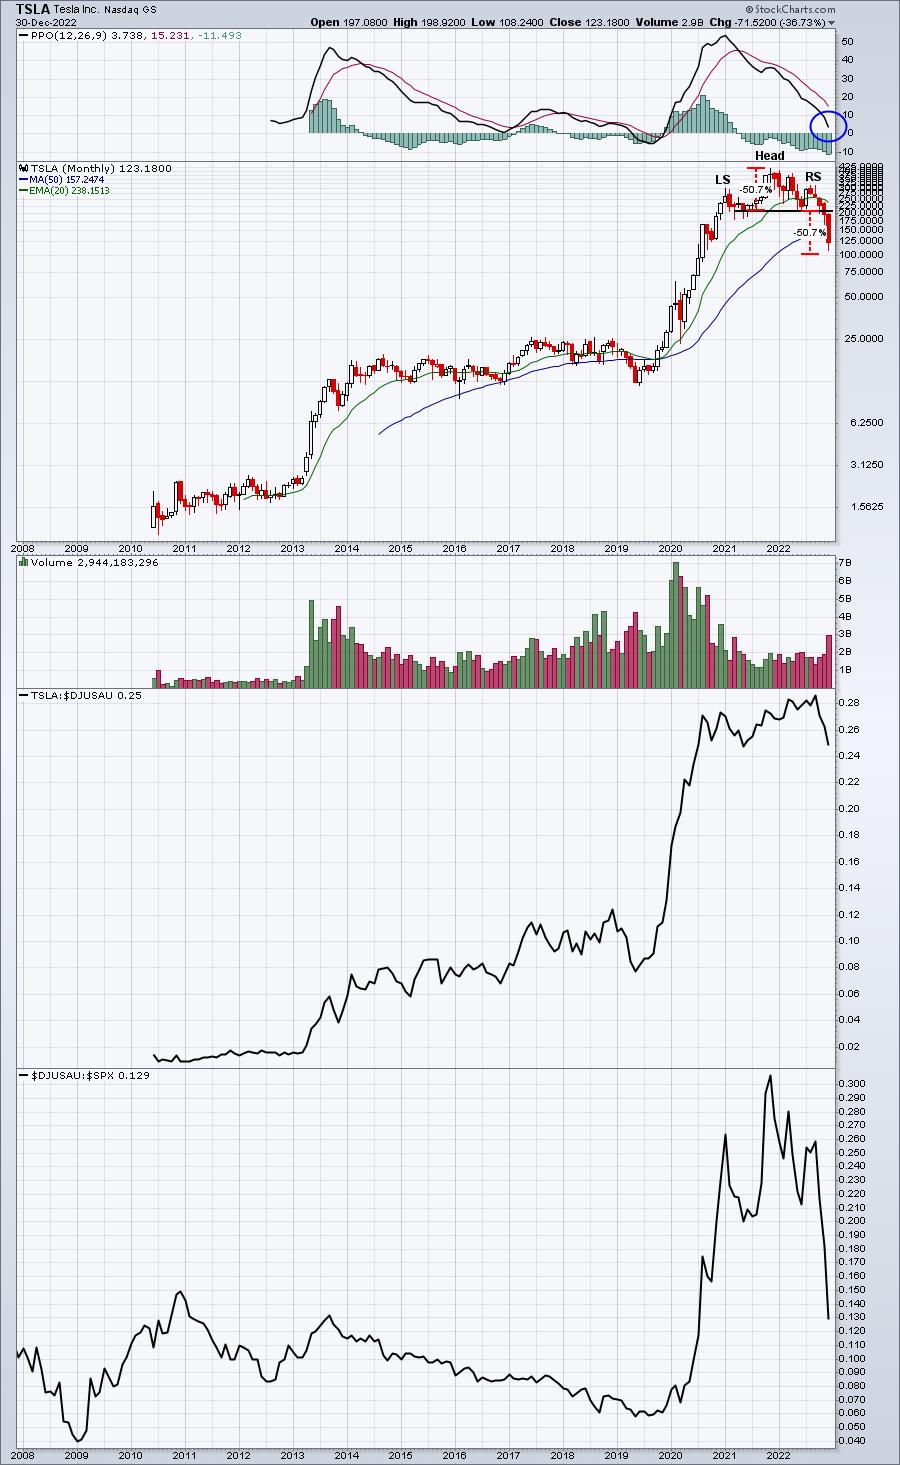
After a massive run higher in TSLA shares, a head & shoulders top appeared.....and it's been broken now to the downside. Since neckline support gave way in November, TSLA has seen nearly a 50% additional drop. I don't know if December's huge decline of 37% has marked a bottom, but the measurement has arguably been achieved. TSLA is one of the weakest stocks in the entire market right now, but my gut tells me the chart will be much different one year from now.
NVDA:
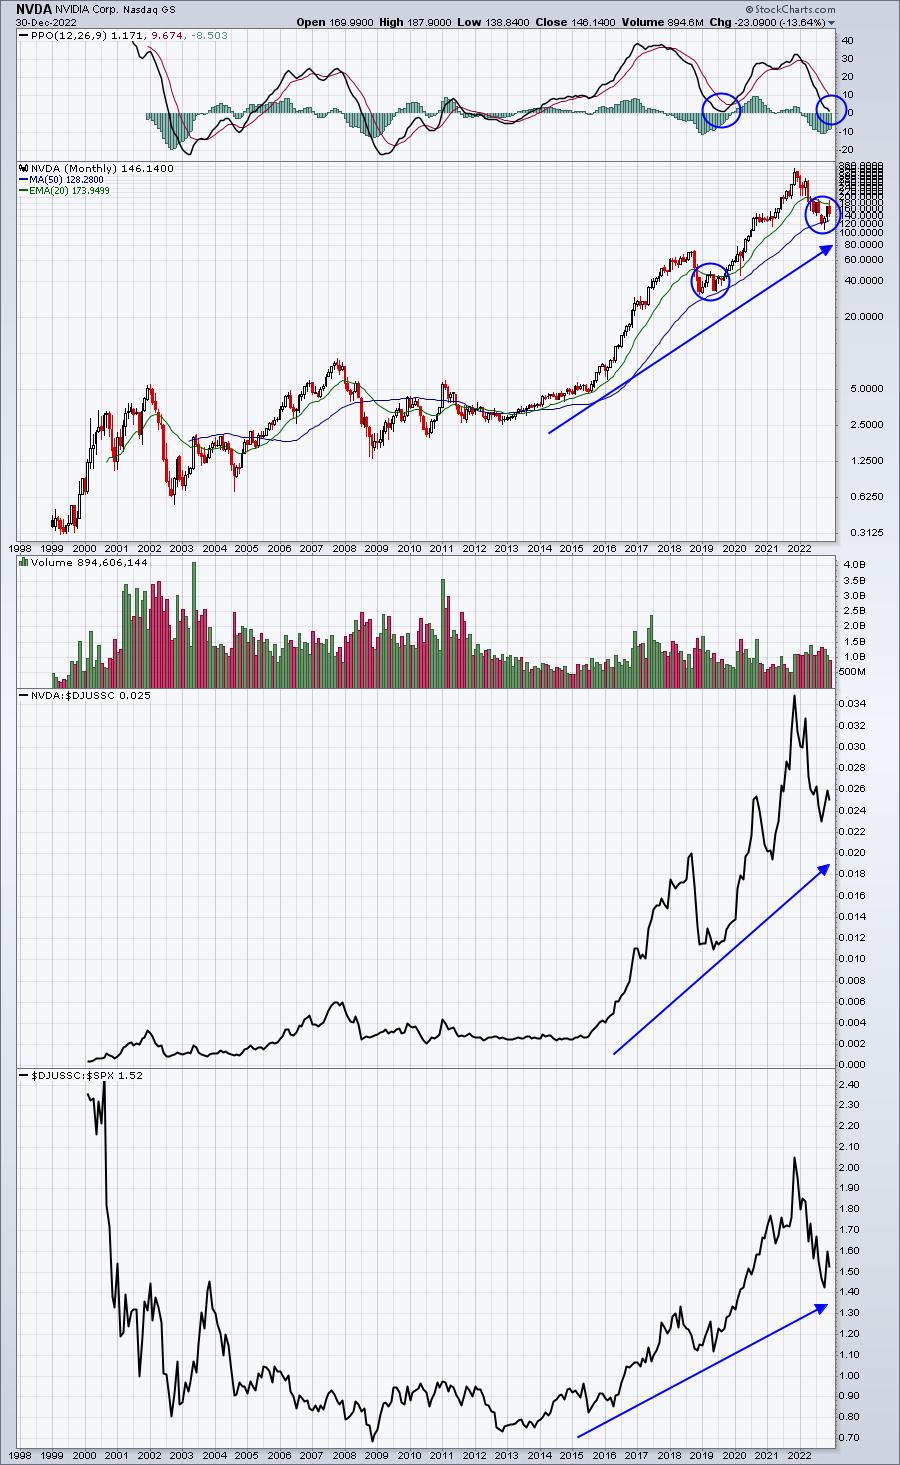
NVDA has seen this type of decline before - during the Q4 2018 trade war. Many semiconductor stocks were devastated during that period, but the 50-month SMA provided support. Here we are, just a few years later, at a similar spot. The attempt to bounce at the 50-month SMA ran into some difficulty at the now-declining 20-month EMA, so we could be range-bound for awhile.
History tells us that this is the time to BUY these mega cap leaders, not sell. Do they have further downside? Quite possibly, but their long-term track records are undeniable. I remember so many folks saying "I want to see a pullback in these names" as we closed out 2022 in record high territory. But now that we've seen anywhere from a 30%-70% drop in these 6 stocks, no one wants to touch them. That's how losing money affects our psyche.
Currently, technical conditions are not looking good for the NASDAQ 100 and its component stocks, but all is not lost.
Seasonality To The Rescue?
The final month of each calendar quarter (so the 3rd, 6th, 9th, and 12th calendar months) historically has not been kind to technology. Here's a breakdown of the average outperformance or underperformance of technology vs. the S&P 500 this century during the 3 months within any quarter:
- Month 1: +2.5%
- Month 2: +3.8%
- Month 3: +0.4%
Technology shows a history of selling during the 3rd months of our calendar quarters - of which December is one. January tends to be much stronger for tech stocks and the NASDAQ as a whole. Over the past 50 years, the NASDAQ has averaged gaining 2.39% in January, while the S&P 500 has averaged gaining just 1.05% over the same period. The "January Effect" is a powerful indicator of annual performance. It worked perfectly again in 2022.
If you want to know how the stock market will perform in 2023, it could be as simple as watching the 6 stocks above over the next month. Do they show signs of bullishness? Do they continue to trend lower? Of course, these won't be our only signals, but certainly ones to watch.
2023 Market Forecast
I will be providing my 2023 forecast this Saturday, January 7th at MarketVision 2023 and you won't want to miss it. Here were snippets from my last 3 annual market forecasts:
MarketVision 2020:
S&P 500 close, December 31, 2019: 3230.78
My 2020 forecast: Bullish and close of 4040
How the year unfolded: After the devastating effects of COVID-19 in March 2020, the S&P 500 rallied strongly, moving from the pandemic low of 2191.86 to a close of 3756.07. I remained bullish throughout the 2020 pandemic, calling it a "cyclical" bear market.
MarketVision 2021:
S&P 500 close, December 31, 2020: 3756.07
My forecast: Bullish and close of 4756.07 - said we'd gain 1000 points
How the year unfolded: The S&P 500 trended higher throughout 2021, stumbling a bit in September, before a rally in Q4 took us to 4766.18 at year end. The gain was 1010 points. I missed my call by just 10 points.
MarketVision 2022:
S&P 500 close, December 31, 2021: 4766.18
My forecast: Bearish with a downside target of 3500-3800 in the first 3-6 months (said we could see a 20%-25% cyclical bear market)
How the year unfolded: The first six months were rough and the cyclical bear market was confirmed when the decline reached 20% by May. On June 16th, I called a market bottom when the S&P 500 reached 3636. I expected a rally in Q4.
I don't have a crystal ball. But I use technical price action, key fundamentals, history, perspective, and just plain common sense to develop my stock market forecast. Though many have tried to label me a "perma-bull", I hope my 2022 forecast put that to bed. I call what I see, it's as simple as that. It's impossible to be right all of the time. I simply try to manage risk.
And now, it's time to do it again. I want to invite you to join me, along with David Keller, Julius de Kempenaer, and Grayson Roze from StockCharts.com, as we provide you our approach to 2023. It'll truly be the best educational event of 2023 and it's a FREE virtual event. Watch from the comfort of your own home! To learn more about the event and to SAVE your seat, CLICK HERE. No one else does an event like this for FREE. No one. By the way, if you can't make the event live, we will send you a recording, so make sure you register!
Get a leg up on others by attending MarketVision 2023 - I'll see you there!
Happy new year and happy trading!
Tom


