I have been preaching Wall Street manipulation for years. And Wall Street took manipulation to a completely new level in 2022, accumulating shares of panicked retail traders after the distribution period from January through May 2022 ended. Sure, we had two more price lows - one the very next month in June 2022 and then again in October 2022, but the characteristics of a bottom and accumulation had already begun:
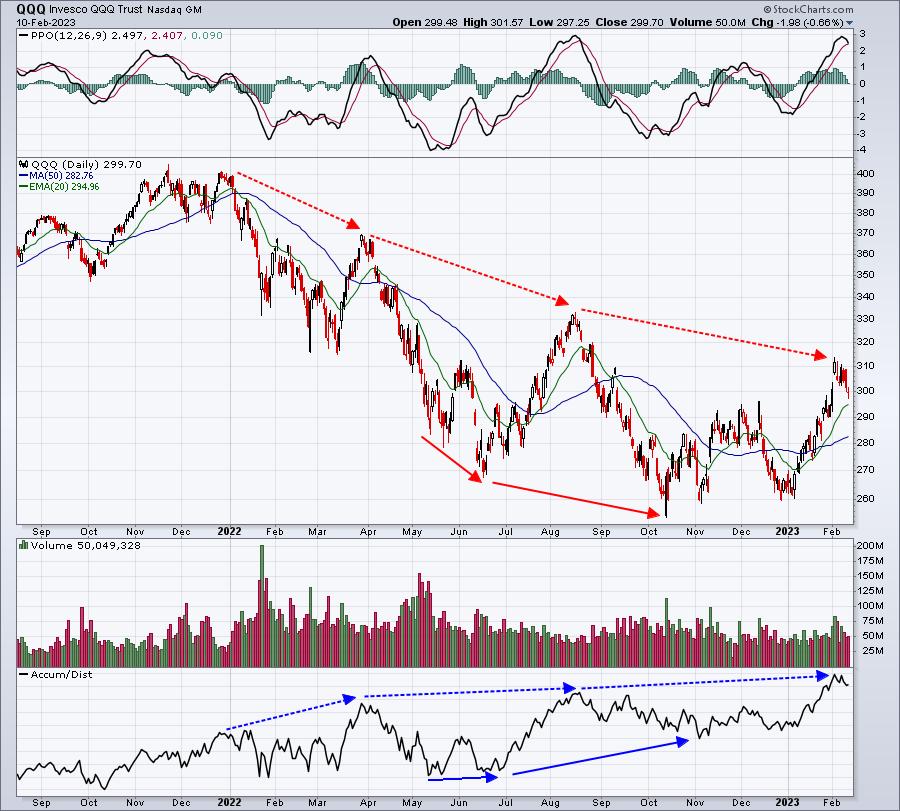
The accumulation/distribution line (AD line) was just one secondary indication of the manipulation that took place in 2022. We saw the AD line drop throughout the first few months of 2022 and approach year-to-date lows in May, but from that moment on, there was intraday buying that suggested the big Wall Street firms were gladly buying shares from those who believed this was the start of a secular, or long-term, bear market. Despite the still-downward slope of stock prices into year end and the start of 2023, the AD line has been sloping higher.
Manipulation At Its 2022 Core
I tracked the intraday price action for the SPY, QQQ, and several ETFs and individual stocks. There is not a single doubt in my mind that Wall Street used all of the negativity that THEY CREATED to benefit them as they were able to exit the market at the 2021 high and jump back in at much lower prices throughout 2022. Now we're seeing this manipulation come to its conclusion with the big run up in stock market prices in 2023.
Let me break down for you the price action in the QQQ in three distinct phases in 2022 and early 2023. The three periods are as follows:
- January 3, 2022-May 20, 2022
- May 23, 2022-October 13, 2022
- October 13, 2022-February 10, 2023
Within each of these periods, I'll show you how the QQQ traded at:
- The opening gap (panic reaction to news)
- From 9:30am to 11:00am ET (amateur hour)
- From 11:00am to 4:00pm ET (professional time)
Phase 1: 2022 Distribution
Here's the breakdown of how the QQQ traded during that January 3rd through May 20th period throughout the day:
- QQQ started period at 400.41
- Opening gaps (net): -29.68
- 9:30 to 11:00am ET (amateur hour): -68.01
- 11:00am to 4:00pm ET (professional time): -14.59
- QQQ ends period at 288.13
There was selling during every timeframe as the distribution and cyclical bear market was quite evident.
Phase 2: Then Comes The Market Disguise
Here's the breakdown of how the QQQ traded during the May 23rd through October 13th period throughout the day:
- QQQ started period at 288.13
- Opening gaps (net): -52.39
- 9:30 to 11:00am ET (amateur hour): -10.54
- 11:00am to 4:00pm ET (professional time): +37.46
- QQQ ends period at 262.66
Okay, this is where the charts don't tell us everything happening below the surface. The QQQ fell another 25+ points during this period, but check out the final FIVE hours of the trading day. It netted a GAIN of 37.46 throughout this period. This end-of-day strength is what strengthens the AD line that I showed earlier. Wall Street firms were steadily BUYING and ACCUMULATING, while prices continued to decline. I'm sure they'd like to thank everyone personally for their generous gift of their shares. It's Wall Street's very own version of "Go Fund Me".
Phase 3: It's Hammer Time!
The bottom is in, folks. October 2022 became the 7th October to lay claim to a bear market bottom in the last 14 bear markets - stretching back to 1950 on the S&P 500. Anyone think that's odd? There have been 14 bear markets in the past 73 years and half of them have ended in October. Aren't there 12 calendar months? Yet one has accounted for half the bear market bottoms? What a coinkydink!
Okay, so now let's check out how the QQQ has traded since the October 13th low close:
- QQQ started period at 262.66
- Opening gaps (net): +1.81
- 9:30 to 11:00am ET (amateur hour): +1.16
- 11:00am to 4:00pm ET (professional time): +34.07
- QQQ ends period at 299.70
Wait a second! Where did all those morning gaps go? And the morning selling - what happened to that? Wall Street firms had already filled their stockings for the holidays. No more manipulation required. Now we'll all watch as the news improves throughout 2023. The Federal Reserve has already started it. They've announced we're in a period of disinflation now.
"Yeah Tom, but what about the deep recession ahead?"
LOL. Did you see the jobs report last week? Unemployment is at a record low! Jim Cramer, a former Goldman Sachs child himself, now says the Fed can achieve a soft landing. In another six months, all the bad news and retreating stock prices will be in our rear view mirror. And Wall Street firms will be fat and happy.
This article is why EarningsBeats.com was formed. To research, analyze, and inform of all the Wall Street deception. Yes, technical analysis and analyzing price action is extremely important, but it's only a part of the battle. Uncovering the "legalized thievery", as I like to call it, and teaching those interested how to counter it, is a BIG part of successful trading. I spend countless hours doing this research for the benefit of our members. I issued warnings to our members and StockCharts community at large at the market top. I also said that being in cash or short in June 2022 carried way too much risk, so I called a bottom there. I believe it was the right call and it all stemmed from this Wall Street deception. There is a TON of money at stake in our financial markets. Ask yourself a question. Do you believe that the large Wall Street firms have our best interests in mind?
Short-Term Manipulation Runs Rampant Too
We've been offering our EarningsBeats.com members a look into monthly options expiration since the day I returned to EarningsBeats in 2019. Market makers have large inventories of call and put options as monthly options expire (3rd Friday of every month). The premiums they must pay out are quite substantial. But this premium only becomes a problem at that 3rd Friday close (which is this Friday, February 17th). Do you think market makers "might" try to direct prices in a certain direction if it means they could save BILLIONS of dollars? After all, they commit their vast capital in the financial markets every day.
I'm 100% convinced that market makers direct prices higher or lower heading into options expiration Friday to save money. Consider how the S&P 500 has traded during various periods of the calendar month since 1950:
- 26th-6th: +21.05%
- 7th-10th: -4.11%
- 11th-18th: +12.37%
- 19th-25th: -7.62%
From my practicing CPA days and the audits that I managed, I know that many companies have 401(k) retirement plans. Most companies send their employees' contributions to sponsors (Vanguard, Fidelity, etc) around the 1st and 16th of calendar months. Some companies will send other days, but the largest inflows will typically occur around the 1st and 16th. Wall Street firms know this money is coming in. So, again, here comes the "legalized thievery". Frontrunning is an illegal form of buying just ahead of retail money. But when Wall Street firms buy stock ahead of inflows, isn't that essentially the same thing? That's why the above annualized returns are strong from the 26th to the 6th and from the 11th to the 18th. Wall Street firms buy ahead of inflows, driving prices higher. And then comes the money from individuals and pensions, driving prices higher. Historically, the 7th to the 10th represents a profit-taking period. I believe the 19th to 25th is a combination of profit taking AND price manipulation due to options expiring. Monthly options expiration can only occur from the 15th of a calendar month through the 21st. The 3rd Friday of the month must occur on one of those 7 calendar days. The earliest the 3rd Friday can be is the 15th of the month and the latest is the 21st of the month. There are reasons why we would see options-related selling into the week after Friday options expiration, but I won't get into that here.
It's also very interesting that the worst-performing consecutive calendar days on the S&P 500 are the 19th and 20th. Typically, the stock market rises into the middle part of the calendar month, resulting in an imbalance of in-the-money calls vs. in-the-money puts. That helps to explain why we see weakness from the 19th to the 25th. It's another example of market makers running a "Go Fund Me" campaign. Unsuspecting retail traders pay the price, unfortunately.
We make certain that our EarningsBeats.com members are at least aware of stocks that could be subject to short-term market maker manipulation due to options expiring. I believe we have directional clues short-term that can significantly improve our trading success and performance. Beginning this weekend, we have launched an extremely affordable "Max Pain" service designed to provide our members clues about price direction this week. I hope you take advantage of it.

Happy trading!
Tom


