Our research at EarningsBeats.com includes extensive seasonal studies, working off the seasonality tool here at StockCharts.com. We've recently ended the best historical period of the year, which runs from the close on October 27, 2022 through the close on January 18, 2023. But the bullishness doesn't come to an end. It simply slows down. If you're looking for market sectors that historically perform well for the next three months, keep an eye on Technology (XLK) and Materials (XLB). These two sectors have been the most consistent outperforming sectors through May since this secular bull market began.
But how about an industry group that loves this time of year?
In my view, no single industry group that loves March through May quite like the specialty finance area ($DJUSSP). The following is the "relative" (vs. the benchmark S&P 500 index) seasonal performance by calendar month:
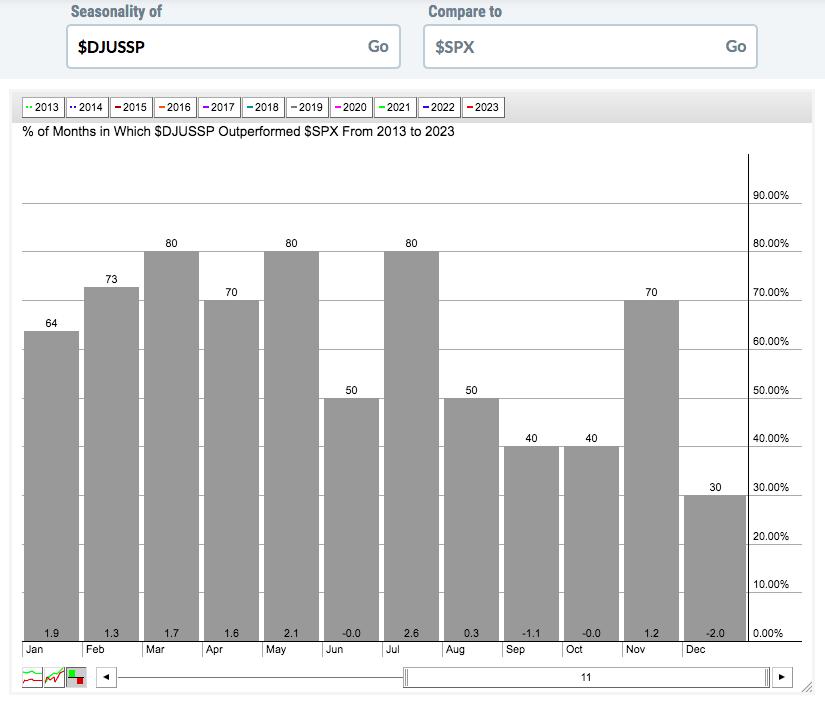
By adding up the monthly outperformance averages for each calendar month, we can quickly compute that the DJUSSP absolutely loves the first seven months of the year. Here's the outperformance of this group since the secular bull market began, broken down between the following two periods:
- January through July: +11.2%
- August through December: -1.6%
The sweet spot for specialty finance is March through May, however, as this three-consecutive-month period has been its best, outperforming the S&P 500 by 5.4% on average since 2013!
Perhaps the best news of all is that I see significant technical improvement in the DJUSSP currently, as you can see from the chart below.

In addition to an obvious uptrend since October, relative strength kicked in almost immediately as the new year began. Though the entire pattern isn't reflected above, the February weakness could represent a bottoming right shoulder in a reverse head & shoulders pattern that began during the second half of 2022. Clearing overhead price resistance at 520 on a closing basis would confirm the pattern.
At EarningsBeats.com, we provide our members with thrree portfolios comprised of 10 equal-weighted stocks, designed to outperform the S&P 500 over a quarter. Then we select 10 more equal-weighted stocks for the next three months and so on and so on. Our Model Portfolio has crushed the benchmark S&P 500 since the Portfolio's inception in November 2018 (+130.31% vs. +51.60%). We selected our latest portfolios at Friday's close, and I included a specialty finance stock as 1 of the 10 equal-weighted stocks in our Model Portfolio.
This specialty finance stock has outperformed the S&P 500, on average, by 17.2 percentage points from January through July, including 5.5 percentage points from March through May. I'll be providing my technical view on this stock in our next EB Digest. To sign up for our FREE EB Digest newsletter and receive this specialty finance stock, simply CLICK HERE and provide us your name and email address. There's no credit card required, and you may unsubscribe at any time.
Happy trading!
Tom


