I remain steadfastly bullish, but I do recognize reasons to be short-term cautious when I see them. I suppose the first question is, "what does it mean to be cautious." Well, I can only tell you what it means to me. While I still believe it makes sense to be long to some degree, I would not be a fan of being in leveraged ETFs on the long side. It has nothing to do with whether we go higher or lower next week. Instead, it has everything to do with managing risk. Folks, we're really overbought AND we just failed at key price resistance on the S&P 500. Check this out:
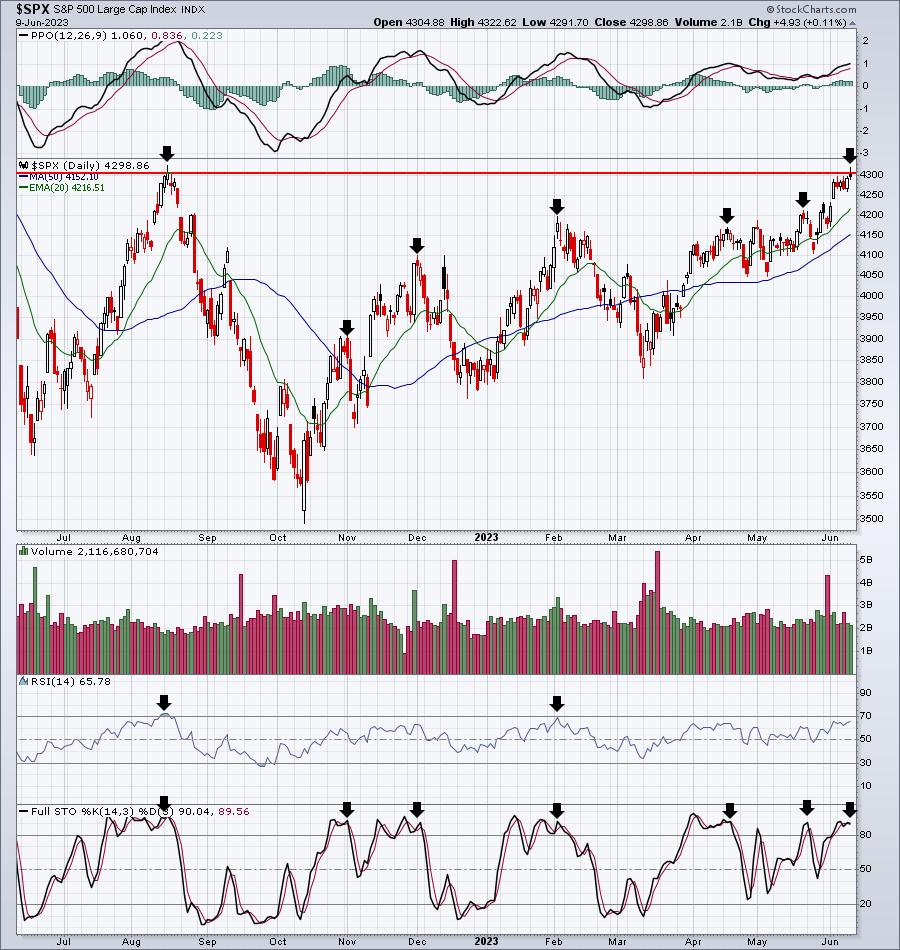
Not every top sees stochastic at 80-90 and RSI at 70, but you can see from the above chart that when the stochastic reaches at least 80, you should at least be thinking that a possible short-term top is at hand. The RSI 70 level is always one to keep an eye on. We're not there yet, but RSI 65 is a high level compared to what we've mostly experienced over the past year. We're overbought to some degree without a doubt. The bigger issue, however, is that 4305.20 was the key closing price resistance and 4325.28 was the intraday high - both occurring on August 16, 2022. I don't like failed breakout attempts in any market.
Options Expiration Week
Listen, there's a reason why the S&P 500 has struggled in the middle to latter parts of calendar months since 1950. In my opinion, it's all about monthly options expiration. This Friday, June 16th, monthly June options will expire. I call this week and the few days following options expiration "Opposite George" week, a Seinfeld analogy. During that episode, George Costanza, whose always pessimistic and down on his luck, is encouraged by Jerry and Elaine to start doing the opposite of every instinct he has. Not too surprisingly, George's life and fortunes turn for the better. My experience is that the stock market pulls off a similar "Opposite George" type of week as monthly options expire. When the stock market is trending higher into monthly options expiration week, we tend to see strong sectors, industry groups, and individual stocks lag, while weak counterparts tend to suddenly reverse and push higher. I've seen a number of very obvious reversals, including one that occurred after the S&P 500 was incredibly weak during the 2022 cyclical bear market:
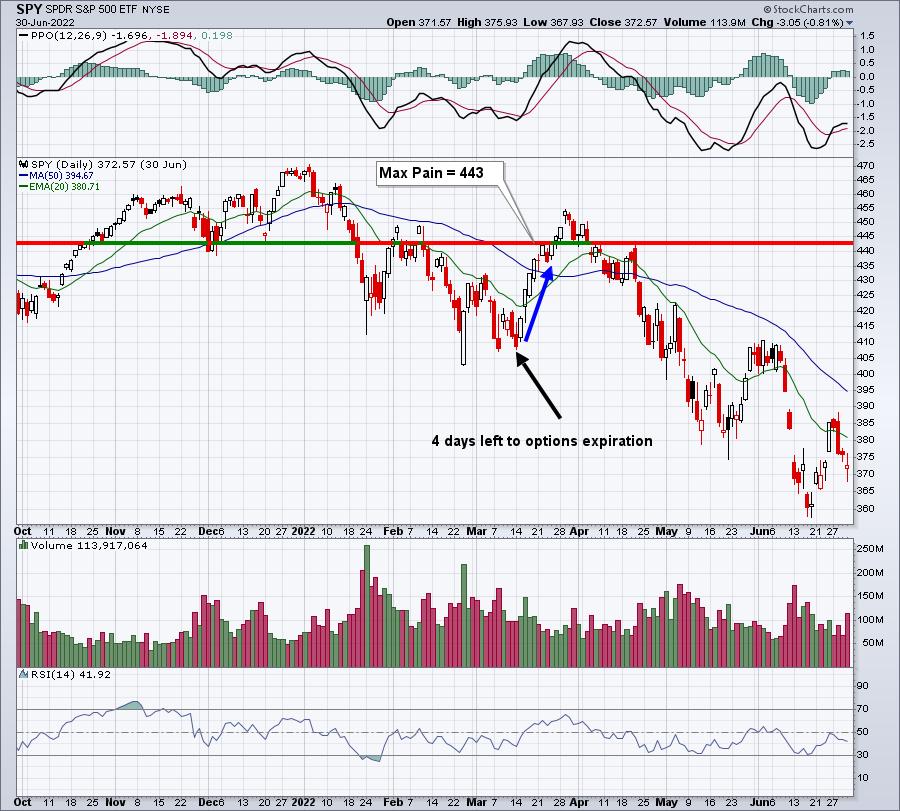
Clearly, this was an extreme case. The net in-the-money put premium on the SPY and QQQ was over $5 billion - on just two ETFs! So you can imagine how much money was on the line for market makers across all index and stock options that week. It was NOT a guarantee of higher prices. Rather, we use this option expiry information as a directional clue.
We have a dedicated "Max Pain" event for our EarningsBeats.com members every single month, because we feel it's THAT important. Our next one will be held this Tuesday, just after the stock market closes. If you'd like to be a part of it and you're not already an EarningsBeats.com member, please take advantage of our 30-day free trial and join us! It will help you to improve your trading success and to better manage your risk during this unique period during the month.
As I look ahead to options expiration this Friday, there's plenty to worry about. Let me give you just one example. I love Advanced Micro Devices (AMD) and believe it's going much, much higher in time. But it has big-time issues this week. Before I show you some key options information, look at the negative divergence that AMD will face IF it can manage to test overhead price resistance:
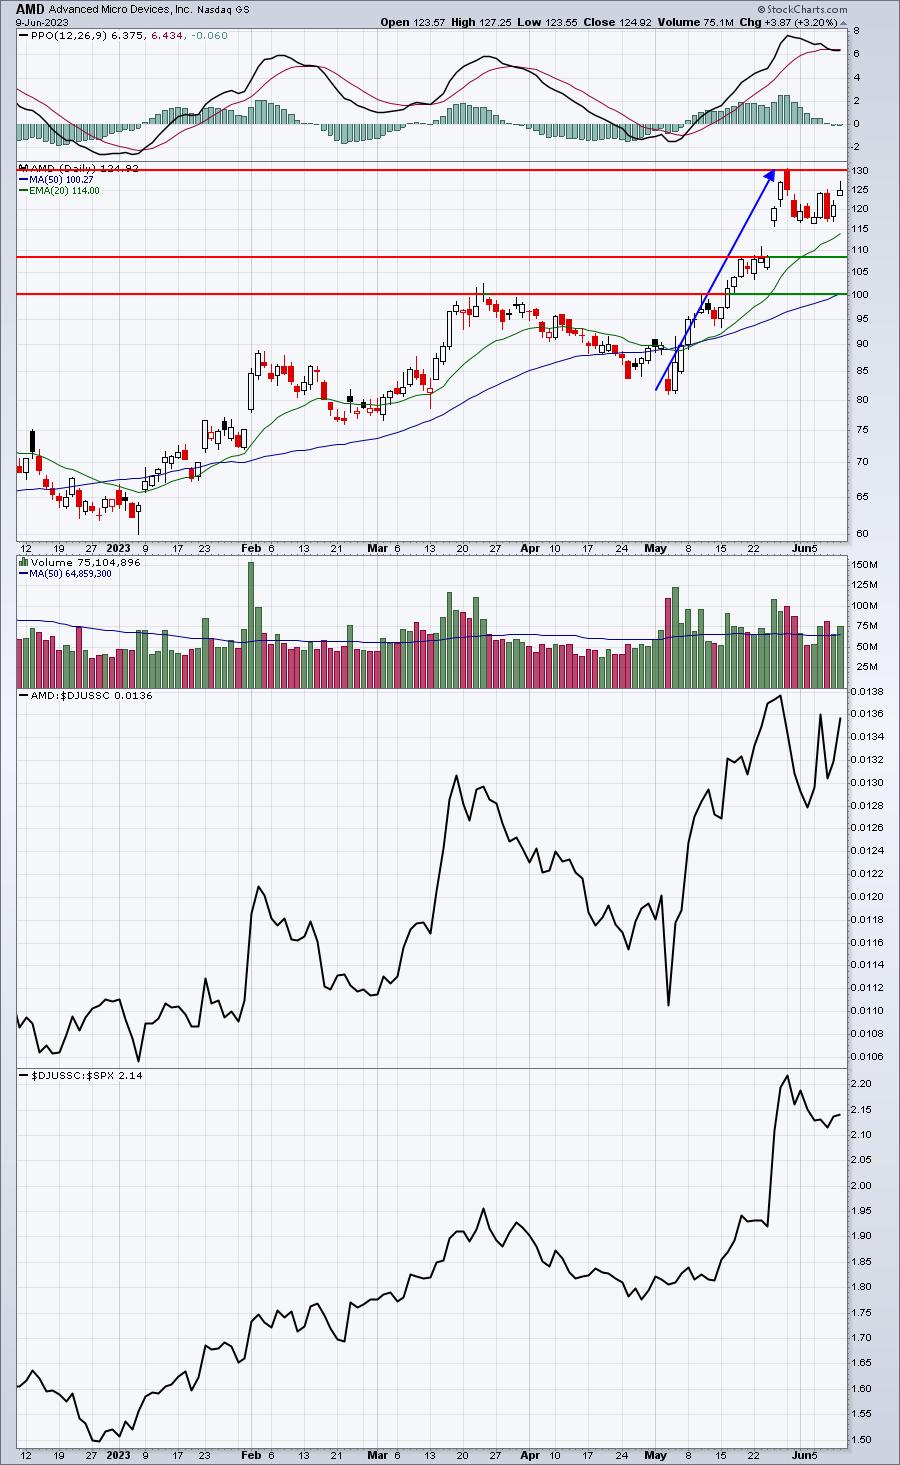
AMD is a leading stock in one of the hottest industry groups - semiconductors ($DJUSSC). So it's very easy for me to love this stock. HOWEVER, I cannot ignore the short-term risk of owning it. Please keep in mind that high risk of owning does not mean AMD is guaranteed to drop. But to buy AMD at this level, knowing that it's quite overbought and that there is a TON of net in-the-money call premium, carries very significant risk. As a trader, one of my goals is to manage and limit my risk. Buying AMD here goes counter to that.
Now let me show you a little bit about AMD's June options profile. From cboe.com, here is public information that you should be aware of, with respect to AMD:

The far left column is the number of call option contracts that remain open at every strike price shown. The far right column is the number of PUT option contracts that remain open at every strike price shown. There is not a single strike price above 125.00 (ie, in-the-money puts) that has more than 1000 open put contracts. Meanwhile, check out all the open call contracts that are in the money.
- 12000 at 60.00 (not shown above)
- 10000 at 75.00 (not shown above)
- 29000 at 80.00 (not shown above)
- 23000 at 90.00 (not shown above)
- 38,000 at 100.00 (not shown above)
- 25000 at 105.00
- 42000 at 110.00
- 33000 at 115.00
- 17000 at 120.00
- 46000 at 125.00
I haven't calculated the net in-the-money call premium, but it's clearly going to be in the hundreds of millions of dollars. When market makers have sold these calls, it's quite likely that they bought the underlying stock (covered call strategy), so they are NOT at risk to lose money if AMD keeps moving higher. However, if demand wanes and market makers sell their long positions and move to short positions, we could see a significant drop in AMD this week, which would lead to a windfall of profits for market makers. That's where the risk of being long comes into play. And it's not just AMD. There are plenty of NASDAQ stocks, in particular, with the same options issue as AMD. That's also why it's quite possible that our major indices struggle in the week ahead.
I use max pain as simply one indicator, no more impactful than a negative divergence or an overbought condition. But everyone should be aware that there's an absolute TON of net in-the-money call premium across many areas of the market and selling could kick in over the next week to 10 days, especially if the S&P 500 cannot negotiate 4305 price resistance.
Happy trading!
Tom


