I've always been impressed by the strong correlation between the U.S. and German stock markets. Sometimes the strength in one of these markets can help to influence the direction of the other. Let me show you a long-term chart of the S&P 500 ($SPX) and the German DAX ($DAX):
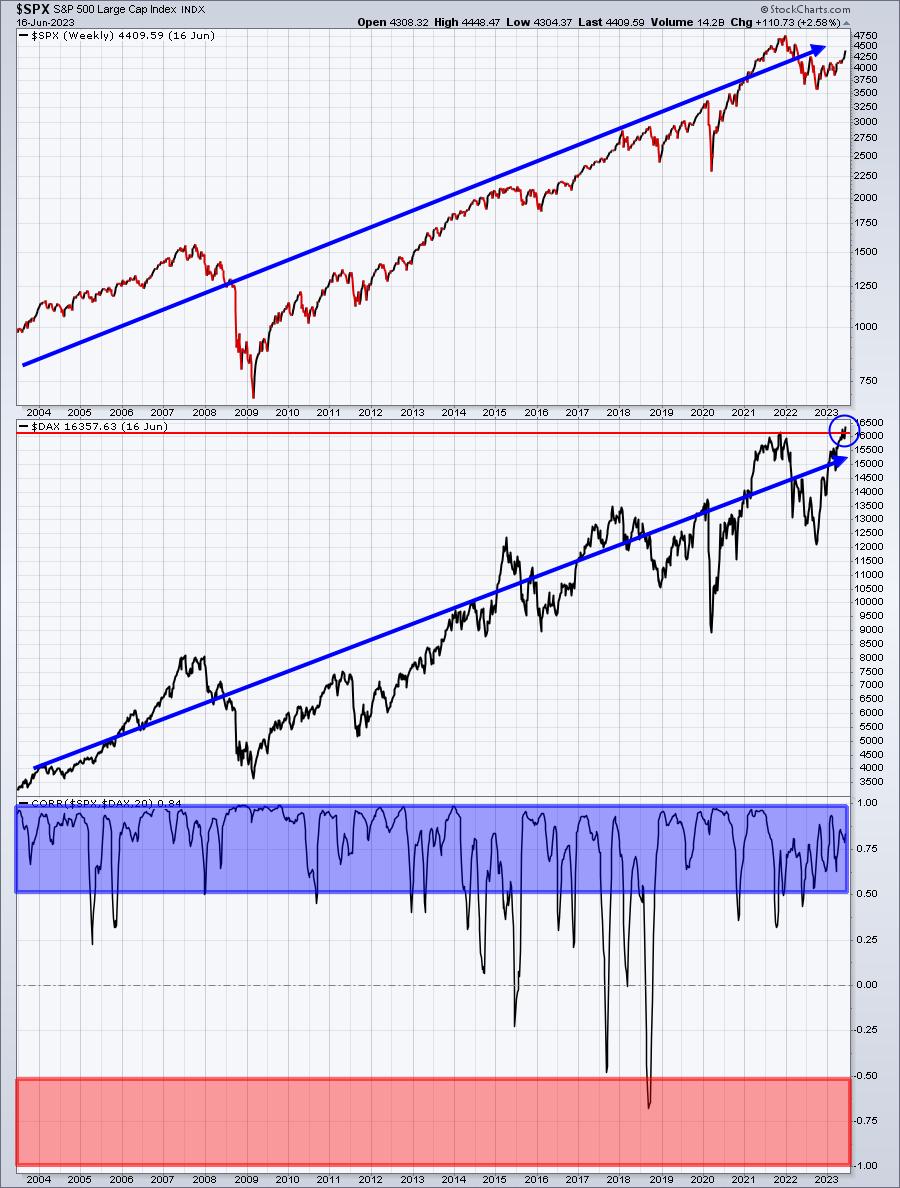
There are a couple of interesting points I'd like to make here. First, notice the correlation in the bottom panel. It remains extremely positively correlated. In other words, if the S&P 500 is moving higher, we should expect the same in the DAX, and vice versa. That leads me to my second point. The German DAX has broken out to a new all-time high. If you have wanted to question the plethora of reasons I've provided over the past year why I believed the S&P 500 bottomed last June and was poised to rally and make all-time highs, well here's another one you can feel free to argue. The DAX is at an all-time high. Don't blink, because you're going to miss the S&P 500 all-time high if you do.
Now you might think, well a stock market is a stock market and if one goes higher, they all go higher, right? You might want to think again. I would always chuckle when an analyst would appear on CNBC and make disparaging remarks about the S&P 500, because of market weakness in China. Would you like to see the same chart highlighting the correlation between the S&P 500 ($SPX) and the Shanghai Composite ($SSEC)? Check this out:

While I would argue there's more positive correlation than inverse correlation, I think it's rather obvious that the S&P 500 is much more highly correlated to Germany than to China based on the two charts above.
Based on the strong correlation in equity markets, I began looking at economic strength between the U.S. and Germany as a gauge for the direction of the U.S. dollar ($USD). After all, if one country shows economic strength vs. another, its currency should rise. As an economy strengthens, we typically see treasury yields rise. A weakening economy will normally see the opposite - falling yields as central banks will look to lower rates to stimulate economic growth.
Several years ago, I started looking at the relationship of treasury yields between the U.S. and Germany to see if there's a correlation with the direction of the dollar. Economics 101 always taught me that rising yields would aid a currency, while falling yields would result in a falling currency. When I studied Economics, however, global economies weren't so interwoven. It makes more sense now to look at the strength of one economy vs. another to help determine the direction of its currency. So let's look at the U.S. 10-year treasury yield ($UST10Y) vs. Germany's 10-year treasury yield ($DET10Y) and compare the difference vs. the direction of the U.S. Dollar ($USD):
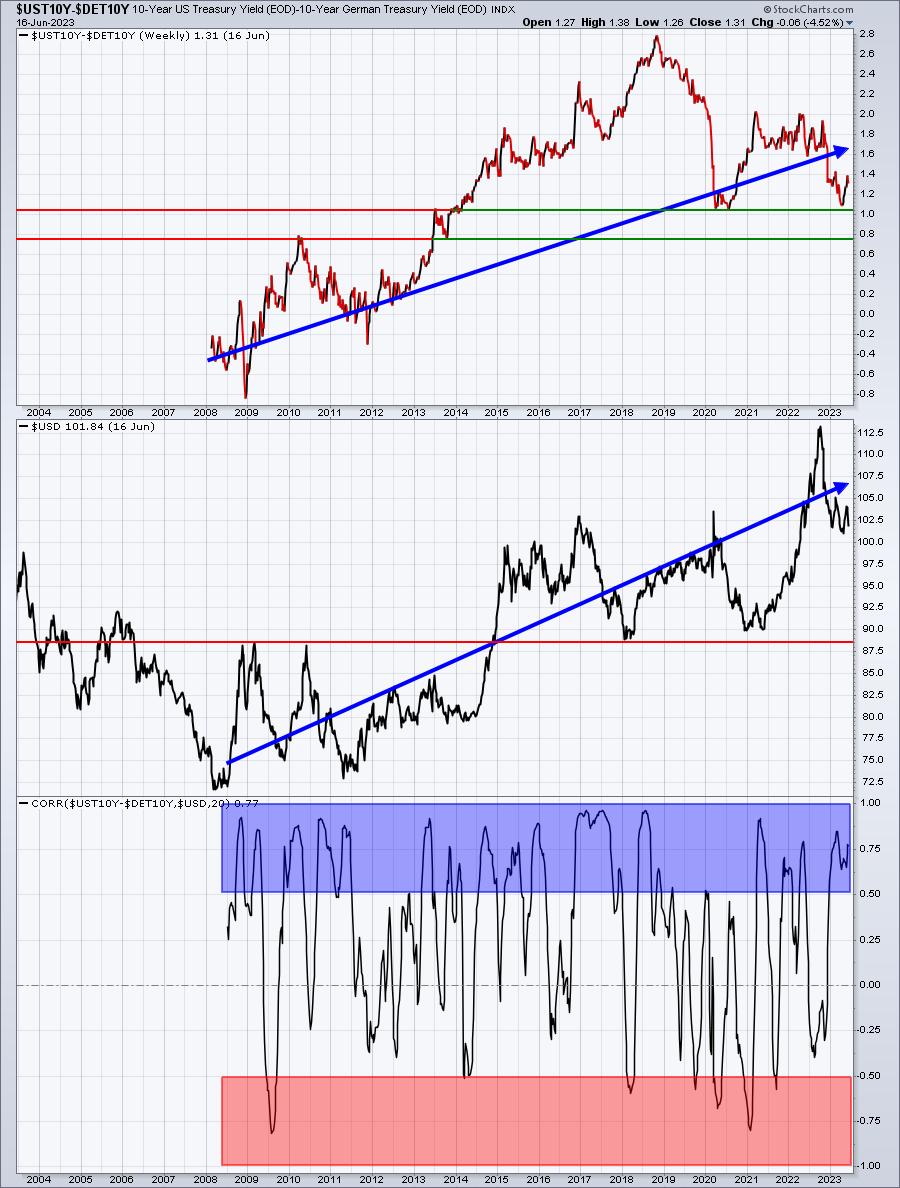
The correlation tends to be quite positive, meaning that when the $UST10Y minus the $DET10Y is rising, the dollar ($USD), more often than not, will rise right along with it. The opposite holds true if this relationship is falling. As I look at the UST10Y minus DET10Y (top panel), I see what appears to be a very significant support level just above 1.0. If this level fails, then I could see a significant drop ahead for the U.S. dollar. However, if it holds and pushes higher, I'd look for another spike in the dollar.
If you like using correlation and working through relationships using a common sense approach, then you'll love my first-ever "State of the Market" report that I'll be sending out to EB.com members either Tuesday or Wednesday. It was just over one year ago today (June 16, 2022) that I called an S&P 500 bottom near 3600. The S&P 500 has risen more than 20% since then, closing on Friday at 4410, and confirming that the next leg of the secular bull market, that began in 2013, is underway.
I mention this because we are offering BIG discounts to our annual subscription rate of $997. As part of our Anniversary Special, and for the next 34 hours or so (offer expires midnight on Tuesday), we'll throw in our normal 30-day trial AND two free bonus months. So it's a "15-month for the price of 12" special to receive the best market guidance, research, and education on the planet. But it ends tomorrow. If you'd like to take us up on this special, simply write to us at "support@earningsbeats.com" and put "Anniversary Special" in the title. We'll get back to you and help you get set up. This special is not available anywhere on our website, so it's catered to folks here at StockCharts.com and those who have followed me over the years as part of our free EB Digest community. Once again, it ends tomorrow, so I hope you'll take advantage of this special offer and join our growing EB.com community!
Happy trading!
Tom


