Hello to all my StockCharts supporters! First of all, thank you for your readership of my Trading Places blog, which is now in its 8th year. Also, thanks to all of you that watch my Trading Places LIVE shows that air on Tuesdays, Wednesdays, and Thursdays at 9:00am ET. I really appreciate your loyalty and support!
Today, we launched a new "EB Weekly Market Report" product that will be published every week on Sundays (occasionally Mondays) and will be made available as part of our regular service. There is no increased membership cost as a result of this new product. I am providing our first edition of this new weekly report below, so that you can get a sense of the in-depth analysis and research that we do at EarningsBeats.com. If you like the report, please take advantage of our 30-day FREE trial and try out all of our services for the next month, including the next four editions of this EB Weekly Market Report. September can be a cruel month, so get our latest thoughts as we navigate what historically has been a very difficult month.
************************************************************************************************************
Below is our first EB Weekly Market Report, which will be published on either Sunday or Monday of every week. It will replace our Monday EB Daily Market Report and provide all of our members with a broader "Big Picture" outlook on the U.S. stock market. Our market outlook will focus more on longer-term weekly charts, as opposed to the daily charts more often used in our EB Daily Market Report. We believe it enhances our current product lineup and appeals to everyone - those with a longer-term mindset and those focused primarily on the near-term.
Because of our "top-down" approach to trading, it makes a lot of sense to begin each week with a Big Picture focus, citing the current long-term technical outlook and how that might impact the market given our short-term signals that we discuss daily. This EB Weekly Market Report will also provide a consistent, once-per-week review at key sentiment and intermarket relationships that we value so highly at EarningsBeats.com and has helped us to guide our members through a very tumultuous 3-4 year period, beginning with the 2020 pandemic, right through the most recent 2022 cyclical bear market and subsequent secular bull market advance.
We'll also review the prior week's action and provide trade setups, but mostly with a longer-term mindset - think of longer-term swing trading, which should appeal to those of you that like the idea of longer-term momentum trading, providing wider stops and targets.
Let's get started with our very first edition of our EB Weekly Market Report, beginning with the action from last week.
Weekly Market Recap
Major Indices
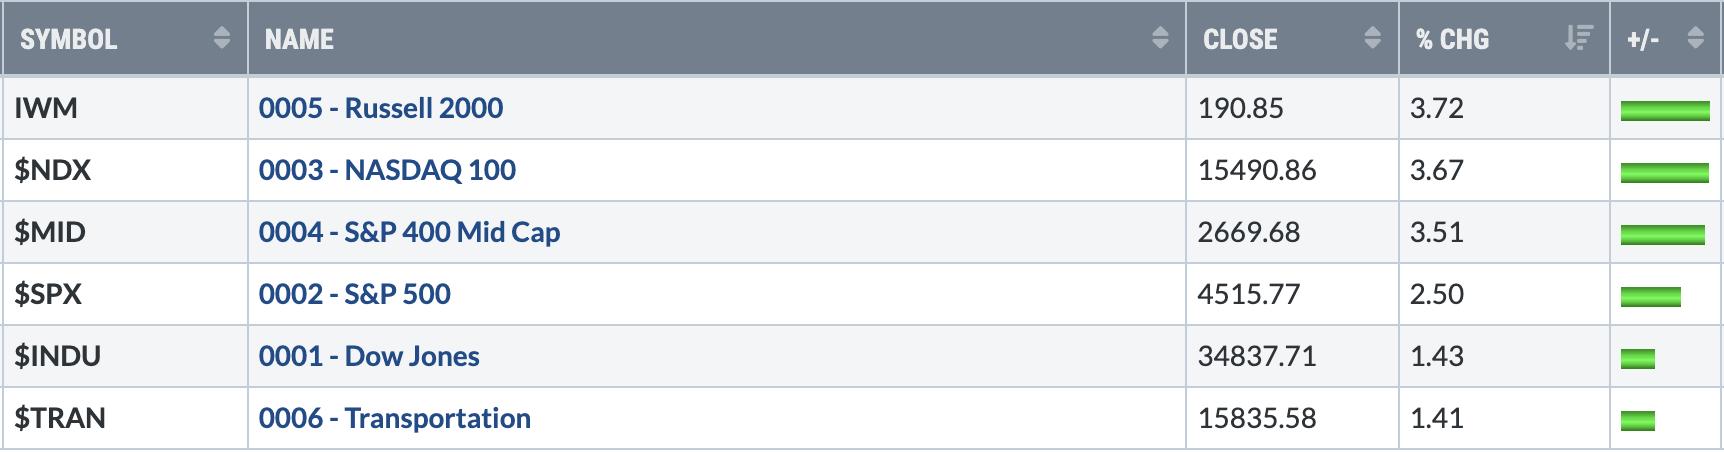
While we saw strength across most areas of the U.S. stock market last week, small and mid caps did show leadership. For this leadership to continue, it'll be important to see consistent strength from industrials, financials, health care, and energy as these are important sectors weighted heavier in the IWM than what we see in the benchmark S&P 500. For mid caps (MDY), industrials comprise 22.4% of the entire ETF, followed by consumer discretionary and financials.
Sectors
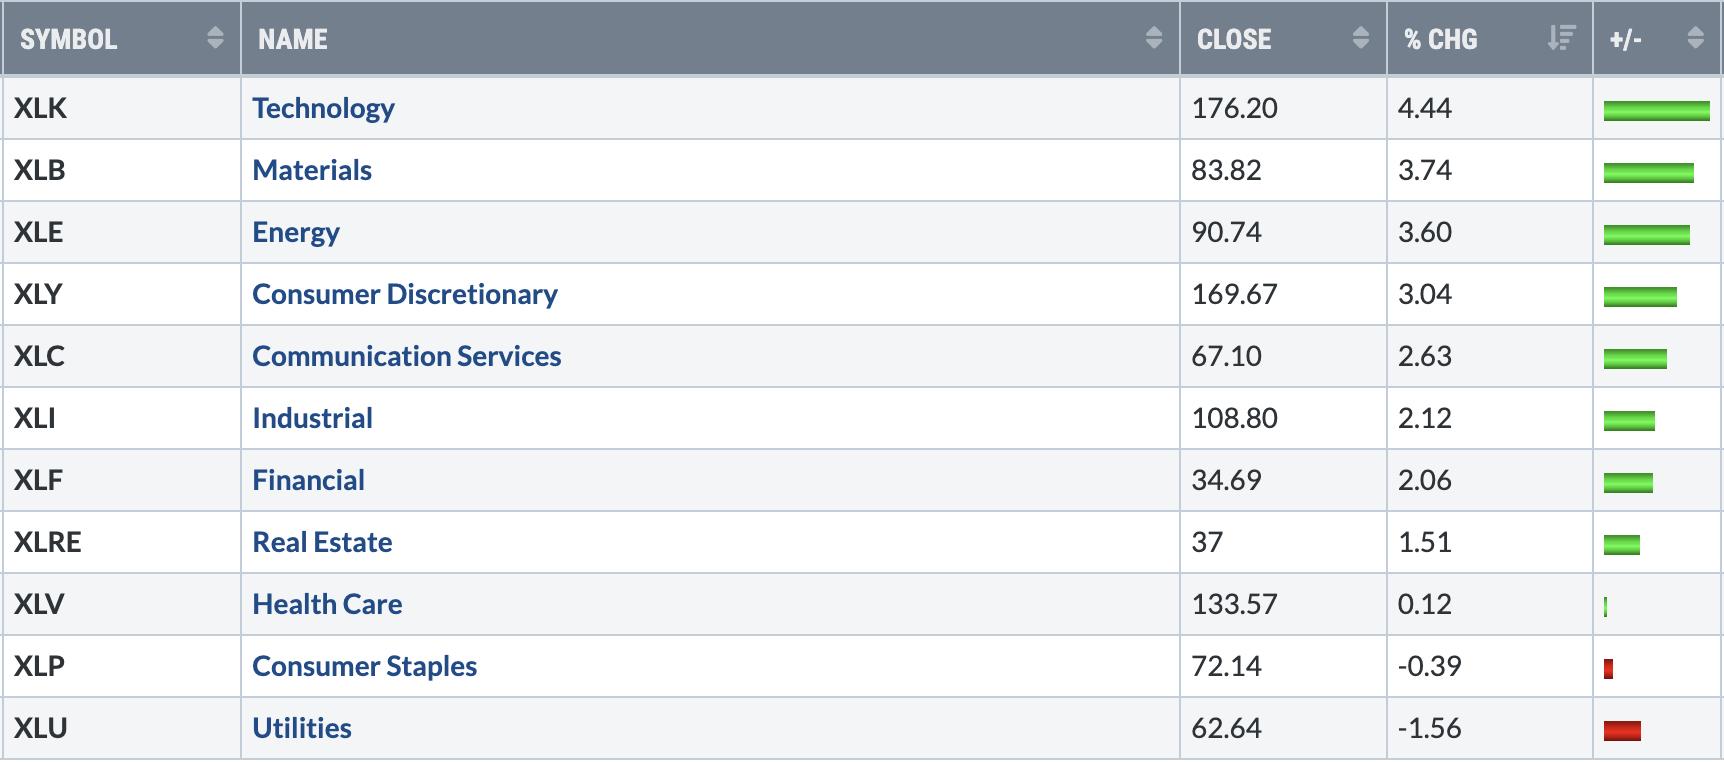
Clearly, there was some rotation last week away from growth and into value, though growth still performed fairly well, as evidenced by the leadership in technology. The best period of the year for growth vs. value is May through August, though the first 4 months of the year are relatively strong as well. However, we've seen historical bullishness from value stocks vs. growth stocks during the final 4 months of the year, starting with September. We've had a big run in technology and other growth areas, so repositioning now into more value and less growth makes sense for many.
Top 10 Industries Last Week
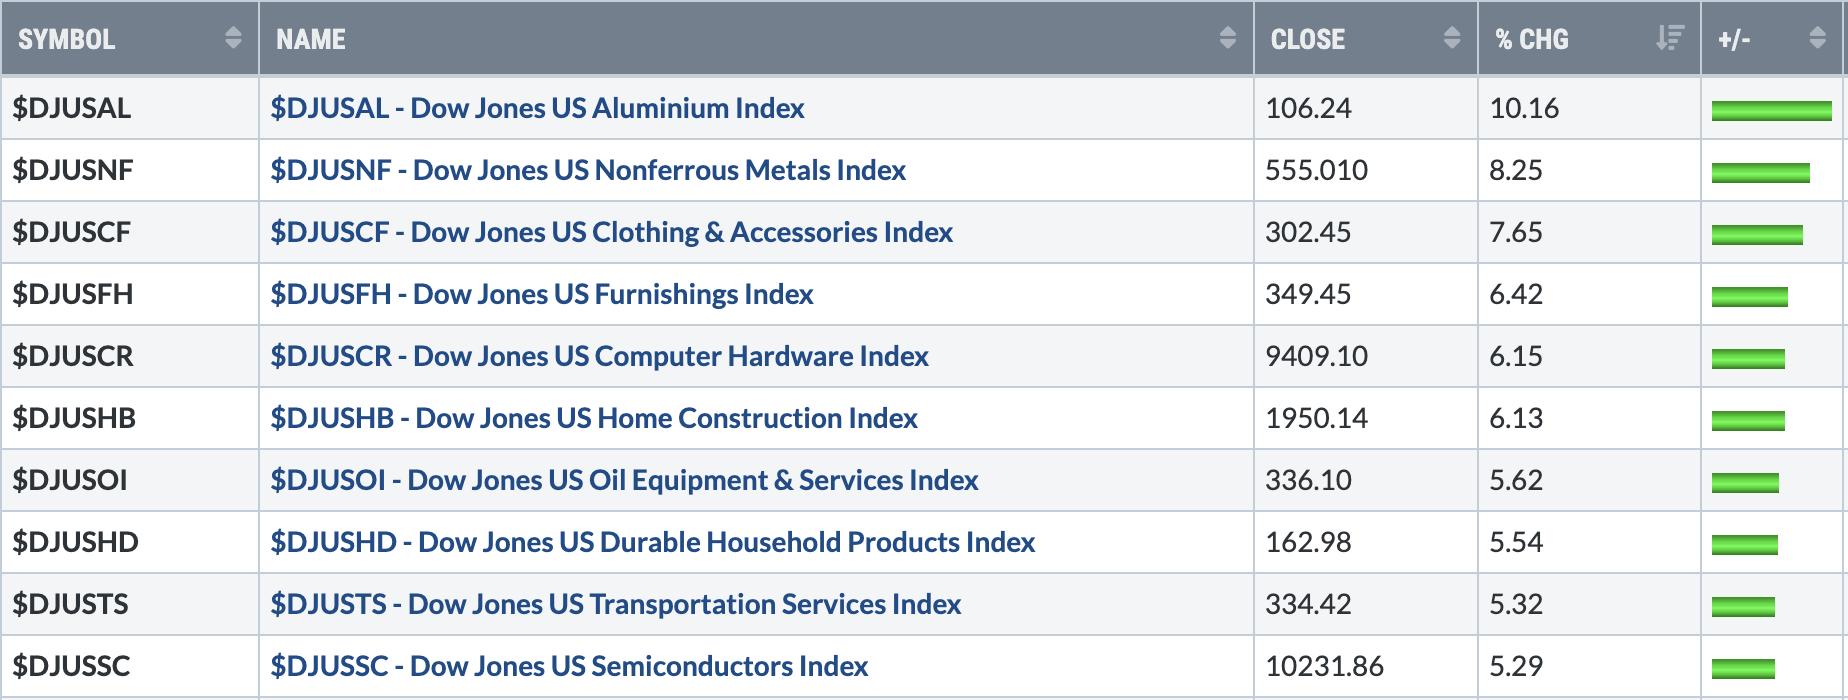
Both home construction and semiconductors have had HUGE runs in 2023 and have helped to lead U.S. stocks higher, but both will sport MAJOR negative divergences on their weekly charts should they reach new highs any time soon. Check these out:
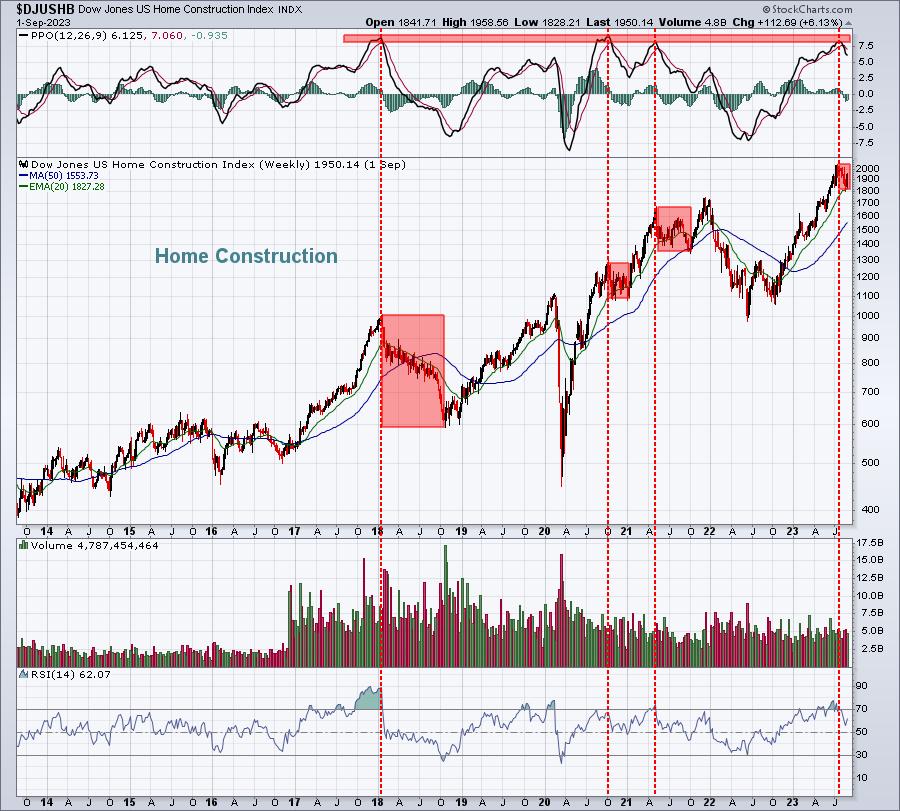
You can see what's happened in the past when home construction stocks reach a weekly PPO of 7.5 (red-shaded area). It doesn't necessarily result in a massive selloff, but we should certainly lower our expectations bar, given how much this group has run. And if the DJUSHB breaks out again, it'll likely be accompanied by a massive negative divergence. Remember, it's not always about being right or wrong, it's about managing risk. I see a TON of risk in this chart and one of the weakest calendar months for this group since this secular bull market began in 2013 is September. Maybe we see a September swoon with a later rally in October and November. November is the group's best month, rising EVERY year in November since 2013 and averaging a 6.2% gain in that month alone.
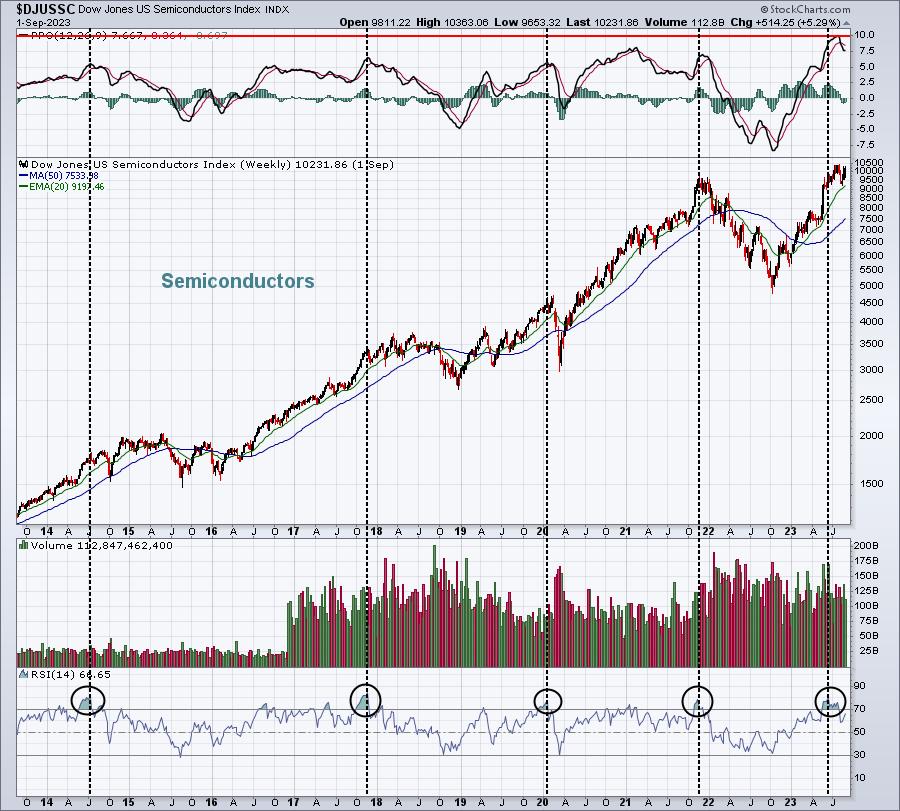
I believe we're in a secular bull market and we're going higher. So it PAINS me to think any bearish thoughts about one of my favorite industry groups. But history doesn't lie. The charts don't lie. Semiconductors have been a clear leader - not only during this advance in 2023, but also throughout the entire secular bull market run. I could argue, however, that this group has not been this overbought since the secular bull market began. I've highlighted 5 times (including right now) the DJUSSC has seen its weekly RSI move to the mid-70s or higher with black-dotted vertical lines. I've also highlighted that the current weekly PPO had never reached 10 - until the 2023 surge. I LOVE this group, but it needs a period of consolidation BADLY. While I won't say it can't go higher in the short-term from here, I absolutely would not be surprised at all to see it fall into a period of consolidation, similar to what we've seen in the past when it becomes so overbought.
Bottom 10 Industries Last Week
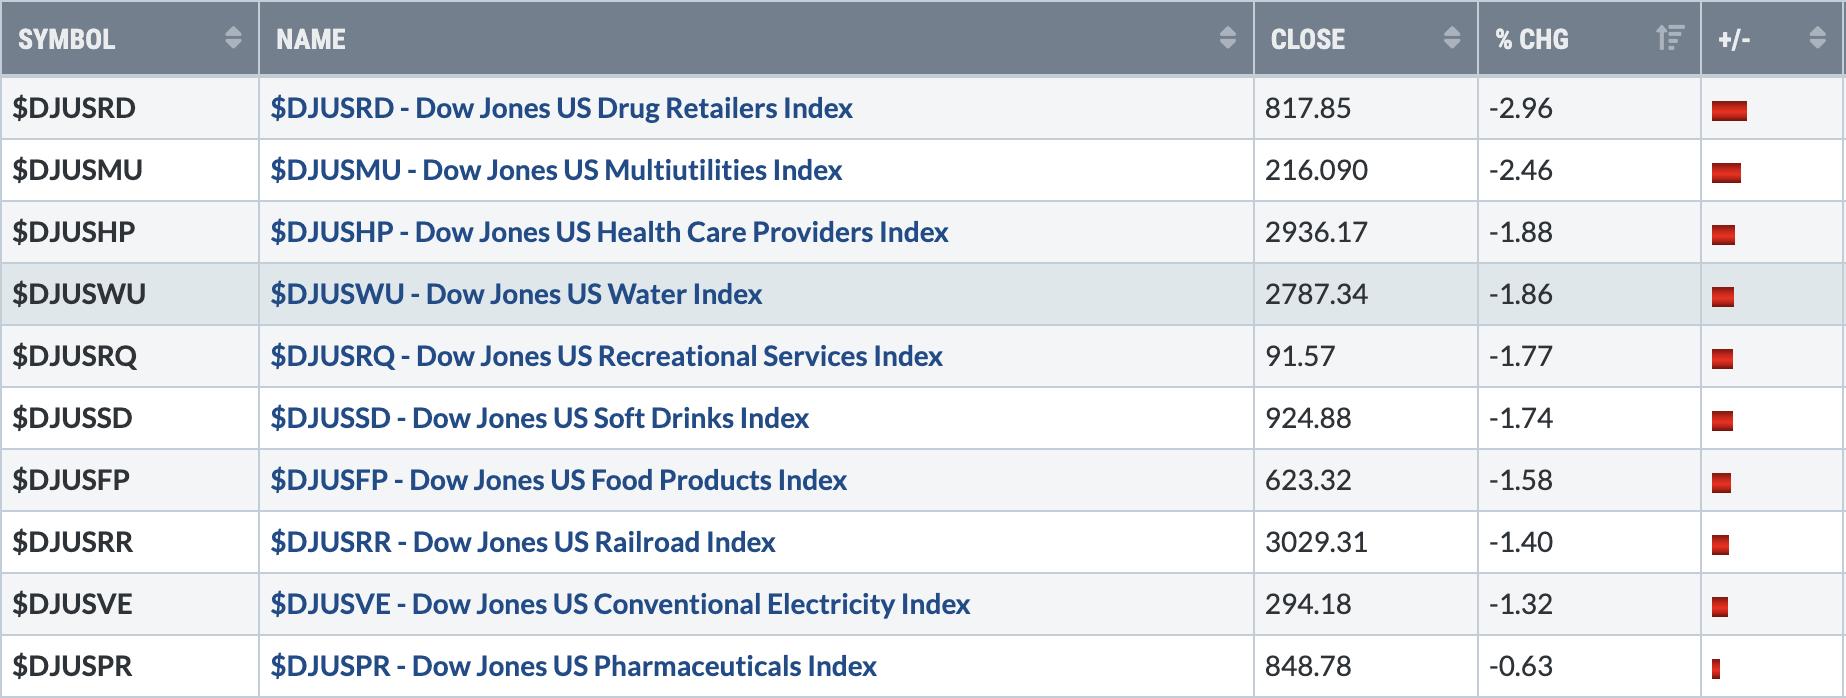
One signal that can scare me is when I see defensive areas of the stock market lead during an advance. Needless to say, I feel very comfortable with last week's rally as the Bottom 10 industries is LITTERED with defensive groups. When I look at these groups on a longer-term weekly chart, I believe health care providers ($DJUSHP) is one group that could be poised to reverse. Recreational services ($DJUSRQ) is another. Take a look:
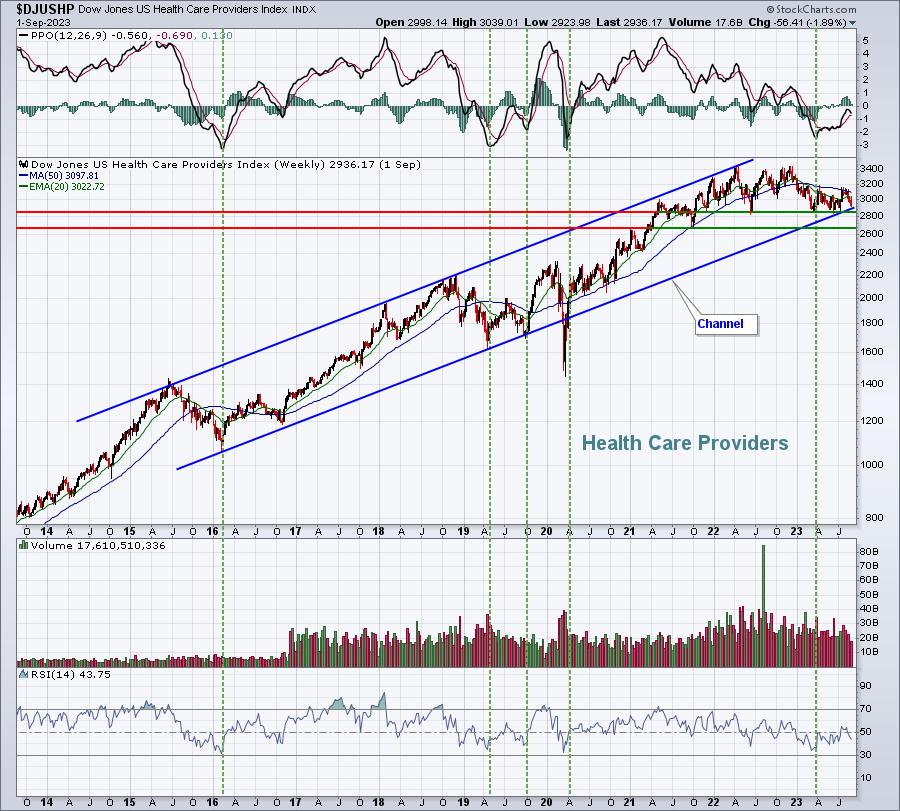
Health care providers have been in a solid channel throughout this secular bull market, interrupted only by the 2020 pandemic scare. Otherwise, the channel is almost perfect. Notice where we are right now, testing the lower channel line. These tend to be the absolute best long-term entry points. Also, the green-dotted vertical lines mark the PPO trips and bottoms deep into negative territory. I typically like momentum trades, including areas that are rising. But I'd have to say, from a longer-term perspective, buying stocks in areas testing critical support would likely be a better trading opportunity for many of you, especially those of you that don't like to chase, but would rather buy at or near bottoms. One final thought. Seasonally, the best two-consecutive-month period for health care providers is easily October-November, which is right around the corner.
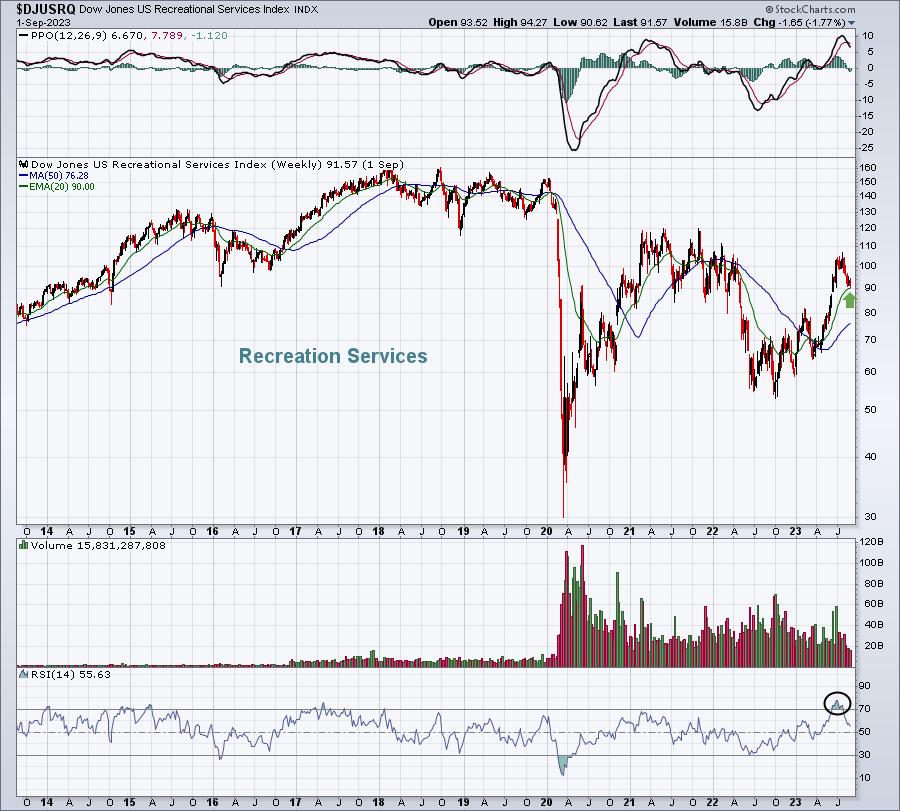
Ordinarily, I'd be concerned about a group where its weekly PPO just touched 10. However, we have seen a pullback to the rising 20-week EMA that's helped to relieve those overbought conditions. Also, let's keep in mind this group was tortured during the 2020 pandemic. Even after the huge recent advance, the group is still down more than 40% from its pre-pandemic high. I'm looking for a rebound off this rising 20-week EMA test. If I break down this group's historical performance by quarter since 2013, here's what it looks like:
- Jan-Mar: -1.2%
- Apr-Jun: +1.0%
- Jul-Sep: +2.3%
- Oct-Dec: +7.7%
We're moving into the sweet spot of the year for recreational services.
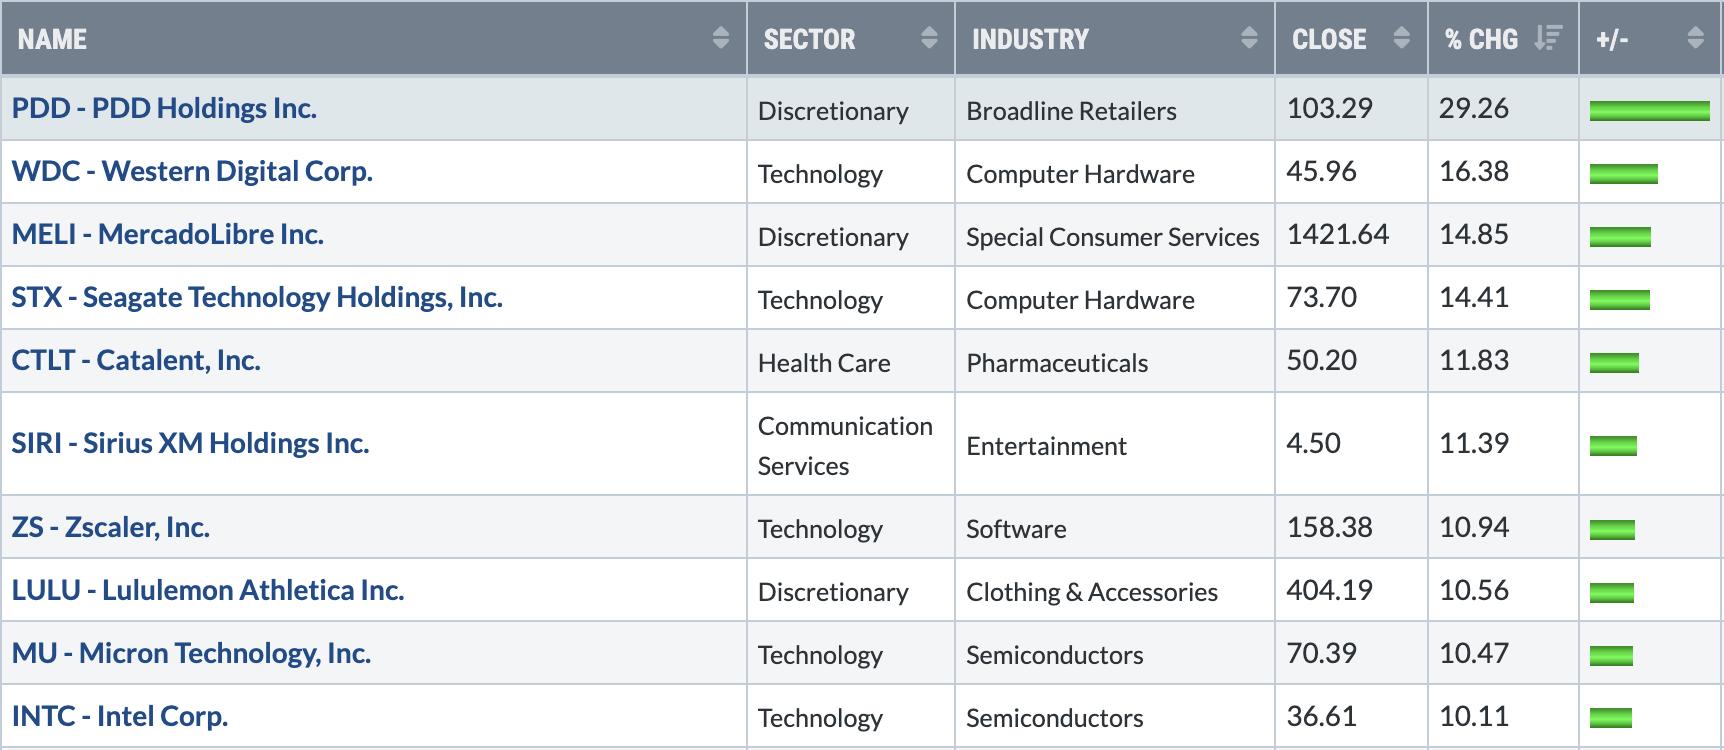
Top 10 Stocks - S&P 500/NASDAQ 100
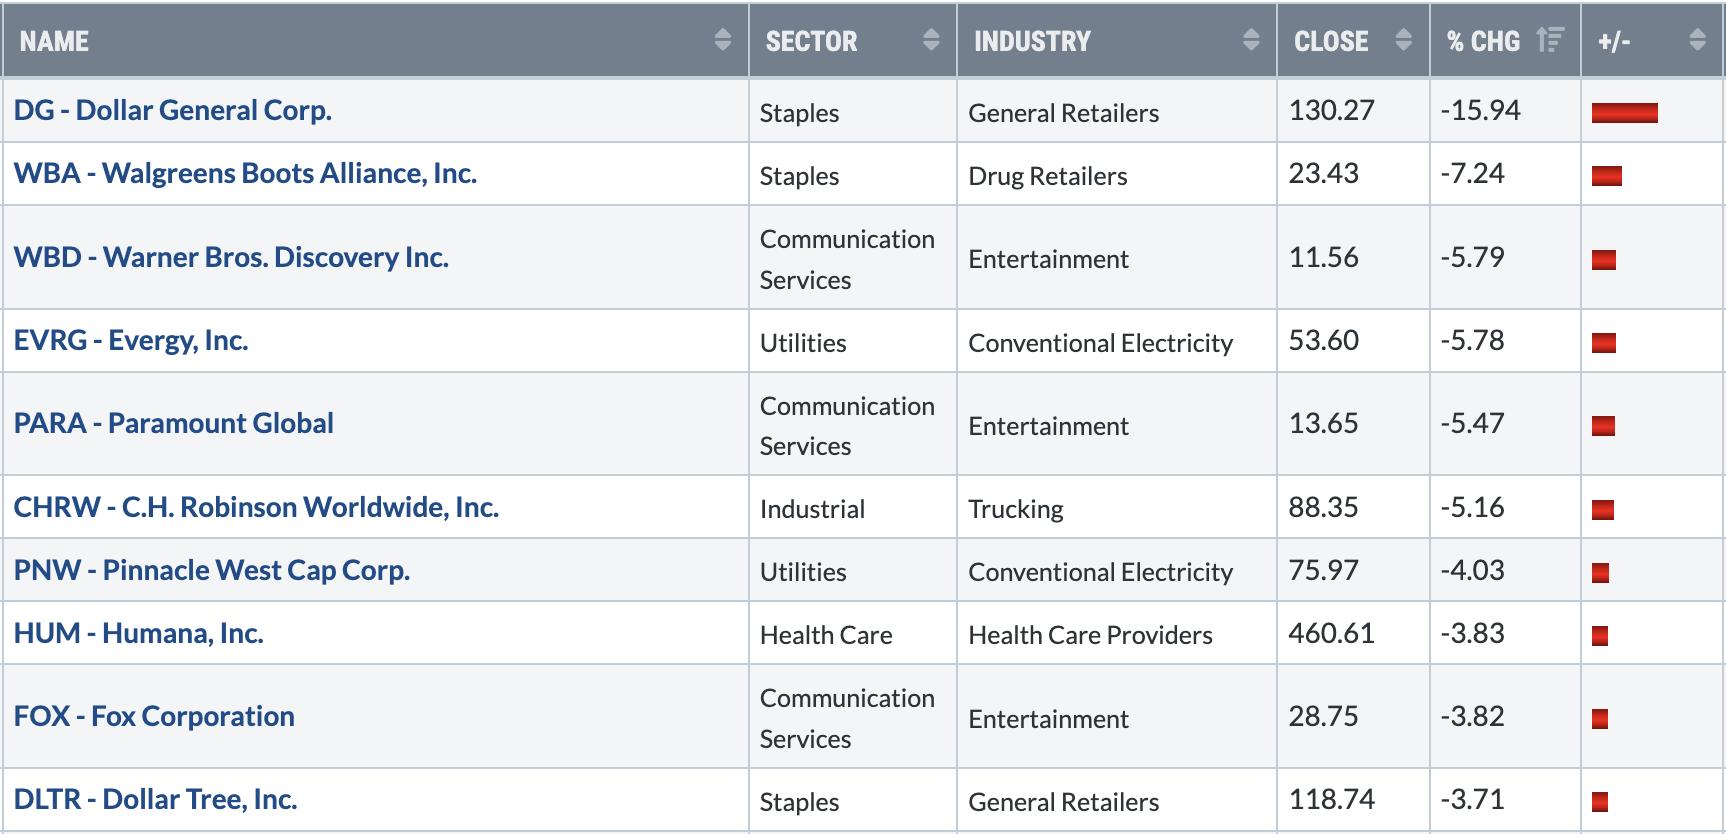
Bottom 10 Stocks - S&P 500/NASDAQ 100
Big Picture - September 2023
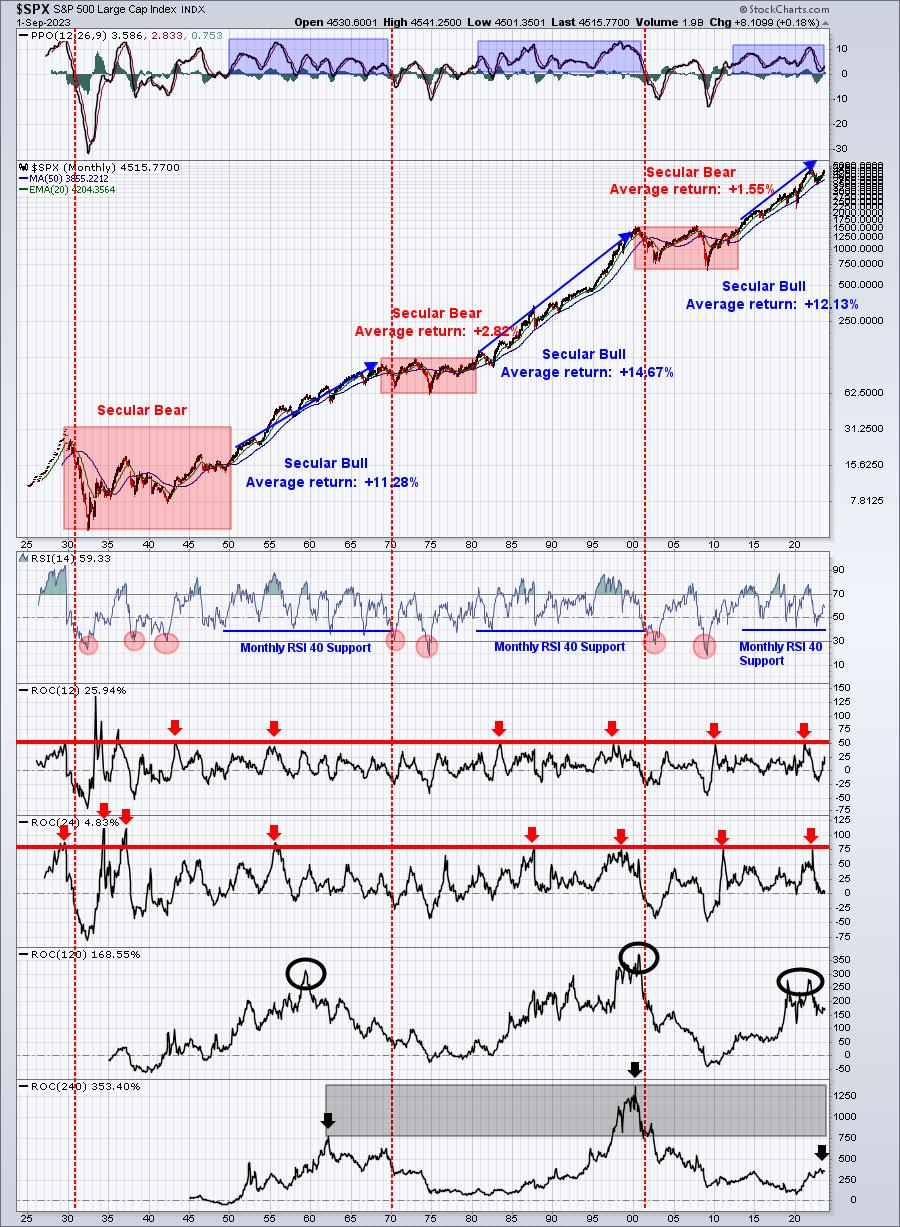
It all starts here. When I talk about "perspective" with respect to the U.S. stock market, this chart is the poster child. The first thing we must all understand when we approach stock trading is whether we're in a SECULAR bull market or SECULAR bear market. During each, we often see countertrend CYCLICAL bear markets and CYCLICAL bull markets, respectively. But, if you want to achieve a higher success rate trading stocks, it's imperative that you get this first step right. With long-term perspective, you can see short-term volatility and countertrend moves much more clearly and BEFORE they happen. Without that long-term perspective, your short-term view can get very cloudy and, unfortunately, very emotional. Emotional trading leads to BIG losses. We need to trade and invest with CLARITY and CONFIDENCE to understand the next LIKELY move in U.S. stocks.
Here's what I'm seeing when I pull up my 100-year chart on the S&P 500:
September Update:
We can talk about different signals on this chart, but for today, let's focus on those two bottom panels - the long-term 120-month rate of change (ROC) and the 240-month ROC. These represent 10-year and 20-year "look back" periods to see how far the S&P 500 has run over those two time frames. In the 120-month ROC, the 1950s-1960s SECULAR bull market saw an ROC high of just over 300%. The 1980s-1990s SECULAR bull market reached above 350%. The current 2010s-2020s SECULAR bull market nearly touched 300%, but remains slightly beneath the prior two SECULAR bull markets in terms of a 10-year ROC. So for those that have screamed this bull market has run too much, I'd direct you to this chart, which clearly reflects this has been a more subdued secular bull market (at least during the first 10 years) than the previous two.
You need to remember one thing about historical SECULAR bull markets. They tend to last 20 years, not 10. And the bottom panel shows us the 20-year ROC. In the 50s and 60s, we topped close to 750%. In the 80s and 90s, that top was closer to 1400%. The current SECULAR bull market has another 10 years to run. Where might this 20-year ROC reach? That's the exciting part and one reason why I believe we'll see the S&P 500 perhaps 3x the level we're at right now. Yes, that's right. I'm calling for an S&P 500 that likely reaches 12000-15000 by the end of this decade or into the early part of the 2030s. We are in one of those secular bull market periods that you CANNOT rebound from if you don't take advantage of it when it occurs. I fully suspect history will repeat itself and that much of the 2030s and 2040s will be VERY difficult for U.S. equities - much like the 2000s, 1970s, and 1930s/1940s were.
One other piece of this chart to note is the monthly PPO. I've highlighted the secular bull market years in blue shading. Any time we see a correction or a cyclical bear market, we see the monthly PPO dip down close to or perhaps touch the zero line. When we begin to turn higher off of that centerline test, we historically have seen very significant stock market advances that have lasted YEARS, not weeks or months. IGNORE the media and all their BS headlines and stick to the technical signals on the charts.
Currently, it's ALL ABOARD the Northbound Train (with pitstops along the way, of course).
Major Indices
This week, let's look at the 10-year weekly chart on the S&P 500:
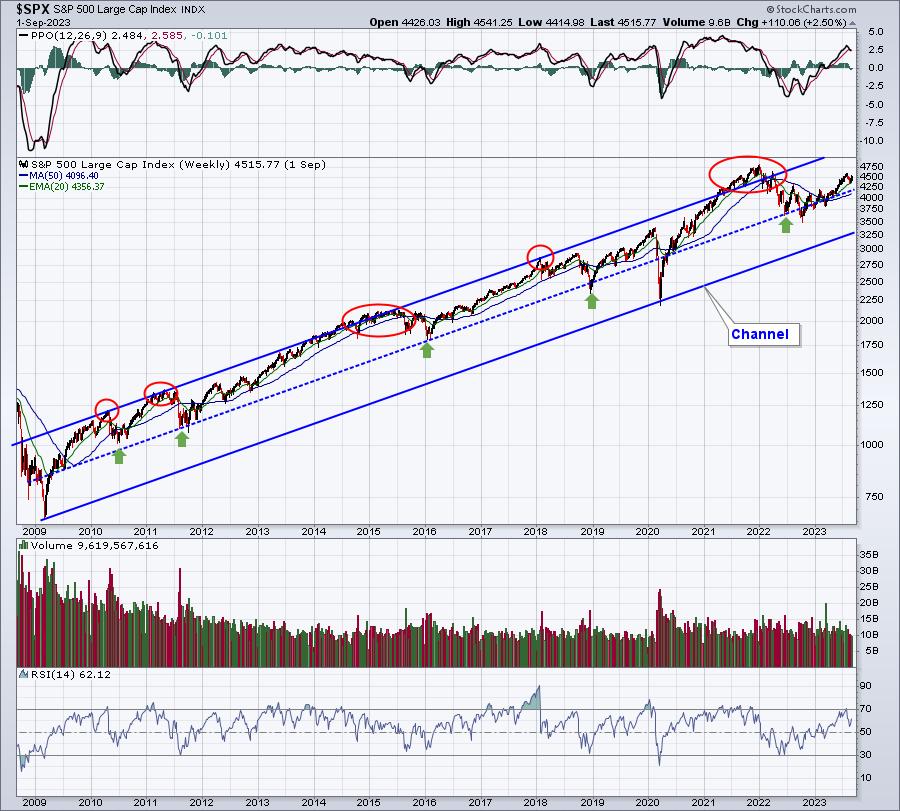
We are in a beautiful channel that began off the financial crisis low of 2009. That low, along with the 2020 pandemic low, were "fire sale" lows, triggered by extreme pessimism. They serve as very important lows in our current uptrend. I believe the ONLY way this line is tested is if we hit another period of EXTREME pessimism and panic. I really don't see anything on the horizon that would trigger such a selloff. A possible event might be a surge in inflation, with the Fed hitting the accelerator on rate hikes, maybe announcing 50-basis-point or 75-basis-point rate hikes, taking the fed funds rate well over 5-6%. While anything is possible, I certainly wouldn't invest my money based on this long shot. Inflation has been trending lower for months and there is absolutely no sign of this possibility on the charts. Wall Street has not and is not turning defensive right now. Therefore, I say stick with the long side as the weekly chart corroborates that Big Picture 100-year monthly chart.
When we become stretched in this current channel (red circles), testing the upper channel line, that's the time to be thinking caution again. Each of those prior red circles has triggered an ensuing period of consolidation/selling to take price back down to or near the middle, blue-dotted trendline. We have plenty of upside available before we'll need to worry about that.
Sentiment
Equity-only put-call ratio ($CPCE):
I use two primary CPCE signals, one short-term (speed boat) and the other long-term (ocean-liner). The stock market repeatedly moves higher and lower in both uptrending and downtrending markets. But once you've established the primary trend, which, in my opinion, is clearly higher, you can apply the 5-day equity only put call ratio ($CPCE) to help spot key short-term market tops and bottoms. Recently, the pendulum swung to extreme pessimism, which helped me call a bottom. Check it out:
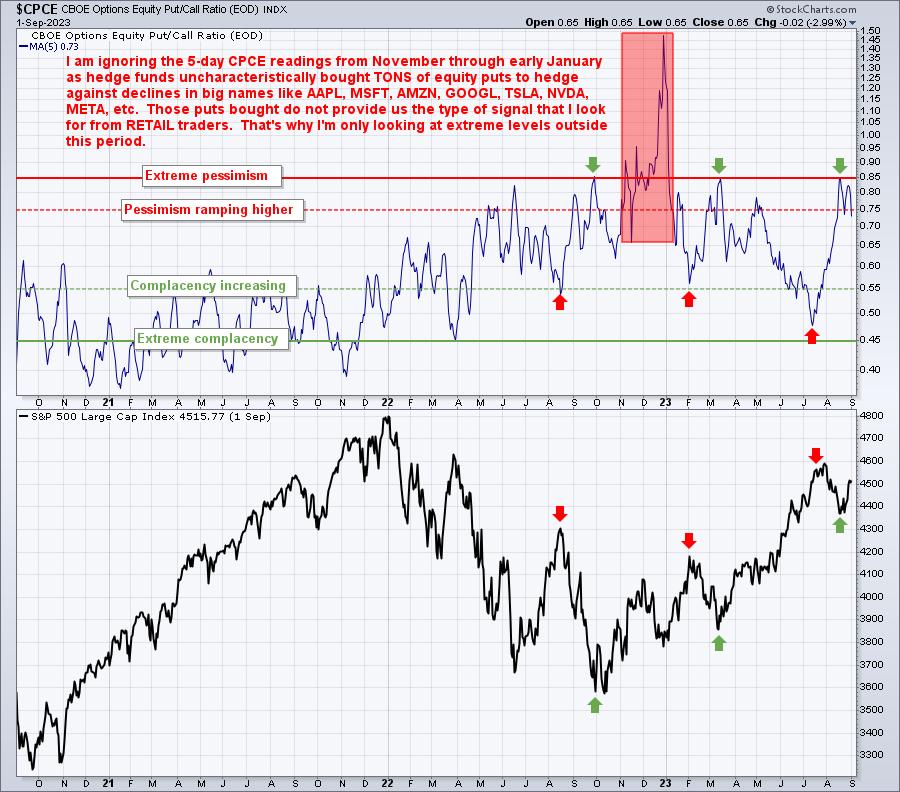
Listen, I don't fight the signals. This is one of my PRIMARY charts to help me spot short-term market reversals. When I get warning signs of a short-term top and the increasing probability of a short-term period of selling/consolidation, the 5-day SMA of the CPCE is a key in helping to spot when the bleeding stops. It did so perfectly on August 18th, when I wrote my article at StockCharts, "Are You Ready For A Huge Rally?" I use proven methods, strategies, and charts to help me manage my downside risk and to spot key market reversals. This article was simply one example of that. Currently, this 5-day CPCE is neutral, returning from its recent extreme pessimism reading.
Now for the long-term, ocean-liner signal:
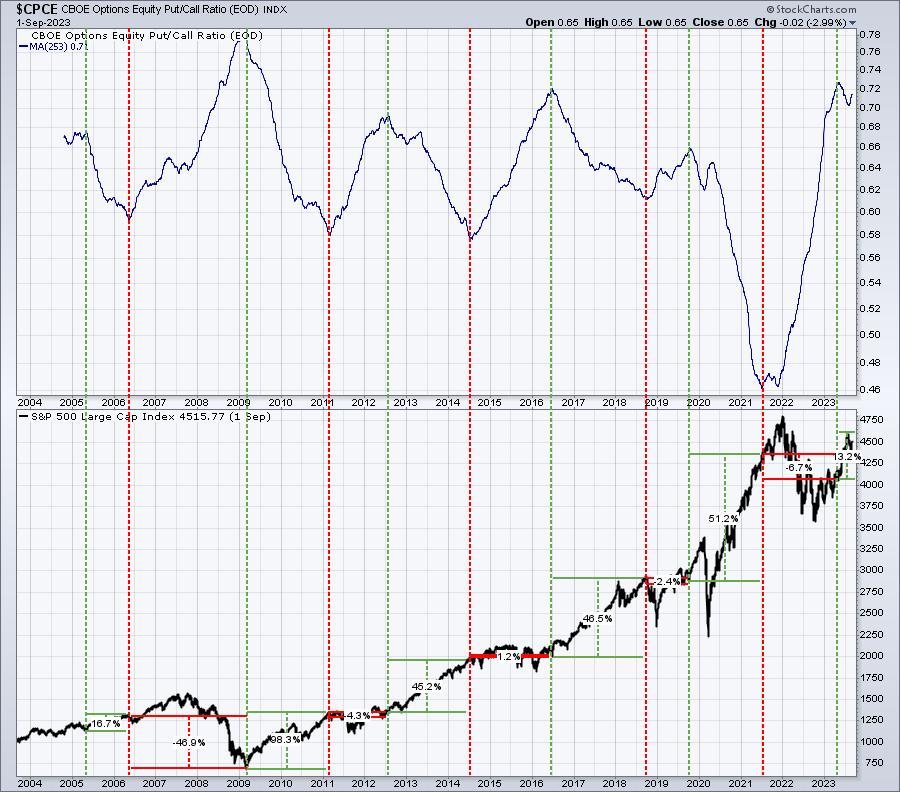
Think of this as the Big Picture of sentiment. History tells us that when the trend in sentiment changes, so too does the stock market direction. EVERY SINGLE TIME. When the stock market struggles for a long period of time, like it did during the 2022 CYCLICAL bear market, traders grow more and more pessimistic. The period starts off with retail traders not believing that we're going lower, so they continue to trade more on the long side, buying calls. It's not until after they lose a boatload of money that they begin to swing to the pessimistic side. By the time they do, most of the market damage has already been inflicted. At some point, the extreme pessimism marks a significant market bottom, but by then, retail traders have grown excessively bearish and can't fathom a move higher again until....you guessed it.....the market has already rebounded substantially.
Look at the chart above. Once the 253-day (1 year) moving average of the equity only put call ratio has risen to an extremely high reading, the sellers are DONE and the stock market rallies. And when retail traders grow too bullish after market advances, stocks tend to perform poorly, or at least flat. Again, I don't make this stuff up. Look at the chart and see it for yourself. The key on this ocean-liner chart is THE TURN - either the turn lower after a significant rise or the turn higher after a significant decline (or long-lasting consolidation period). In my opinion, this ocean-liner signal has reached a peak and is turning lower. I believe that will ultimately result in U.S. equity prices rising significantly over the foreseeable future.
Volatility Index ($VIX):
The VIX is interesting, because it has a very strong inverse relationship vs. the S&P 500. When stocks gain ground, the VIX drops. When stocks lose ground, the VIX rises. Here's a long-term chart to illustrate:
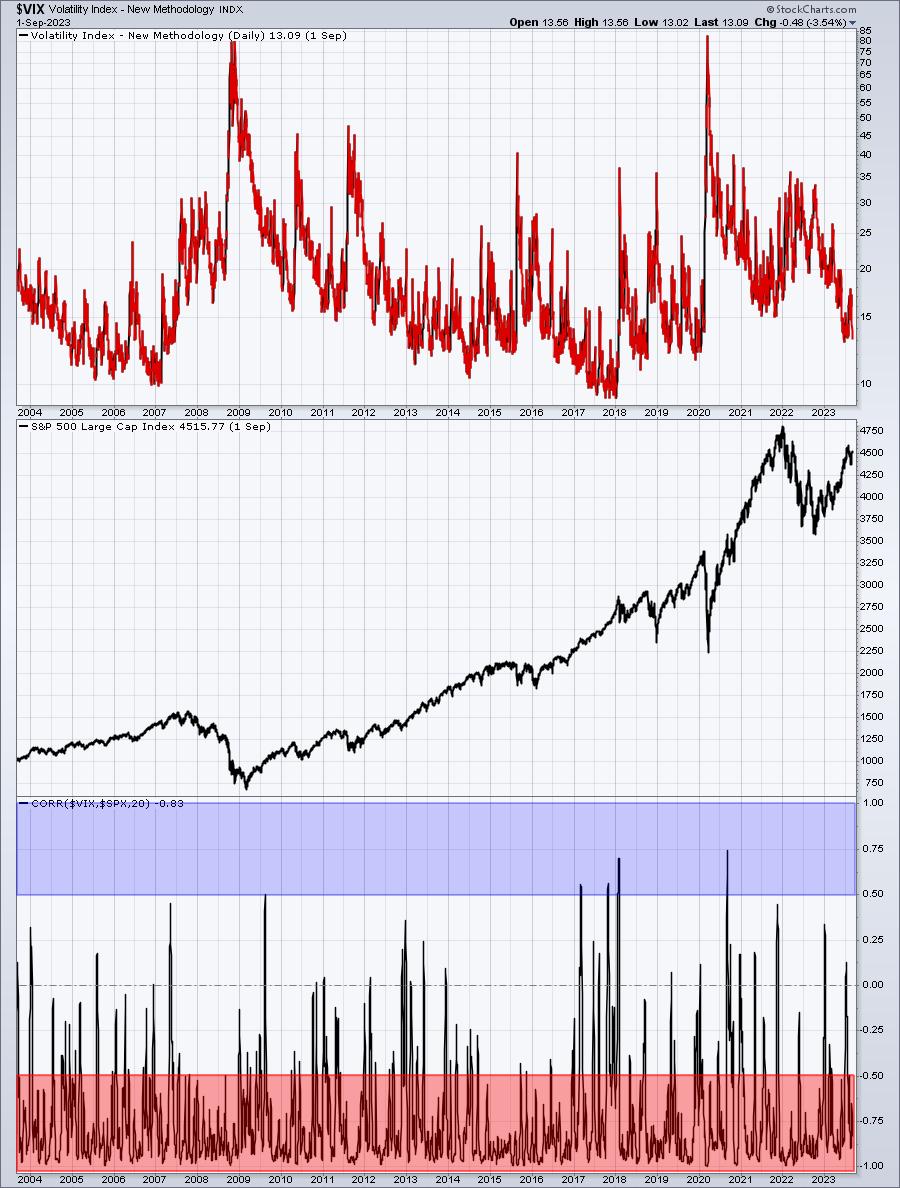
I think the inverse relationship is quite clear, especially when you see how many times we're in the -0.50 to -1.00 range vs. the +0.50 to +1.00 range. But we do see daily readings positive occasionally and when that positive correlation does appear, the signals are quite interesting. Here's what I mean:
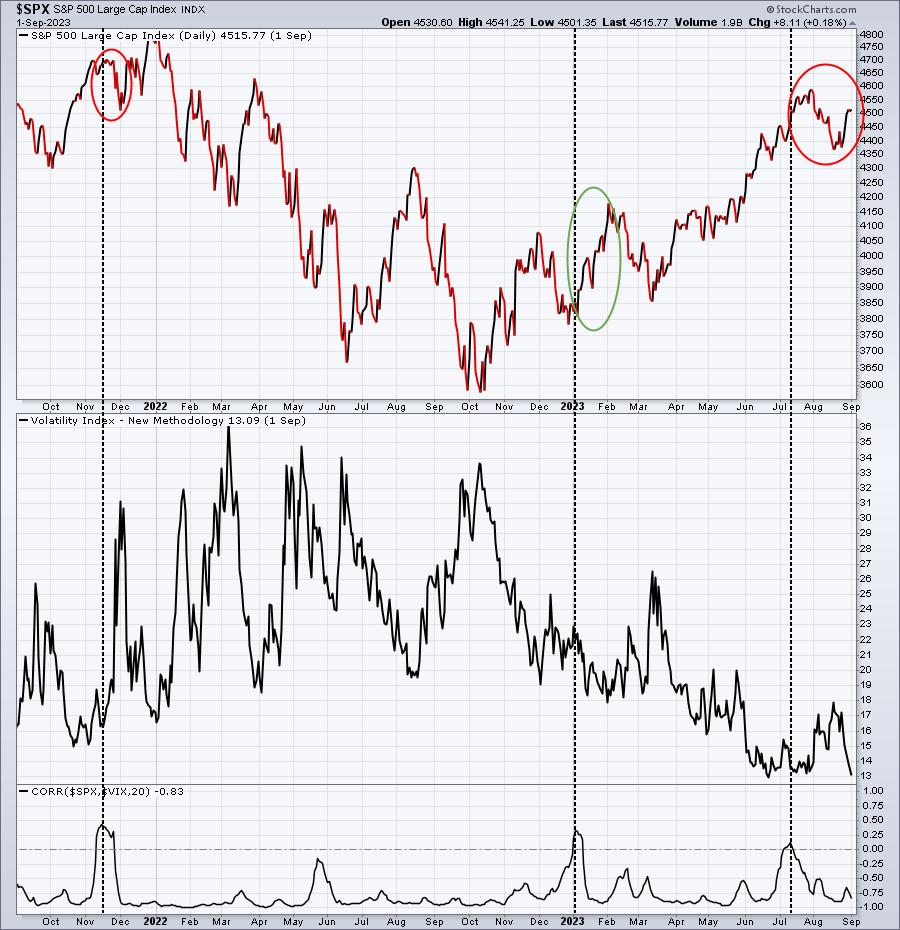
Over the past two years, we've only received 3 signals (correlation moving into positive territory), but they've been excellent signals and I've written about them. The first one in November 2021 appeared after a significant short-term advance. Note how we saw a key reversal into the second half of November. The second signal appeared in the first week of January 2023. I wrote about it and spoke about it:

I'm posting these to provide examples of how we use our signals to PREDICT the market's next move, rather than simply tell you how it already moved. Market Guidance is about the future and no one calls it better than EarningsBeats.com. I believe we've proven that over a very tumultuous period that included a pandemic-related cyclical bear market, one of the strongest 2-year bull market advances in our history, a cyclical bear market prompted by rising inflation and a hawkish Fed, and yet another very strong bull market rally in 2023. Intermediate-term calls, both bullish and bearish, have helped guide traders and many times it's these sentiment signals that do the majority of the work.
Intermarket Relationships
Many times I refer to these intermarket relationships as sustainability ratios. They provide us clues as to the likelihood that a current market trend will continue. If the S&P 500 is rising, I feel much more confident about it continuing if our sustainability ratios are rising as well. I believe some of these ratios are more important than others, so I'll provide the two that are most important to me:
Consumer discretionary vs. Consumer staples (XLY:XLP):
Our GDP is comprised of two-thirds consumer spending. If we truly want to see into the future, we need to be aware of how the consumer is doing, specifically by evaluating the relationship of discretionary stocks (these companies provide us the things we WANT) vs. staples stocks (these companies provide us the things we NEED). The S&P 500 thrives in a "risk-on" market environment that includes consumers spending money on the things they WANT. The XLY:XLP ratio provides us the current market "temperature" on how the big Wall Street firms view this relationship. As long as we keep seeing higher highs and higher lows on this XLY:XLP ratio, I'm going to be bullish. You must keep in mind that, during consolidation/selling periods, money will rotate from the XLY to the XLP. That's normal market behavior. So I don't grow bearish every time this ratio declines. It's more of a Big Picture review of the ratio vs. the S&P 500. Check this out:
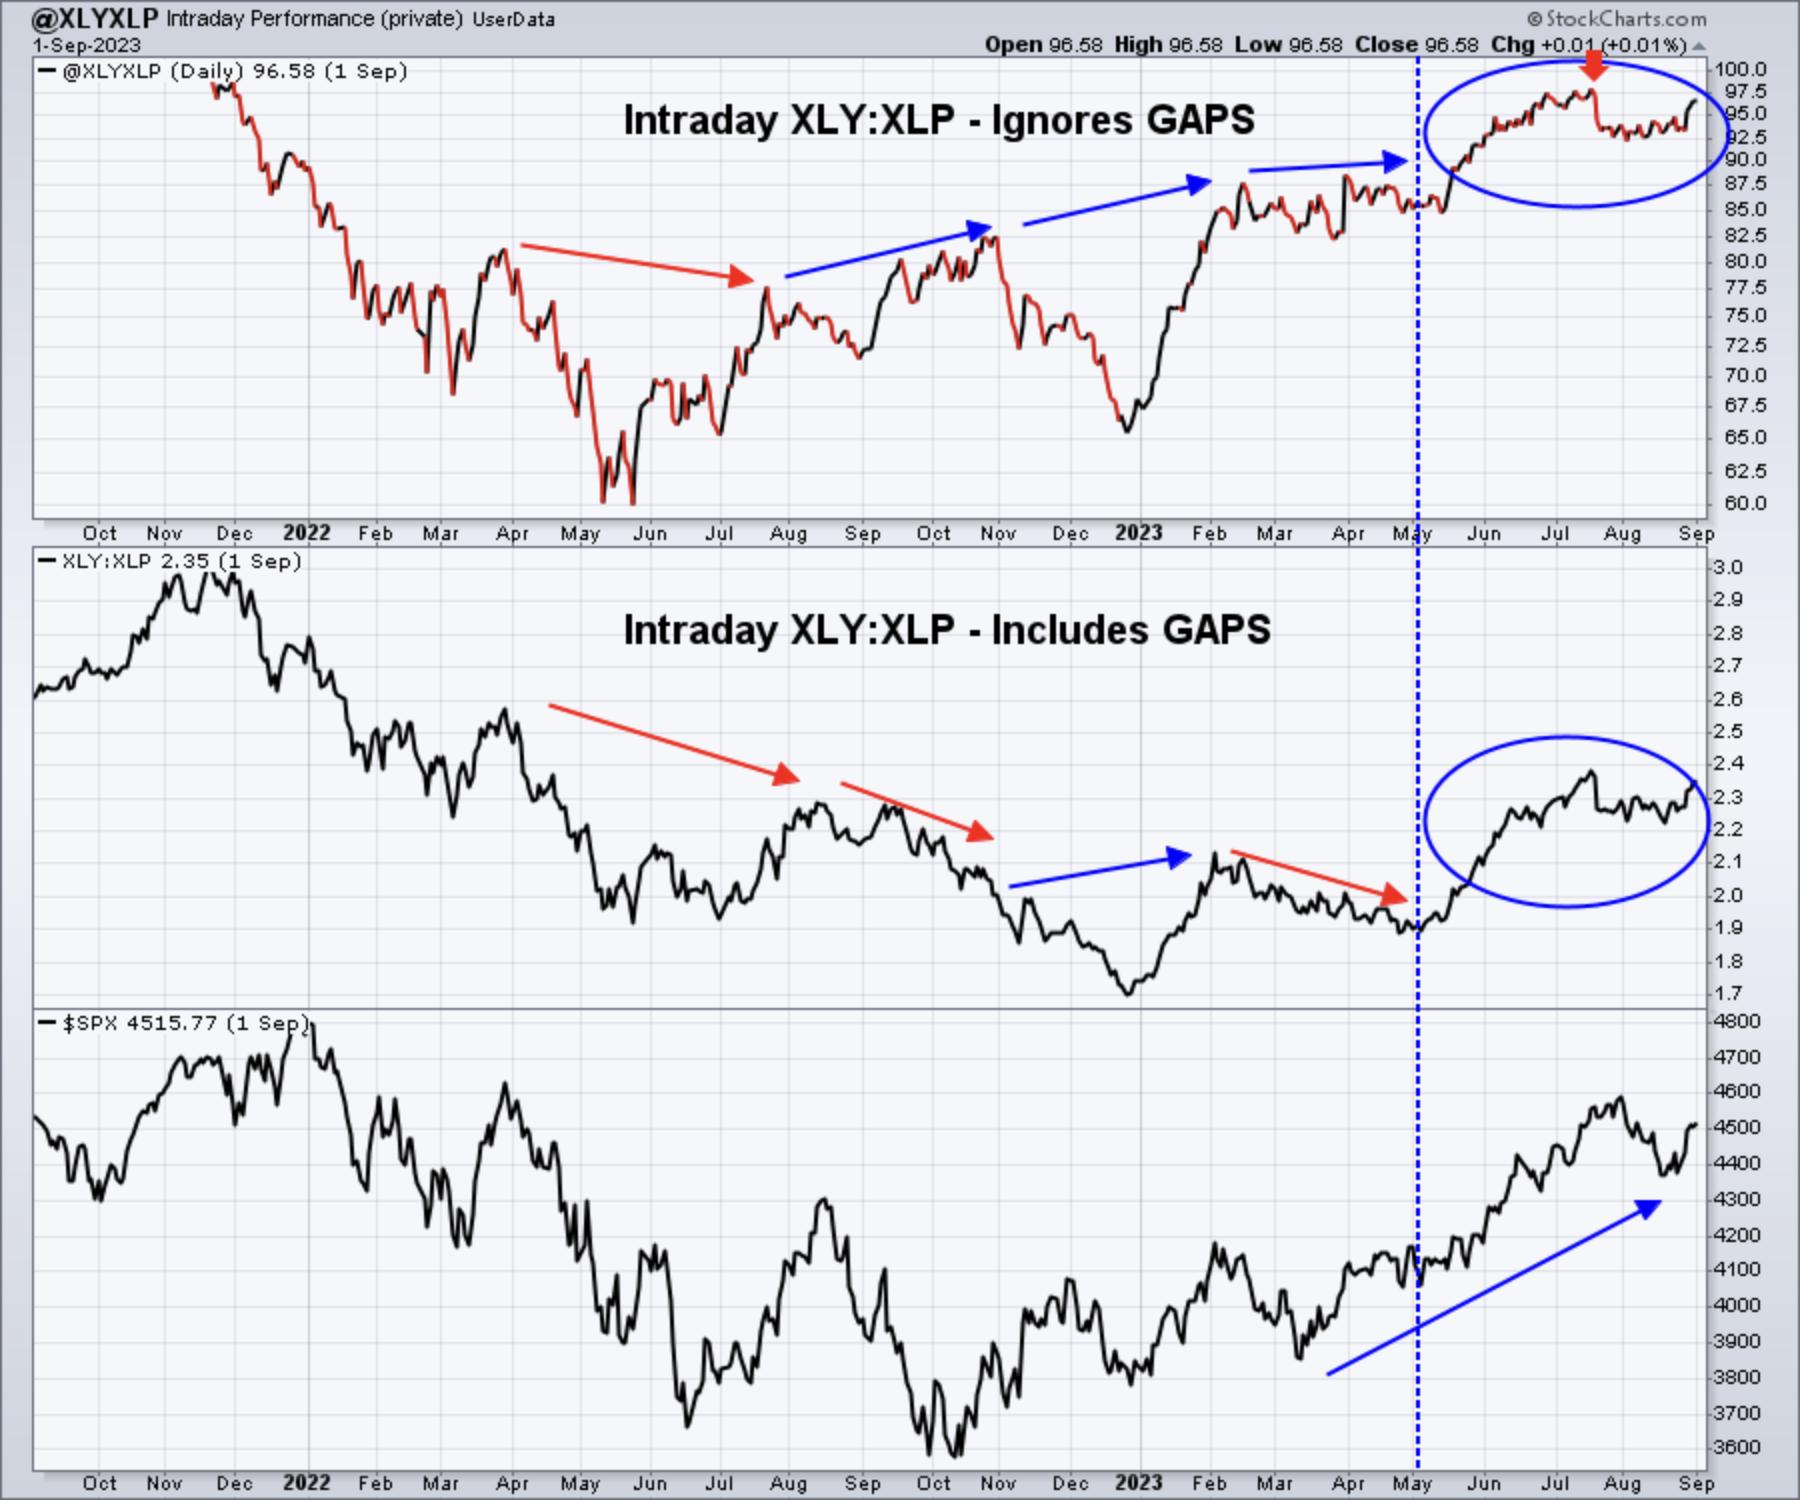
The above XLY:XLP chart includes a proprietary User-Defined Index that tracks this ratio on an INTRADAY basis that excludes opening gaps. I do this to see how this relationship is performing during the trading day to rid myself of all the market maker noise that surrounds opening gaps. You can see from the above chart that the XLY:XLP intraday ratio was performing much better in Q4 2022 and Q1 2023, providing us a much more bullish signal, while the market-maker-manipulated gaps showed us a more bearish picture (steady declines, falling red directional lines). The blue directional lines in the top panel of the chart SCREAMED at us that money was rotating very aggressively during the trading day. In other words, the big Wall Street crowd was buying and that's always a bullish signal.
NASDAQ 100 vs. S&P 500 (QQQ:SPY)
History tells us that the NASDAQ 100 outperforms the S&P 500 during secular bull market advances. The reason is simple. Growth stocks outperform value stocks when our economy is strong, strengthening, or expected to strengthen. The NASDAQ has more representation of growth stocks, so we should view a rising QQQ:SPY quite bullishly. Here's how this chart looks now, also providing the INTRADAY QQQ:SPY relationship to exclude those manipulative gaps:
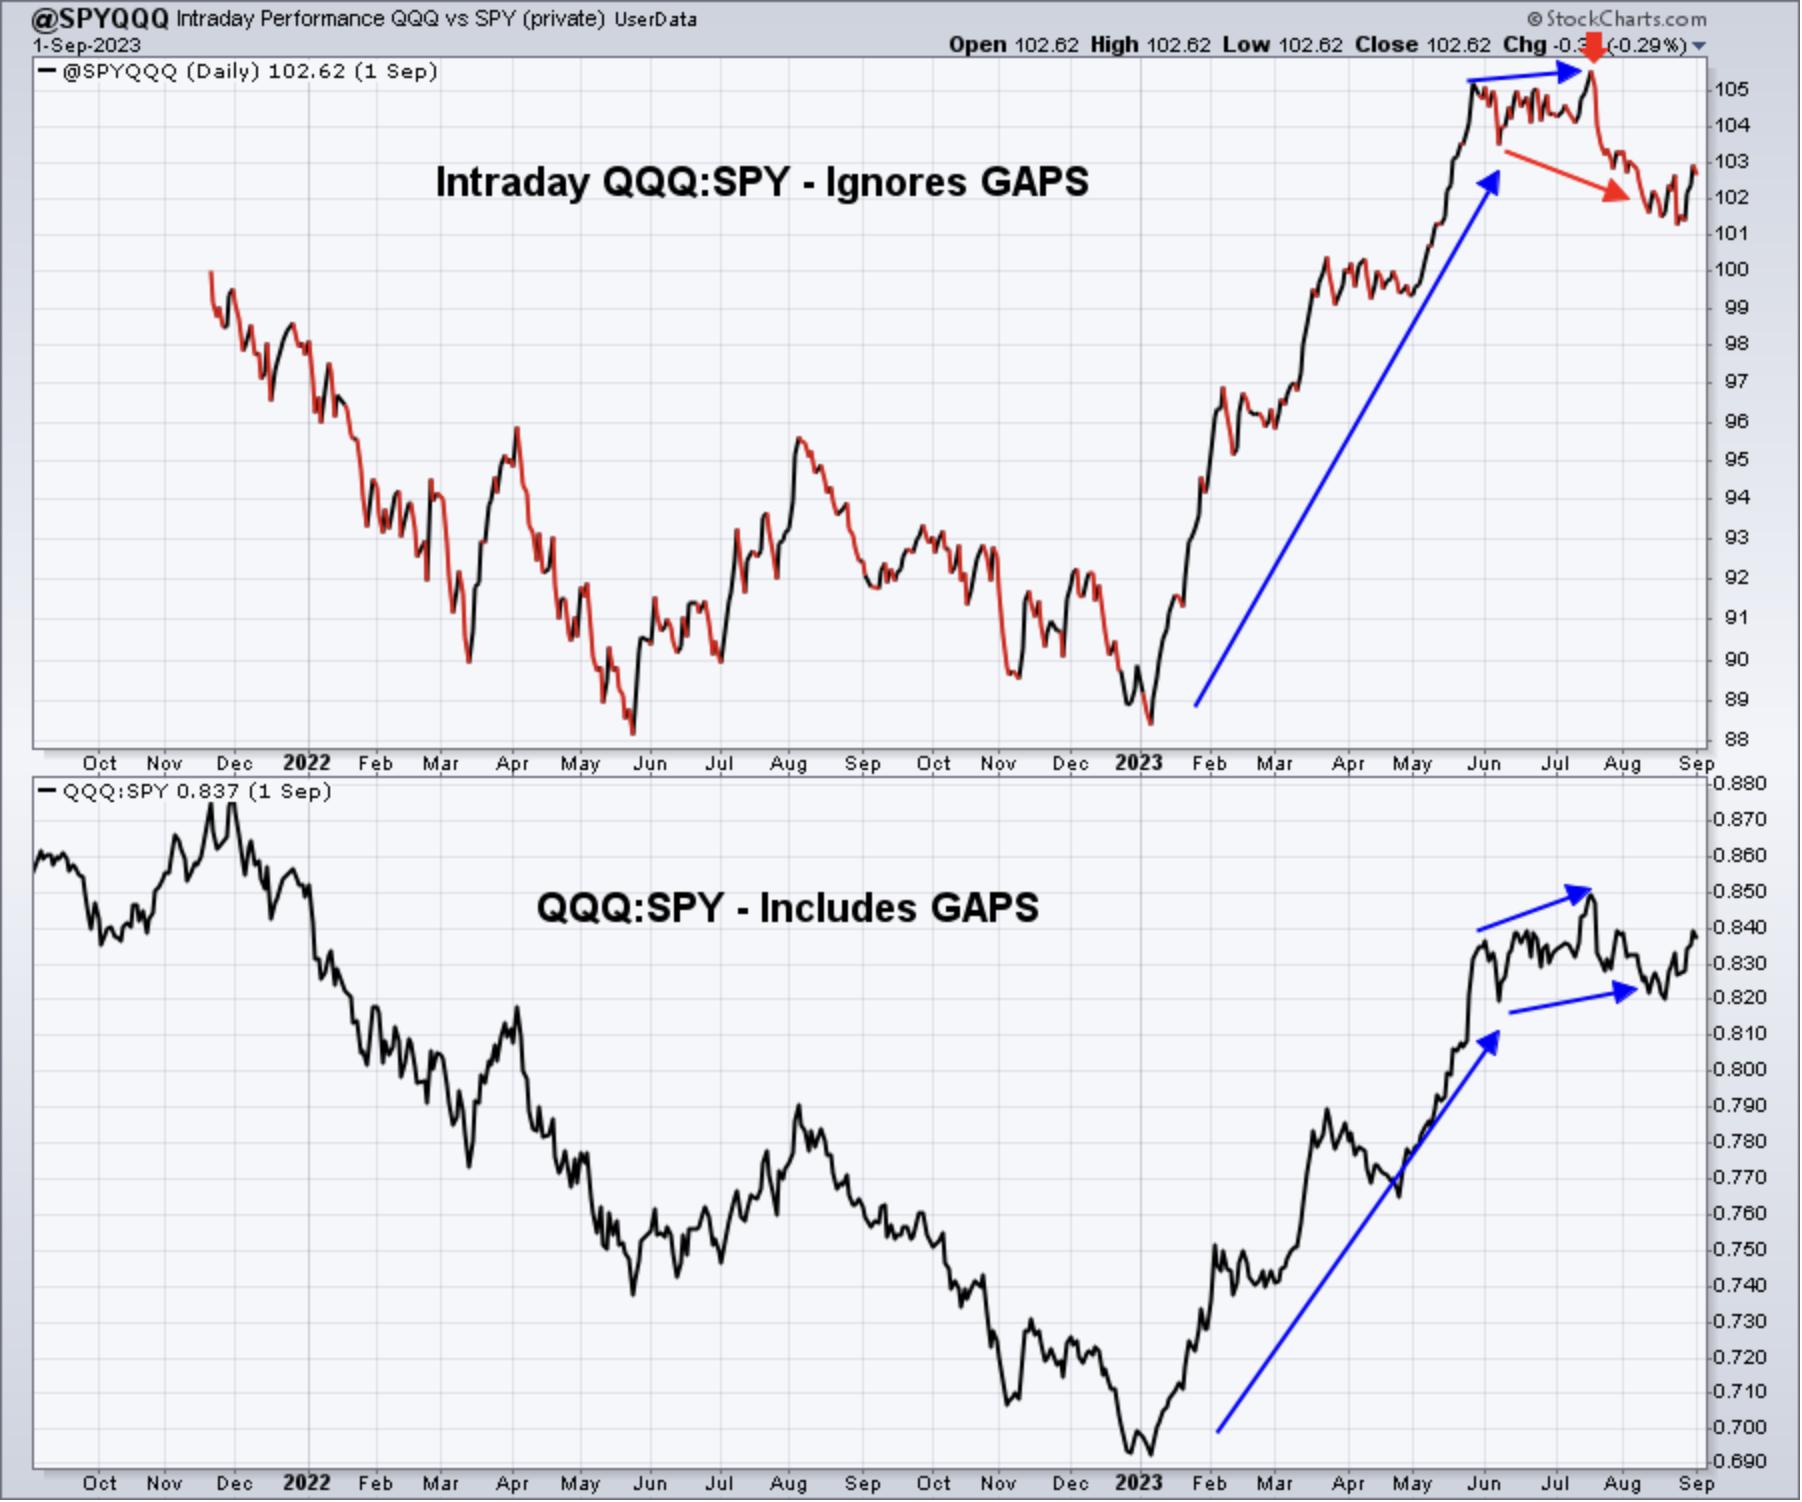
Before I analyze this chart, let me address one question that ALWAYS seems to surface. The NAME of this User-Defined Index chart is "@SPYQQQ". That does not dictate the order in which this ratio is calculated. I can PROMISE you that it's based on the intraday QQQ:SPY ratio. I just want to be clear about that, because many have suggested I did the calculation backwards. Remember, it's just a name. In hindsight, I wish I had picked the name "@QQQSPY", but I didn't.
The red directional line in the top panel suggests that Wall Street has begun to rotate away from growth and that should not be ignored. Historically, we begin to see much better action in value-oriented stocks vs. growth-oriented, so it's important to note this subtle signal. The QQQ:SPY ratio seems to be holding up in that 2nd panel, but it's primarily because of the opening gaps. The QQQ has been gapping higher, but it's been followed by intraday selling and rotation towards the SPY. That isn't necessarily bearish. It's simply a signal that we could see leadership rotate to areas like industrials, financials, health care, and energy. And that's how the market generally trades in the final months of the year.
Trade Setups
As I mentioned above, we're beginning to see the historical leaves change as September arrives. I am focused on uncovering value-oriented industrials and financials to lead us into year end as the torch is passed from technology. That's why the stocks below are not AAPL, MSFT, NVDA, META, AMZN, GOOGL, etc. I expect those stocks to pause in Q4 as they normally do. In the meantime, here are 2 that I believe could be solid trades into year end:
JP MorganChase (JPM):
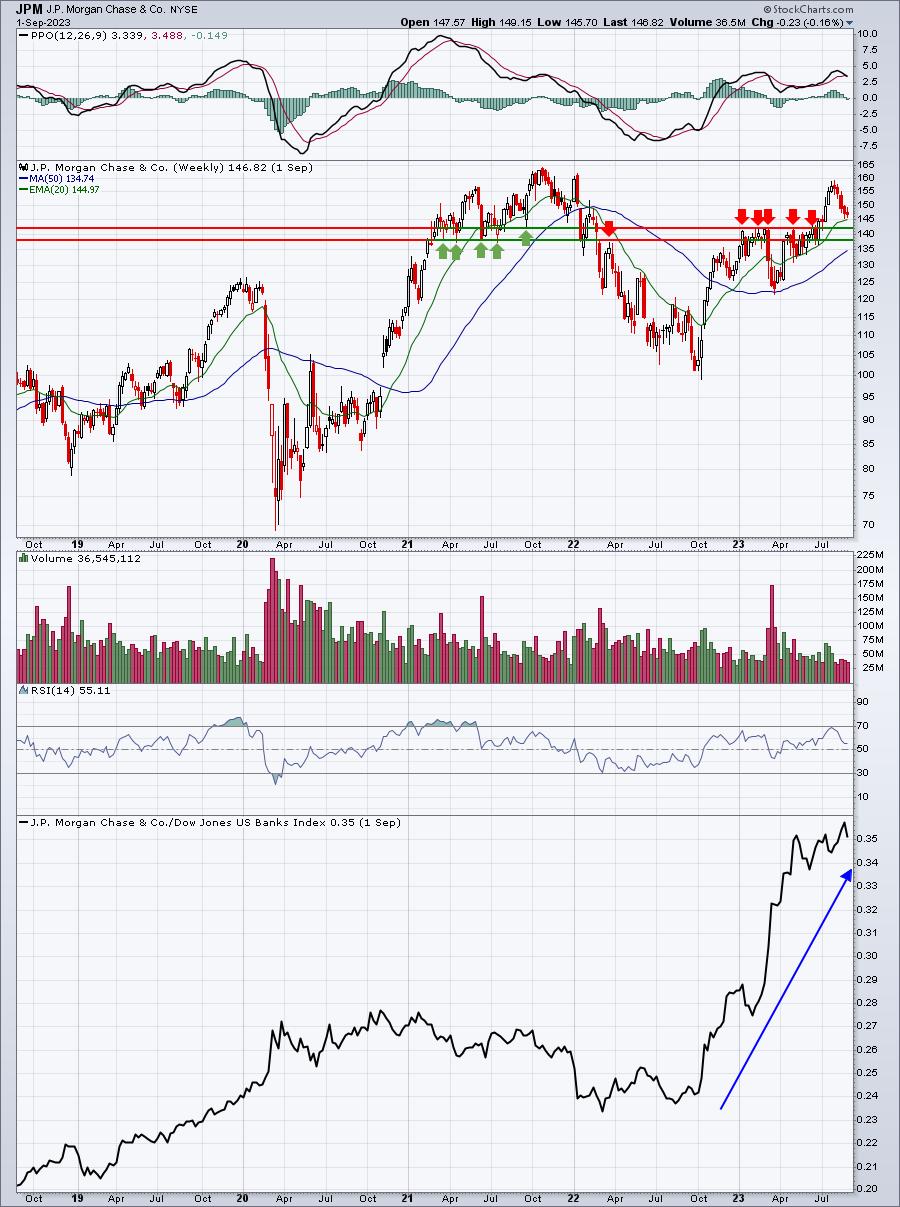
I could see JPM dipping into the low 140s, possibly into the upper 130s, but I really like the recent selling (5 weeks running) that's left JPM at its rising 20-week EMA just prior to a very bullish seasonal pattern. Over the past 11 years, JPM has average returns as follows by quarter:
- Jan-Mar: -1.9%
- Apr-Jun: +4.1%
- Jul-Sep: +2.7%
- Oct-Dec: +12.9%
JPM loves Q4. If history repeats itself, don't be surprised to see JPM hitting all-time highs by the end of the year.
Boeing (BA):
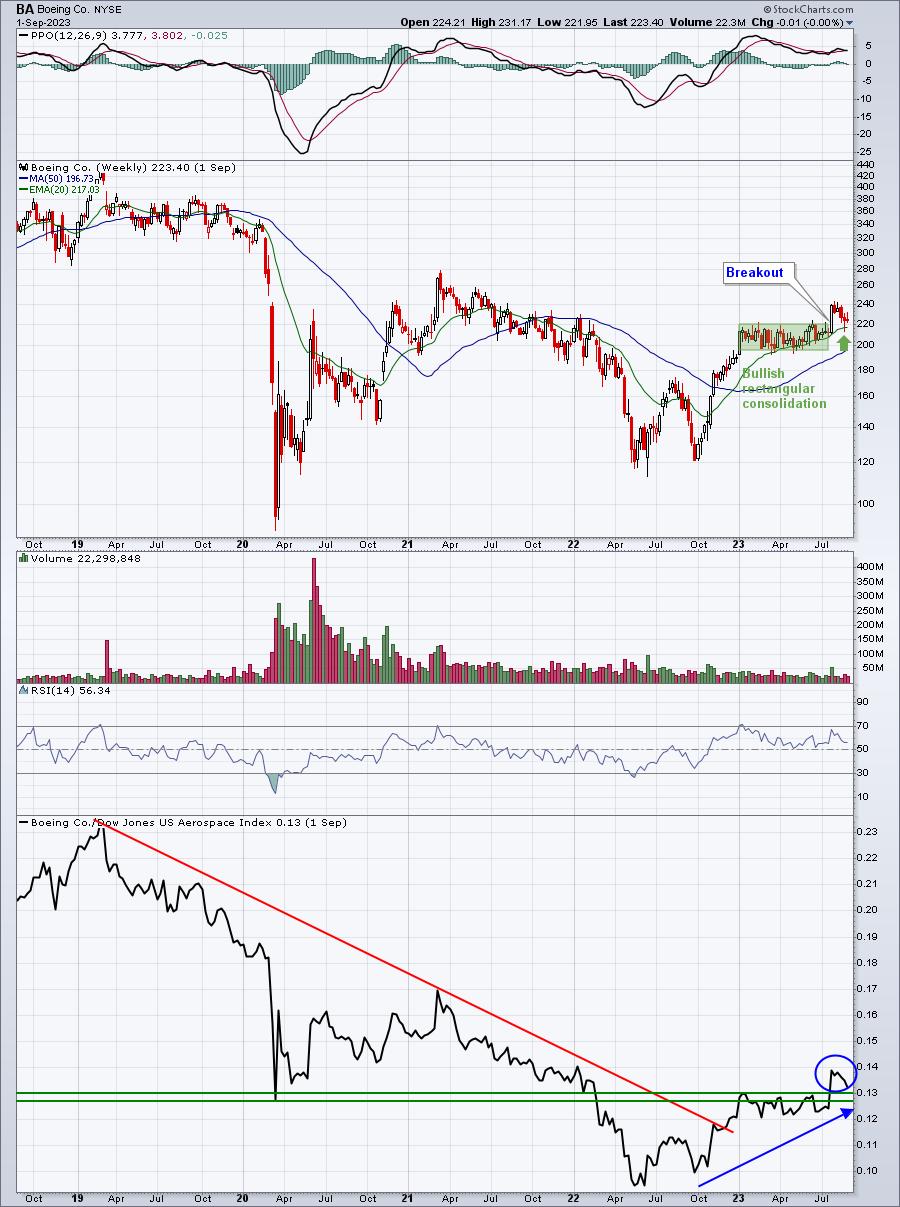
Not many stocks were rocked as hard as BA during the pandemic and in the years following. It now seems to be on a much better trajectory, however. I like the fact that BA spent much of 2023 in a tight range between 195 and 220, not really participating in the market's advance. On extremely heavy volume in July, accompanying its quarterly results, BA broke out of this range and is now trading almost squarely on that prior resistance near 220. Like JPM, it has a historically-strong period that's about to begin. Here's how BA's average quarterly returns unfold:
- Jan-Mar: +2.4%
- Apr-Jun: +1.6%
- Jul-Sep: +6.5%
- Oct-Dec: +11.4%
I'd say BA is in its sweet spot historically and the technical conditions support an advance from here as well.
JPM and BA are both in that value camp and represent financials and industrials, respectively. I believe both will outperform the S&P 500 from now through year end.
Looking Ahead
Upcoming Earnings
There isn't likely to be a lot of market movement based upon key earnings reports. Most large companies that could influence the benchmark S&P 500 and/or the NASDAQ 100 have long since reported results. Here are a few interesting companies reporting this week, however, by day and market cap:
Tuesday: ZS ($22 billion)
Wednesday: None
Thursday: DOCU ($10 billion)
Friday: KR ($33 billion)
Key Economic Reports
The beige book is likely to grab attention and headlines on Wednesday afternoon at 2pm ET, but otherwise it'll be a fairly slow week for economic reports. Key economic news will be out next week, including both the monthly CPI and PPI reports. Those will come one week before the Fed decides whether or not to raise interest rates.
This week's reports:
Tuesday: Factory orders
Wednesday: PMI composite, ISM services, beige book
Thursday: Initial jobless claims, productivity and costs
Friday: Wholesale inventories
Historical Data
Each week, I'll provide you the average annualized returns for each calendar day and by index. Here's the balance of this week:
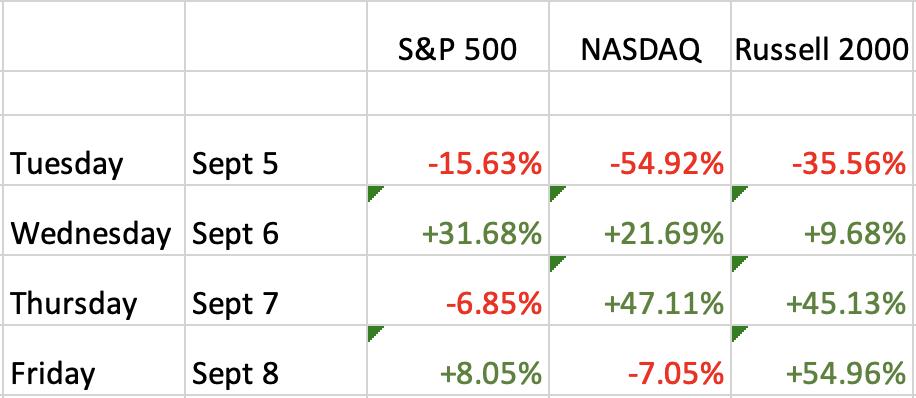
The S&P 500 data dates back to 1950, while the NASDAQ and Russell 2000 information date back to 1971 and 1987, respectively.
Historically, I'd say next week favors small caps, but let me say that seasonal information ALWAYS takes a back seat to technical analysis and current market conditions.
Final Thoughts
Whew! This is obviously a very lengthy report. There are many charts that I won't address on a weekly basis as they simply don't change that often. I'll likely discuss the Big Picture 100-year chart at the beginning of every month. Otherwise, there'll be plenty of week-to-week redundancy. The "ocean-liner" CPCE is another chart that can be reviewed monthly. And I may add a section here or there in various weekly market reports. But what you see above is the majority of what you can expect in the future on Sundays/Mondays. Remember, this in-depth analysis will REPLACE the Monday Daily Market Report. Those DMRs will be published Tuesdays through Fridays.
As I look at the stock market right now, I have several thoughts:
- We're in a SECULAR bull market, so you won't hear or see me talking bearishly about the stock market long-term unless conditions change immensely
- It's September! The second half of September is the truly bearish part of the month. Until then, we typically see average annualized market returns comparable to the S&P 500 throughout the entire year
- While not addressed in this long-term weekly report, there are 60-minute negative divergences that could impact this week's trading - to the downside. From a long-term perspective, however, this VERY short-term momentum warning is much like a gnat on an elephant's butt. It really doesn't matter.
- One very important key that I'll be watching throughout September is the possible rotation into more value-oriented stocks. Just like in 2022, don't view this as bearish rotation. The growth stocks deserve a pause and areas like semiconductors will produce long-term negative divergences on the weekly chart if we see further strength.
- Earnings and economic news will be very light, so we'll likely see market action follow the technicals, with little in the way of fundamental news to digest.
- Please always try to keep perspective in mind when you evaluate the U.S. stock market. Honestly, I believe most every analyst needs a big dose of perspective from time to time. And retail traders? Puh-lease, most cannot look past what's happened in the past week or month, let alone stepping back and viewing the Big Picture chart from space. There are so many emotional traders, responding to the latest CNBC headline. Don't be in that group or market makers will get the best of you.
Feedback
I hope you enjoyed this very first edition of our EB Weekly Market Report! We'd absolutely love your feedback, whether positive or negative. Let us know what you think by sending us your comments to "support@earningsbeats.com".
30-Day FREE Trial
Let me reiterate that we have a 30-day FREE trial to our ENTIRE service that now includes this EB Weekly Market Report. I believe I can help you steer clear of big trouble in the stock market - like I did for EB.com members at the beginning of the 2022 cyclical bear market - while enjoying the benefits of these scintillating secular bull market advances. Simply CLICK HERE to get your trial subscription started!
Thanks and happy trading!
Tom


