
Wyckoff Power ChartingApril 23, 2018 at 06:00 AM

Let’s review the concept of the ‘Creek’. This is a nuanced Wyckoff principle, but once understood, it becomes a very powerful trading edge. Support and Resistance zones are typically understood to exert their influence at linear price levels...Read More
Wyckoff Power ChartingApril 15, 2018 at 03:00 PM

Fellow Wyckoffian, Dan, emailed a very good question this week. Dan is seeing the energy stocks move up and he observes that being a cyclical industry, these stocks typically move in unison...Read More
Wyckoff Power ChartingApril 08, 2018 at 01:20 PM
Wyckoff Method tools can be used in multiple time frames. We can often gain clarity by evaluating larger or smaller chunks of time. We recently studied the daily bars of the S&P 500 as it approached important Support. So far, this Support has been respected...Read More
Wyckoff Power ChartingMarch 31, 2018 at 11:25 PM

The winds are shifting in the financial markets. Often Point and Figure charts offer a perspective that other chart types might obscure. Point and Figure chart construction is minimalistic. It keeps the important price swings and discards the rest...Read More
Wyckoff Power ChartingMarch 26, 2018 at 02:56 PM

I make lots of notes on my charts. As conditions unfold I have a sense for what my thinking was and whether adjustments need to be made in tactics...Read More
Wyckoff Power ChartingMarch 24, 2018 at 08:00 AM
The Federal Reserve Bank (Fed) has indicated their intention to raise interest rates during 2018 and 2019. In fact, US Treasury interest rates have been rising for quite some time...Read More
Wyckoff Power ChartingMarch 12, 2018 at 07:00 AM

In stock chart analysis the closest thing to X-Ray vision is Relative Strength. Often Relative Strength provides us with early price direction clues. Generally, when Relative Strength (RS) is in a rising trend and price is in a rising trend, this trend will persist...Read More
Wyckoff Power ChartingMarch 04, 2018 at 03:00 AM

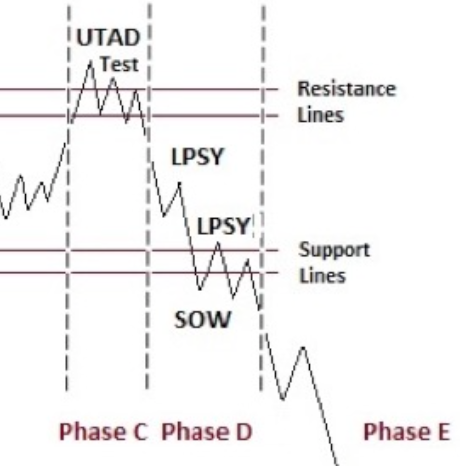
In last Thursday’s MarketWatchers LIVE (recording available here) we discussed the Wyckoff Distribution concept of the Upthrust After Distribution (UTAD). Distribution and Accumulation adhere to a logical path or sequence of price and volume...Read More
Wyckoff Power ChartingFebruary 25, 2018 at 04:07 PM
It has been a long time since we have explored the intricacies of the Wyckoff Distribution structure. But since 2018 has opened with a Bang, by going straight up in January and then early February’s retracement of the prior month’s advance, it is time to review...Read More
Wyckoff Power ChartingFebruary 19, 2018 at 12:53 PM

The Law of Cause and Effect is a cornerstone principle of the Wyckoff Method. Cause building on the chart precedes the Effect of a Markup or a Markdown. Wyckoffians meticulously study trading ranges on the charts for Accumulation or Distribution characteristics...Read More