
Wyckoff Power ChartingMarch 11, 2016 at 04:25 PM

Determining the motives of the Composite Operator is the central mission of all Wyckoffians. There are numerous tools for this task...Read More
Wyckoff Power ChartingMarch 04, 2016 at 03:22 PM

We have worked with Point and Figure charts in multiple time frames using 1 box and 3 box methods. This is akin to constructing daily and weekly bar charts. For many traders intraday analysis and trading is preferred...Read More
Wyckoff Power ChartingFebruary 26, 2016 at 12:00 PM
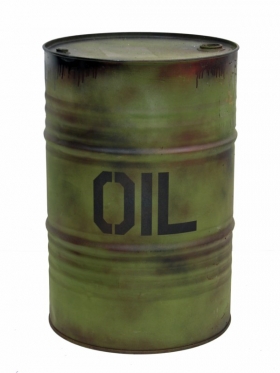
In the blog post of December 17th titled ‘Crude Oil; How Low Can it Go?’ (click here for a link), we studied the bear market in crude oil of 2008-09, the bull market of 2009, and then the current bear market...Read More
Wyckoff Power ChartingFebruary 19, 2016 at 01:31 PM

In trading and speculation we are all on the clock, the market clock. At times the market clock spins quickly and at other times it crawls. When a trend is unleashed time seems to move effortlessly...Read More
Wyckoff Power ChartingFebruary 12, 2016 at 02:58 PM
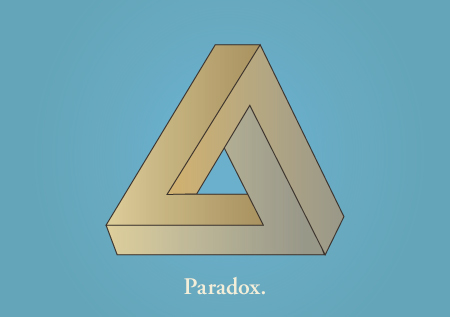
Counting Point and Figure Distributions is a bit of a paradox. Accumulation counts can grow very large and lead to advances that are multiples of their starting point. However, a stock under Distribution is bound by the zero line...Read More
Wyckoff Power ChartingFebruary 05, 2016 at 02:56 PM

Uptrends occasionally need a rest. We call these price congestion areas Reaccumulation trading ranges. Wyckoffians seek these areas out as an opportunity to get onboard the uptrend...Read More
Wyckoff Power ChartingJanuary 29, 2016 at 11:17 AM
How does a Wyckoffian take a very large horizontal PnF count? A large count that forms over many years? Let’s do a case study on an outsized formation and see if it yields useful PnF count objectives...Read More
Wyckoff Power ChartingJanuary 22, 2016 at 12:28 PM

It is a little like magic when Point and Figure counts work out. Long term counts, short term counts, big counts and little counts; PnF is a robust and useful tool. Many Wyckoffians in training do not trust the counts...Read More
Wyckoff Power ChartingJanuary 16, 2016 at 03:08 PM

The procedure for the horizontal PnF counting of Distribution follows the same logic as counting Accumulation. A cause is built during Accumulation and Distribution that results in a trend. Point and Figure chart construction allows us to estimate the extent of a trend...Read More
Wyckoff Power ChartingJanuary 08, 2016 at 02:19 PM

Point and Figure charts are familiar, but different. They have a relationship to classical bar charts while being unique. Their construction and interpretation requires skills that differ from traditional charting...Read More