
Wyckoff Power ChartingJanuary 01, 2016 at 05:49 PM
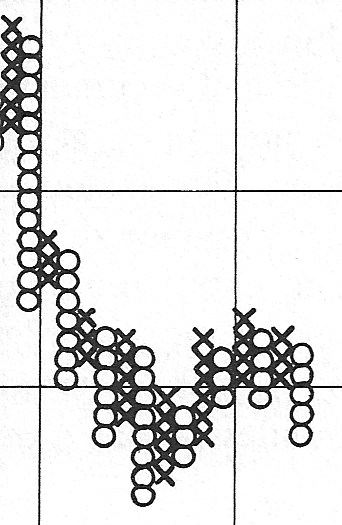
As we enter 2016, it seems like a good opportunity to introduce Point and Figure chart construction. In future posts we will spend more and more time on the techniques of PnF counting using the Wyckoff Method...Read More
Wyckoff Power ChartingDecember 17, 2015 at 11:02 PM
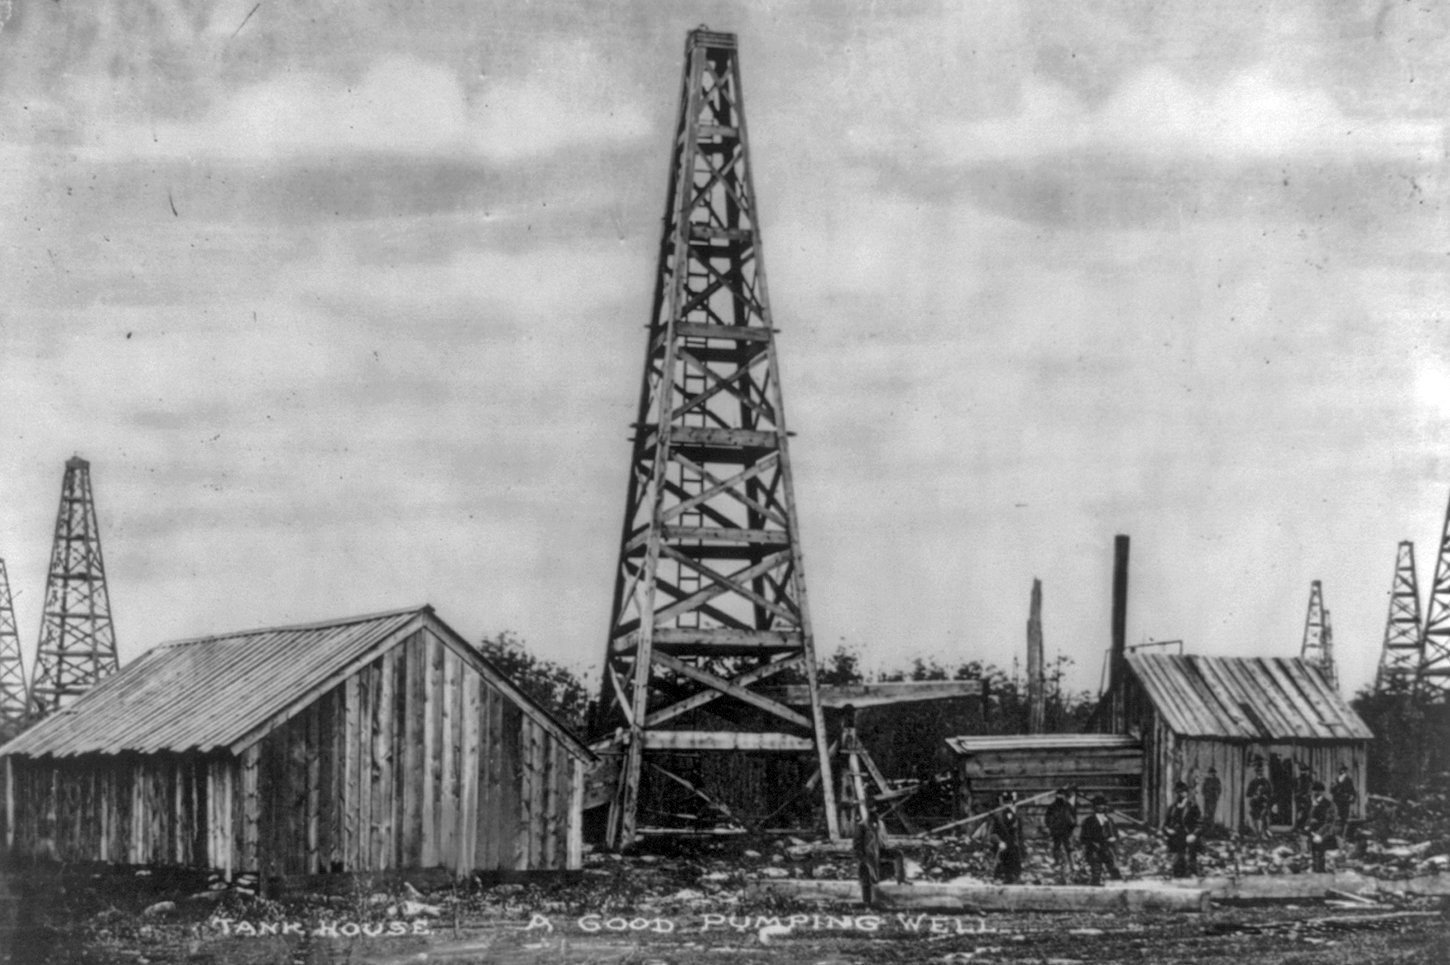
On Monday of this week, the top four stories in the upper left hand column on DrudgeReport.com were about the weakness in oil prices. This may have been a bell ringer of an indicator...Read More
Wyckoff Power ChartingDecember 11, 2015 at 11:06 AM
In a continuation of our discussion of the overarching principles of the Wyckoff Method, let’s do a visual case study...Read More
Wyckoff Power ChartingDecember 04, 2015 at 02:48 PM

Three Principles or Laws govern the structure of the Wyckoff Methodology. Procedurally there are a series of Tests that determine buying and selling decisions. There are nine of these Tests, or thresholds, to be passed for making a buying decision, or a selling decision...Read More
Wyckoff Power ChartingNovember 20, 2015 at 12:19 PM
We have just completed a walk around the classic market cycle. Let us take some time for review before we move on to other aspects of the Wyckoff Method...Read More
Wyckoff Power ChartingNovember 14, 2015 at 12:38 PM

The case study method is a preferred teaching tool in the Wyckoff classroom. Past real life market situations can be explored on an accelerated basis...Read More
Wyckoff Power ChartingNovember 06, 2015 at 02:54 PM

Redistributions are messy. They come in many shapes and sizes and defy categorization. Therefore my job is particularly difficult here. Our mission is to find actionable characteristics in Redistributions that Wyckoffians can benefit from. Here is the problem in a nutshell...Read More
Wyckoff Power ChartingOctober 30, 2015 at 03:50 PM

Bear markets are wild and wooly affairs; quick and painful, slow and tortuous, and every other kind of difficulty imaginable. Bear markets get less attention from market students than the other phases of price action. Amnesia sets in for investors after a bear market...Read More
Wyckoff Power ChartingOctober 22, 2015 at 03:29 PM

When trendlines are drawn, with the Wyckoff Method, it is like putting on 3D glasses. With proper trend analysis two dimensional charts spring to life and reveal their innermost secrets and true intentions...Read More
Wyckoff Power ChartingOctober 13, 2015 at 05:01 PM
Once Distribution is complete, the Markdown Phase begins. Declining prices after the completion of Distribution can cause a ruckus. Sponsorship (of a stock, bond, commodity, ETF, etc.) by large and informed interests is necessary to drive prices higher and higher...Read More