
Wyckoff Power ChartingAugust 01, 2022 at 06:57 PM
In May and June oversold conditions in the major stock indexes developed. Internal breadth and sentiment measures reached notable extremes...Read More
Wyckoff Power ChartingMay 02, 2022 at 12:50 PM
When studying the markets chartists can tend to become myopic and close in on smaller and smaller timeframes (certainly that is the case for this Wyckoffian). Meanwhile, the tsunami of monster trends can engulf portfolios with unexpected reversals...Read More
Wyckoff Power ChartingApril 03, 2022 at 04:17 PM

Trouble for the S&P 500 Index became apparent last September when an outsized decline arrived. Downward volatility with volume expansion (presence of Supply) characterized the decline into October, touching the demand trendline...Read More
Wyckoff Power ChartingMarch 01, 2022 at 06:36 PM
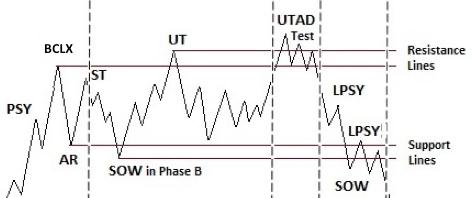
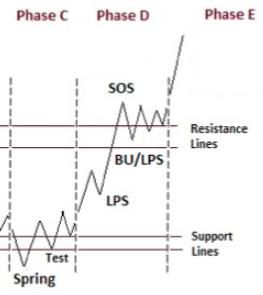
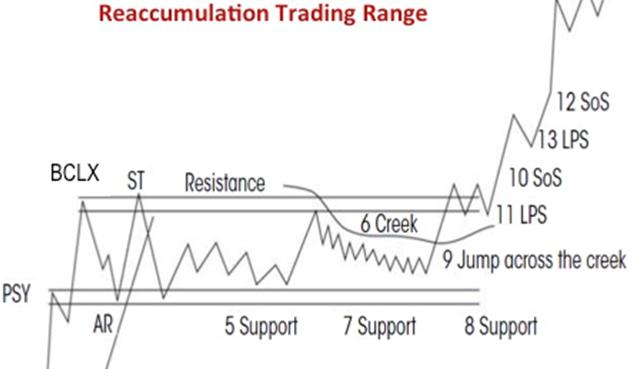
Join Johni Scan and me for Monday's (2/28/2022) "Your Daily Five" where we focus on Distribution and Re-Accumulation characteristics. Both begin in nearly the same manner but conclude very differently. A Re-accumulation is a range-bound condition that forms after an uptrend...Read More
Wyckoff Power ChartingJanuary 16, 2022 at 01:40 PM

Join Johni Scan and me on our quest to develop a library of Wyckoff Scans during 2022. Context is a term often used with chart analysis employing the Wyckoff Method...Read More
Wyckoff Power ChartingNovember 28, 2021 at 06:18 PM

The Point and Figure charting engine at StockCharts.com is an outstanding tool. It provides incredible flexibility to draw many varied types of PnF charts. Navigating the PnF chart controls is easy once they are understood...Read More
Wyckoff Power ChartingSeptember 12, 2021 at 05:21 PM

Apple, Inc. (AAPL) has been one of the most analyzed stocks in the Wyckoff Power Charting pages. It is the largest company by market capitalization and has a huge influence on the major stock indexes...Read More
Wyckoff Power ChartingJuly 24, 2021 at 02:22 PM
On the most recent episode of Power Charting on Stock Charts TV (link below) an analysis of the Dow Jones Industrial Average was considered. A sudden and sharp reaction occurred earlier this week. The index returned to the Oversold Trendline and found good support...Read More
Wyckoff Power ChartingJuly 06, 2021 at 04:04 PM
Join special guest Alessio Rutigliano for a discussion of Crypto Currencies and the Wyckoff Method. Alessio has become a foremost expert on trading Crypto...Read More
Wyckoff Power ChartingMay 05, 2021 at 12:38 PM

Materials prices are screaming higher and higher and this is emphasizing to investors that inflation is surging. Eventually raw and intermediate materials price increases work their way into the Consumer Price Index (C.P.I.) trend...Read More