
Wyckoff Power ChartingOctober 20, 2019 at 04:36 PM
Growth stocks and Income (Value) stocks often perform in opposition to each other. When the growth theme is strong, the value theme is lagging. On a secular scale two time periods come to mind...Read More
Wyckoff Power ChartingSeptember 23, 2019 at 09:00 AM
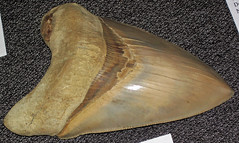
The plot of the B-Movie ‘The Meg' is the discovery of a living prehistoric shark the Megalodon. This movie shark was so big (the actual prehistoric Meg could reach 59 feet in length) that it could swallow ‘Jaws' whole...Read More
Wyckoff Power ChartingAugust 30, 2019 at 02:09 PM

A characteristic of this economic cycle has been the disappearance of yield. Yield has been like a glacier melting ever downward and eventually disappearing into the yawning gap it created...Read More
Wyckoff Power ChartingAugust 13, 2019 at 11:51 AM

Recently the stock market indexes entered a period of extreme volatility. Seemingly random events sent the indexes into rapid declines. These unexpected events blindsided many traders and investors...Read More
Wyckoff Power ChartingJuly 23, 2019 at 11:26 AM

An important oversold condition and Point and Figure objective were reached in August of 2018 for Gold ($GOLD). A Last Point of Support (LPS) formed at the Support line generated by the Selling Climax (SCLX) low in 2013 (to see the chart analysis – click here and click here)...Read More
Wyckoff Power ChartingJuly 08, 2019 at 08:00 AM

The S&P 500 Index appreciated 17.35% in the first half of 2019. But from the climax high close in January 2018 the S&P 500 has risen only 2.4%. Despite the stellar performance during 2019 the large capitalization indexes have remained ‘range-bound’ during the past 18 months...Read More
Wyckoff Power ChartingJune 11, 2019 at 08:00 AM

Gold and the Dollar are natural adversaries. They both represent a store of value. When the Dollar is strong, in comparison to other currencies, gold tends to underperform...Read More
Wyckoff Power ChartingMay 28, 2019 at 12:18 PM

In early May (see my 5/2 MarketWatchers LIVE appearance) it seemed that a hint of smoke was noticeable at the tippy top of the market rally. We looked at the attributes of Distribution that were evident in the smaller intraday time frames...Read More
Wyckoff Power ChartingMay 15, 2019 at 01:19 PM

The Dow Jones Industrial Average ($INDU) is the granddaddy of stock indexes. Charles Dow created the predecessor of this index in 1880s. The publication and distribution of this index was the forerunner of the Wall Street Journal...Read More
Wyckoff Power ChartingMay 07, 2019 at 05:30 PM

For most investors Campaigning stocks is an acquired skill. A stock campaign is typically a multi-year endurance event. In a classic uptrend a stock will have trending periods followed by consolidations (Wyckoffians call them Reaccumulations)...Read More