 |
Delivering The Web's Best Financial Commentary Straight To Your Inbox
|
| May 20, 2017 |
Hello Fellow ChartWatchers!
Welcome to the latest edition of ChartWatchers, the newsletter for technical analysts, online investors, StockCharts users and more. In addition to this week's articles, don't forget to check out the Site News section (below) for some important announcements and updates about what's going on around StockCharts this month!
Enjoy!
- Grayson Roze
Having trouble viewing this email? Click Here to view online
|
|
|
|
Members Dashboard Improvements Continue!
After the recent update to our Members Dashboard earlier this month, we've continued to make a number of exciting improvements to the new page. The Market Movers panel (located at the top right of the Dashboard) has been expanded to include more "Top 10 lists" for the Dow, S&P 500, London and India, as well as more SCTR reports for a number of new universes (mid-cap, small-cap, London and India). In addition to those new reports, we've also added both the Ticker Cloud and the DecisionPoint Scoreboard to the Market Movers panel! To access those features, click the blue dropdown menu in the top left corner of the Market Movers panel, then select your tool of choice.
It's also important to note that the options in the Market Movers panel are "sticky". Whichever Top 10 list, SCTR report or other tool you last viewed is stored in a simple cookie, so the next time you return to the Dashboard, you'll see that same selection. This allows you to set the Market Movers view to the feature that you're most interested in, whether that's the Dow's Top 10 list, the London SCTR Report, the Ticker Cloud or something else!
Over time, we will continue to enhance the Members Dashboard and make the page more and more valuable to you. We encourage you to spend some time with the new layout and explore all of the features it has to offer! You can click here to read our Support Center article with complete instructions on our new Members Dashboard.
|
|
|
|
|
|
|
by John Murphy
|
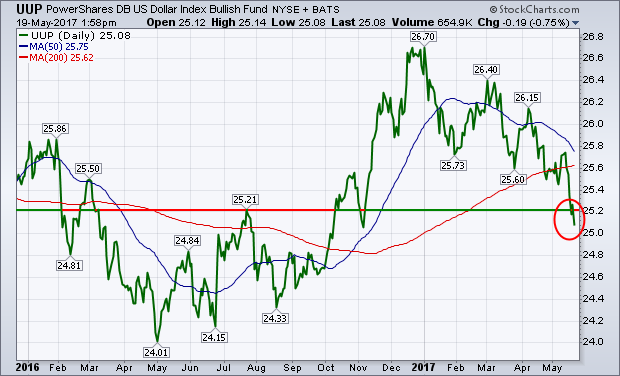 |
While stocks were rebounding last week, the dollar wasn't. Chart 1 shows the Power Shares Dollar Index ETF (UUP) falling again Friday to the lowest level since November. It may seem surprising to see the dollar continuing to drop with bond yields bouncing along with stocks. The dollar drop, however, may have more to do with improving European currencies. Chart 2 shows the... |
|
|
|
|
Bookstore Special
|
 |
|
|
|
by Arthur Hill
|
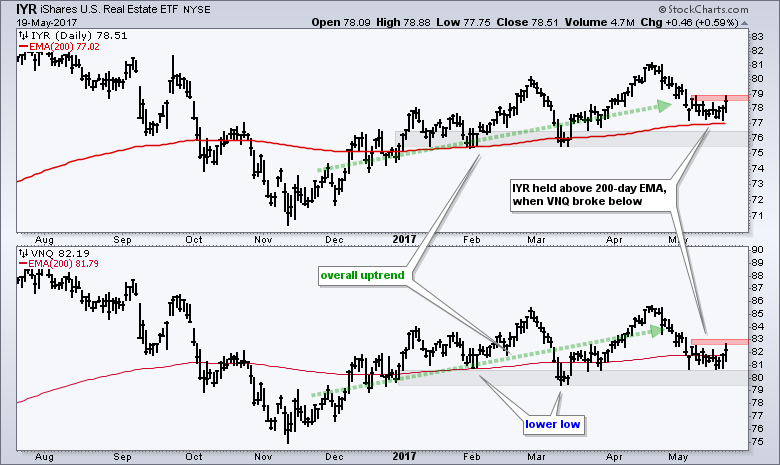 |
The REIT iShares (IYR) and the Vanguard REIT ETF (VNQ) are at interesting junctures because they corrected within an uptrend. Even though both are at potential reversal zones, chartists should be careful because retail REITs and hotel REITs are weak spots within the REIT universe. The chart below shows IYR with an uptrend since November and a recent pullback to the rising 200-day EMA in May. |
|
|
|
|
|
|
by Greg Schnell
|
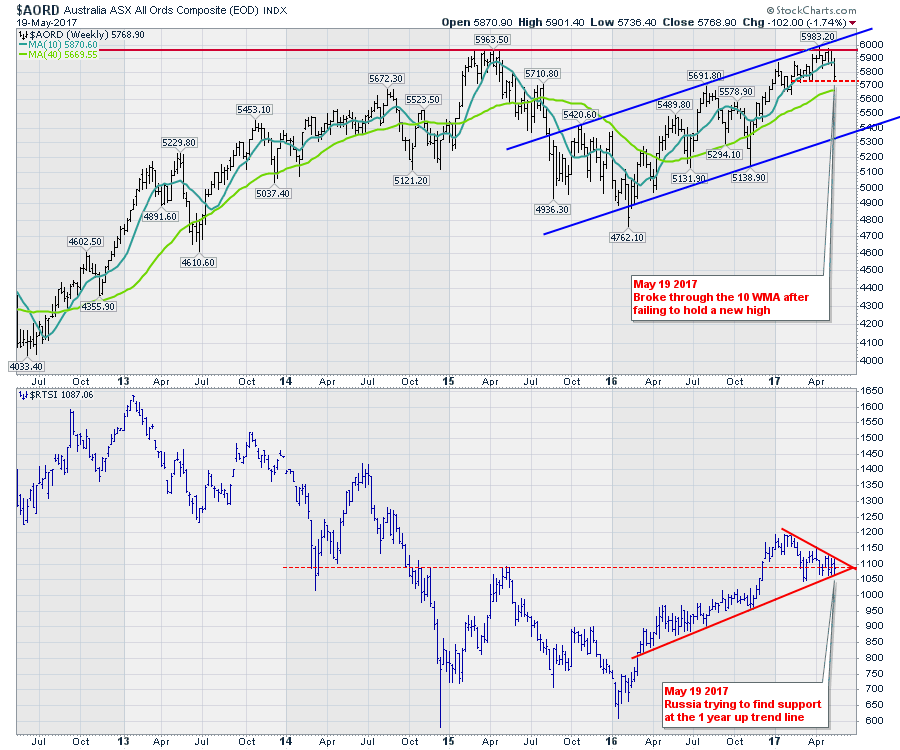 |
With the big swing this week, some of the foreign markets are retesting breakouts. Below are just a few markets to watch in the next few weeks. Australia ($AORD) failed to hold the breakout to new highs and has now lost the 10 WMA. While losing the 10 WMA is not that big of a deal, the size of the downward stroke right after trying to break through previous highs suggests not |
|
|
|
|
|
|
by Tom Bowley
|
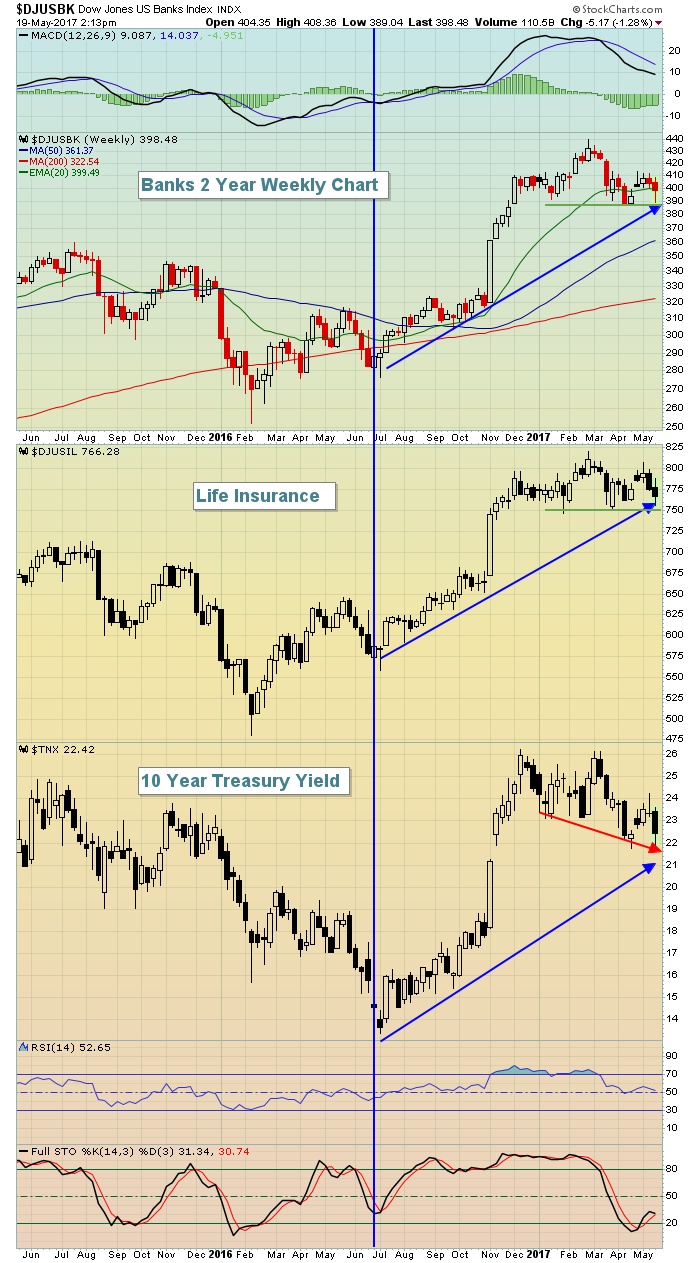 |
We saw the first significant selling pressure in months last week, especially on Wednesday. Financials (XLF) led the rout to the downside, but the sector did bounce back later in the week and, in the process, held key neckline price support within two key industry groups - banks ($DJUSBK) and life insurance companies ($DJUSIL). Both of these groups do well in a rising interest... |
|
|
|
|
|
|
by John Hopkins
|
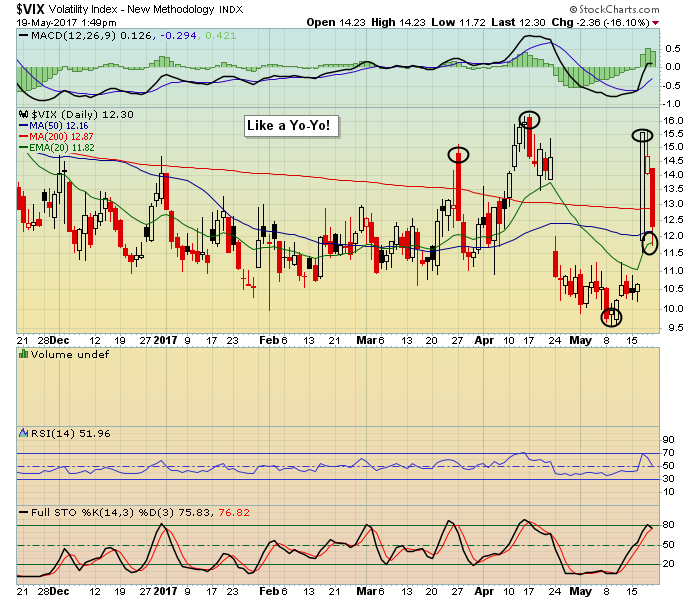 |
Anyone who trades the market on a regular basis knows how important it is to use whatever tools are available to make important decisions. This includes using charts to determine the strength/weakness of a specific stock, sector or index, zeroing in on key price and technical support/resistance levels and getting a handle on the overall mood of the market. For me one of the key indicators I use... |
|
|
|
|
|
|
by Erin Heim
|
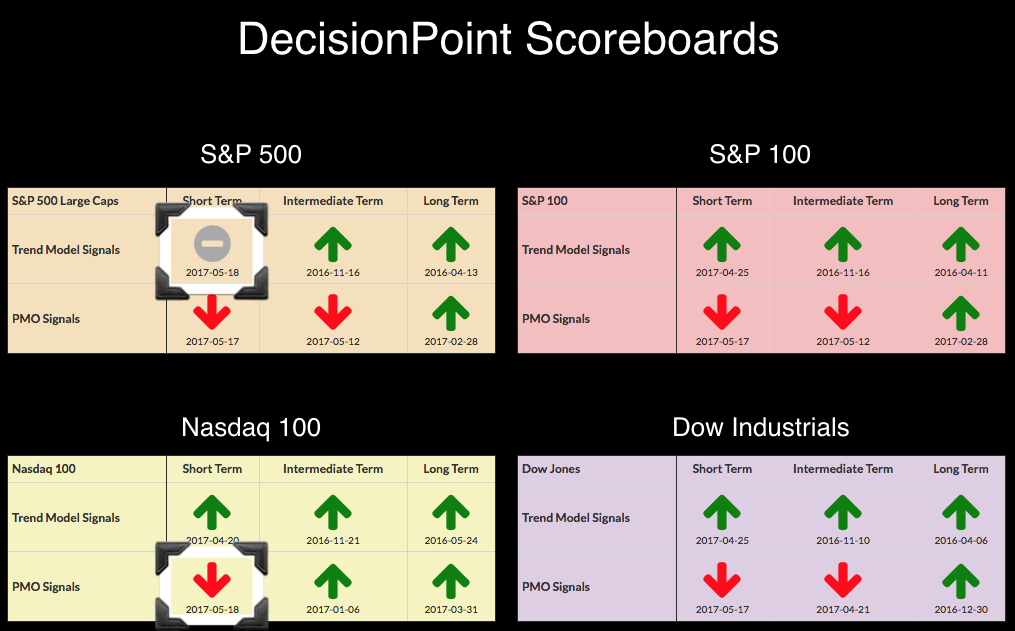 |
It was a rough finish to the week and it has shaken up the DecisionPoint Scoreboards. Additionally, the Intermediate-Term Trend Model (ITTM) generated a Neutral signal on the equal-weight Financials ETF (RYF) and a weekly Price Momentum Oscillator (PMO) SELL signal popped on the equal-weight Consumer Discretionary ETF (RCD). Believe it or not, these Scoreboards were completely |
|
|
|
 |
|
|
|
by Gatis Roze
|
 |
There is a seismic generational displacement happening in the investment landscape. Many investors are shifting their assets into indexes and ETFs as they move away from stocks and mutual funds. Due to this shift, a number of investment firms are having to make enormous changes themselves in order to remain relevant and profitable. I maintain that these investors' misplaced beliefs that... |
|
|
|
|
|
|
|
|
|
Unlock All of Our
Tools and Features
- + Larger, Full-Screen Chart Sizes
- + Intraday Charts with Real-Time Data
- + Exclusive, Members-Only Commentary
- + Custom Technical Scans and Alerts
|
|
|
|
|
 |
|
|
|
ChartWatchers is our free, twice-monthly newsletter for online investors and StockCharts users. Whether you are brand new to charting or a seasoned analyst, each edition of ChartWatchers brings you insightful, expert commentary from the industry's leading technicians. See what's really happening in the markets through their eyes and gain an edge in your own investing.
|
|
|
|
|
|
| For more information about the ChartWatchers Newsletter or to subscribe for free, Click Here |
This email was sent to [email]. Need the newsletter sent to a different email address?
Simply unsubscribe your current email, then re-subscribe using the new address. |
| Click Here to instantly unsubscribe |


