 |
|
Expert Technical Commentary Delivered Straight To Your Inbox
|
| December 2, 2017 |
Hello Fellow ChartWatchers!
Welcome to the latest edition of ChartWatchers, the newsletter for technical analysts, online investors, StockCharts users and more. In addition to this week's articles, here are a few important announcements for you:
Don't Miss Our Holiday Savings!
For a limited time only this holiday season, we're giving you 2 FREE months of StockCharts service when you sign up for a 12-month subscription! Renew your existing membership, add extra time your account or sign up for a new subscription today, and you'll receive 2 FREE months as an added bonus.
This special offer is reserved exclusively for StockCharts Members, but if you're not yet a member you can still take advantage of our 2 free months offer! Sign up for a free 1-month trial at StockCharts.com. Choose your Service Level from the Your Account page, then look for our Holiday Special banners throughout the site to get our 2 FREE months offer (or Click Here).
Join Us at ChartCon 2018 as a VIP
As we announced last month, ChartCon (our biennial investing and technical analysis conference) will be returning in 2018! Standard registration opens early in the new year, but we are now taking registrations for our unique VIP Packages.
With a small number of seats reserved at the event, we are inviting you to join us LIVE at ChartCon. Meet the experts in person, share dinner and drinks with the presenters and the StockCharts team, and immerse yourself in the action of the conference. We're even offering the chance to join us for a post-conference, all-inclusive Alaska cruise after ChartCon ends! Set sail for a week of exploration and adventure, and keep the ChartCon spirit alive with special VIP events, lectures, training sessions and more.
Learn more about our VIP packages for ChartCon 2018 HERE. But hurry! Space is very limited and already selling out quickly.
Until next time,
- Grayson Roze
Having trouble seeing this email? Click to view online
|
|
|
|
|
|
|
by John Murphy
|
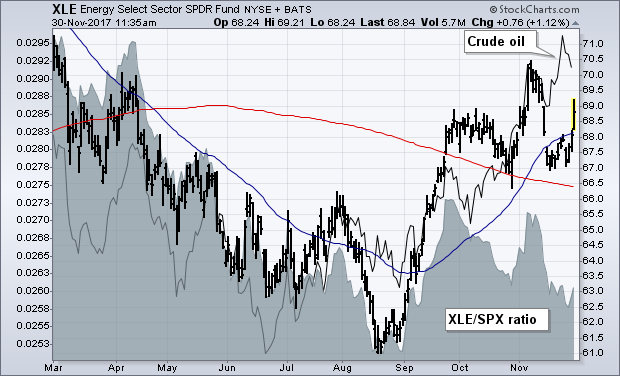 |
Energy shares are finally showing some bounce. The daily bars in the chart below shows the Energy Sector SPDR (XLE) climbing above its 50-day average today. The XLE is bouncing off chart support along its late October low and its 200-day moving average. Those are logical chart points for the XLE to start moving higher. [The 50-day average remains higher than its 200-day line which is also a... |
|
|
|
|
Bookstore Special
|
|
|
|
by Arthur Hill
|
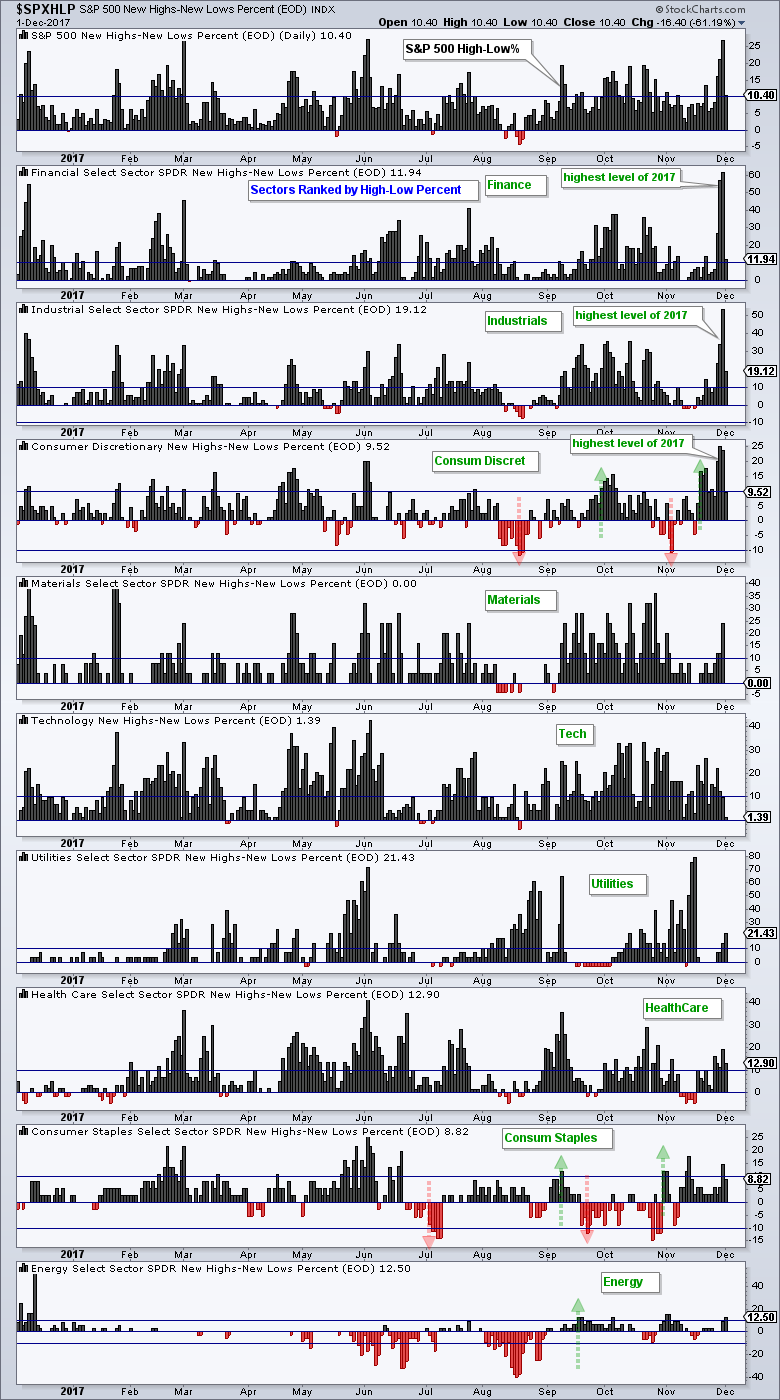 |
Chartists can plot High-Low Percent for the nine sectors to identify areas of strength within the stock market. The chart below shows the High-Low Percent ranked by this week's highest value. The finance, industrials and consumer discretionary sectors stand out this week because their High-Low Percent indicators hit the highest levels of the year. High-Low Percent for the finance and |
|
|
|
|
|
|
by Greg Schnell
|
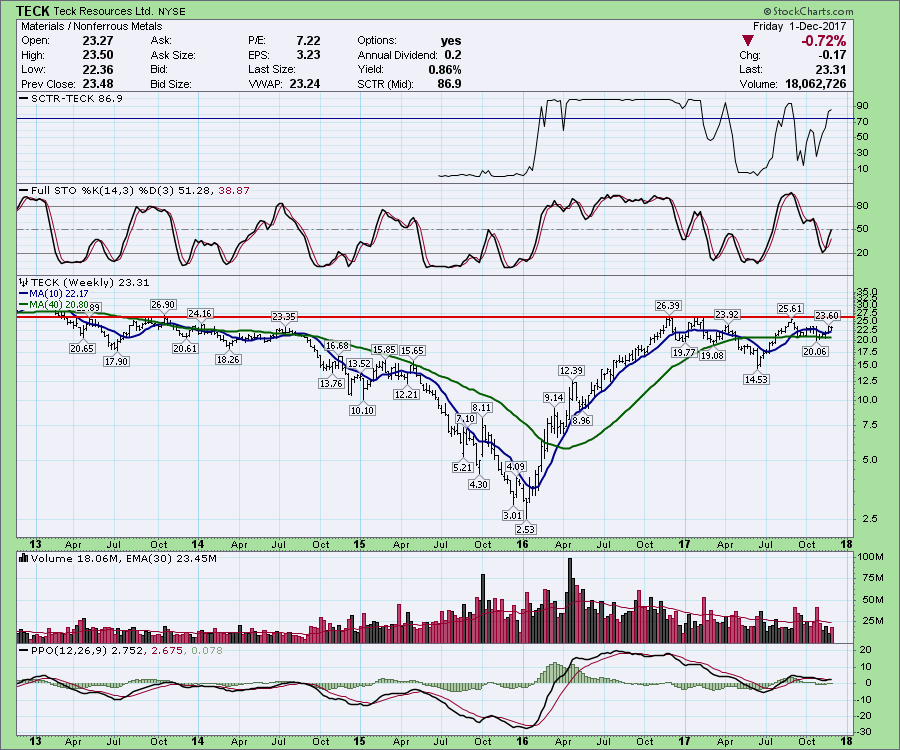 |
One of key principals of a global bull market is the major moves in the sectors as the market expands. As we head into 2018, there are a significant number of charts that suggest we could be on the platform for a significant move in commodities. The Commodities Countdown blog tries to show some of the major themes, including oil off |
|
|
|
 |
|
|
|
by Tom Bowley
|
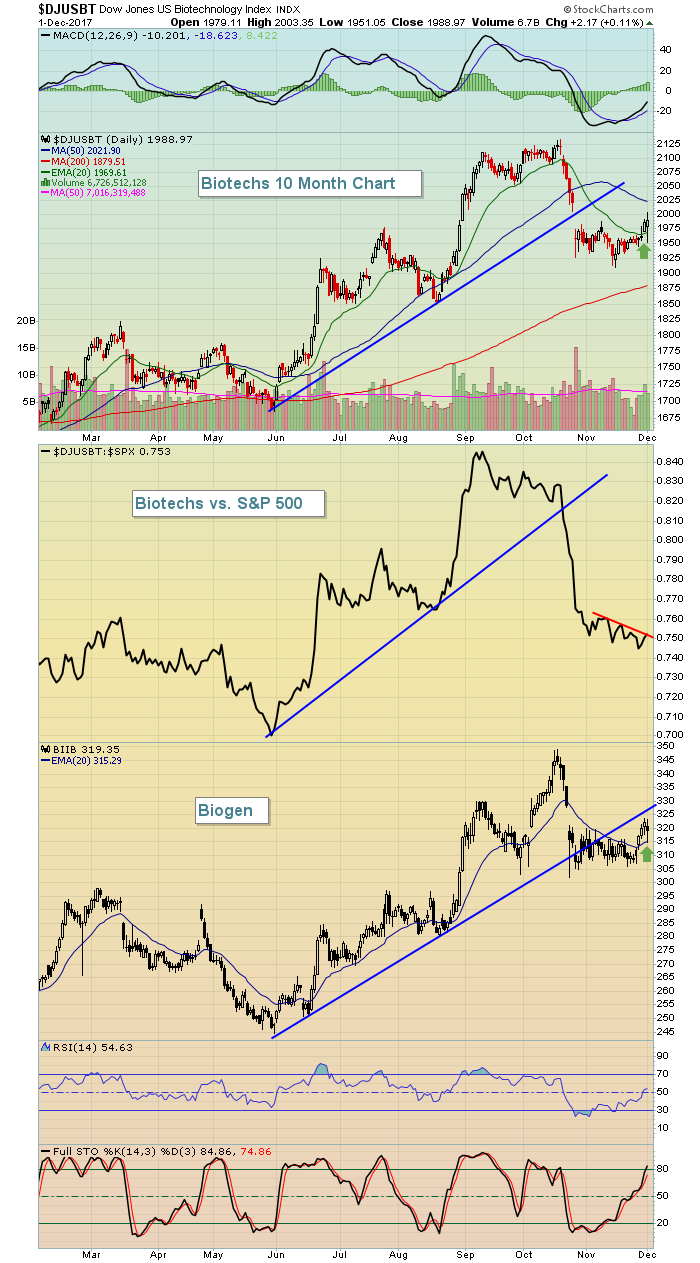 |
I love to combine bullish seasonality with strong or strengthening technical conditions. As we move into December, it's important to realize that there has been no better month for the S&P 500 since 1950 than December, which has produced annualized returns of +19.51%. Also, December has resulted in rising S&P 500 prices 50 of the last 67 years, easily the best such |
|
|
|
|
|
|
by John Hopkins
|
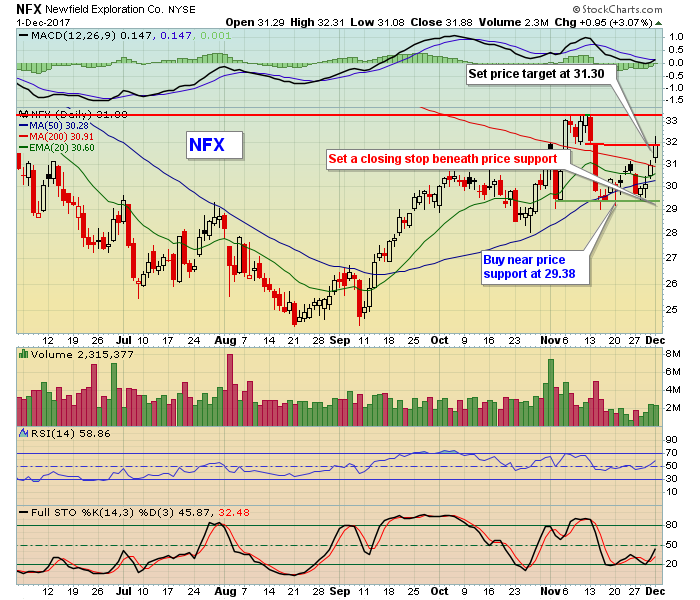 |
'Tis the season and I'd first like to wish everyone a happy holiday season. To health, happiness and prosperity! Feel free to sing along.... "We've made our (Chart)List we've checked it twice but we won't buy stocks at any ole price market makers will bring the price down" That's the tune we hum every day at EarningsBeats.com and it's how we post our impressive results day in... |
|
|
|
|
|
|
by Erin Heim
|
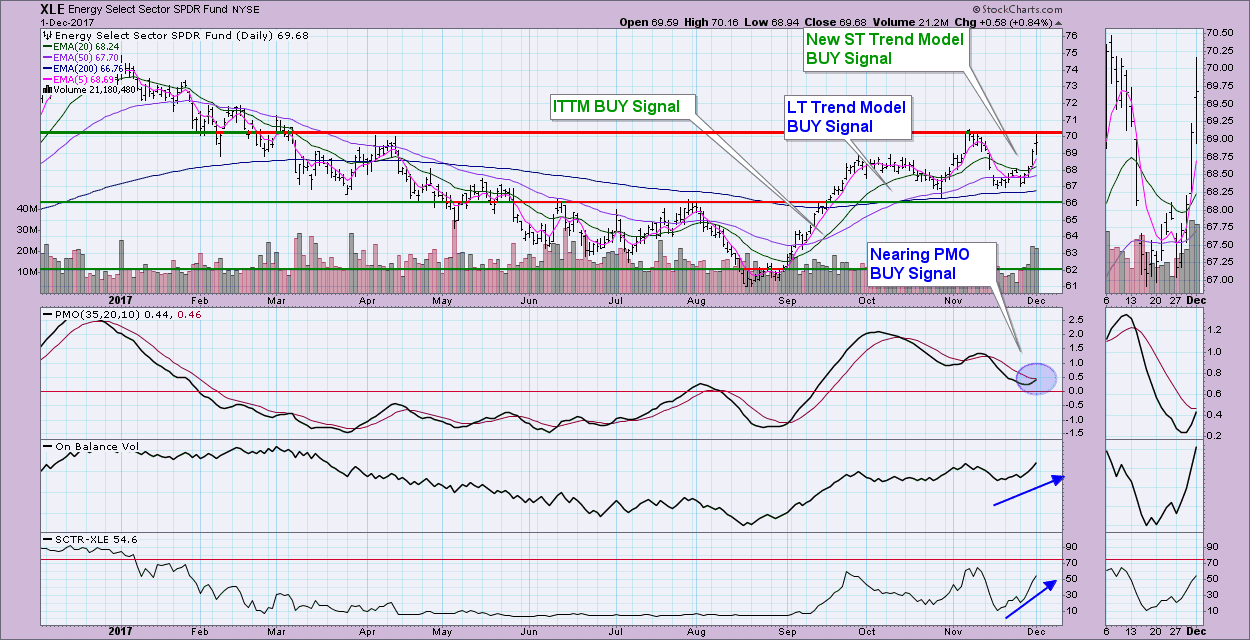 |
The energy sector has been on a bit of a rollercoaster the three months, moving from deep lows in August to a new trading range of large percentage highs and lows. I'm starting to see signs that the trading range is going to be history as price now is butting up against overhead resistance at the top of the trading range. On XLE, the Energy SPDR, we had a hint that the rally that started at the... |
|
|
|
|
|
|
by Gatis Roze
|
 |
With 25 years under his belt at Morningstar, Russel Kinnel, Director of Manager Research, has certainly earned my respect. So my radar went up when he wrote a column entitled "Lessons Learned." Considering that Kinnel has been a keen observer of individual investor behavior for a generation, I believe all of us can profit by heeding his wisdom. In the |
|
|
|
|
|
|
|
|
|
Unlock All of Our
Tools and Features
- + Larger, Full-Screen Chart Sizes
- + Intraday Charts with Real-Time Data
- + Exclusive, Members-Only Commentary
- + Custom Technical Scans and Alerts
|
|
|
|
|
 |
|
|
|
ChartWatchers is our free, twice-monthly newsletter for online investors and StockCharts users. Whether you are brand new to charting or a seasoned analyst, each edition of ChartWatchers brings you insightful, expert commentary from the industry's leading technicians. See what's really happening in the markets through their eyes and gain an edge in your own investing.
|
|
|
|
|
|
| For more information about the ChartWatchers Newsletter or to subscribe for free, Click Here |
This email was sent to [email]. Need the newsletter sent to a different email address?
Simply unsubscribe your current email, then re-subscribe using the new address. |
| Click Here to instantly unsubscribe |


