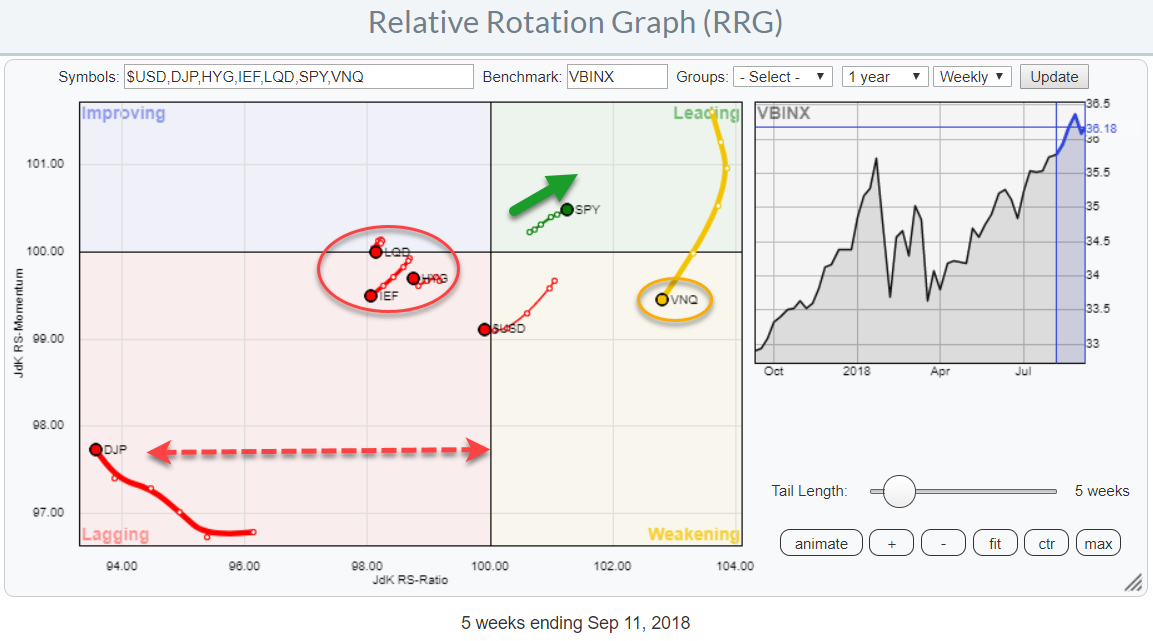
 The Relative Rotation Graph shows the relative positions of various asset classes (ETFs) against VBINX, a Vanguard balanced index fund, as the benchmark.
The long tails for Real Estate and Commodities stand out, as well as the cluster of fixed income related asset classes inside the red oval.
The strongest clue, on this RRG chart, however, is coming from SPY which is the only asset class inside the leading quadrant AND the only asset class moving at a positive RRG-Heading.
The weak rotation for the US dollar index theoretically suggests that international equity markets are improving over the US. However, on the Relative Rotation Graph for various regional equity markets, I do not see that confirmed.
Commodities
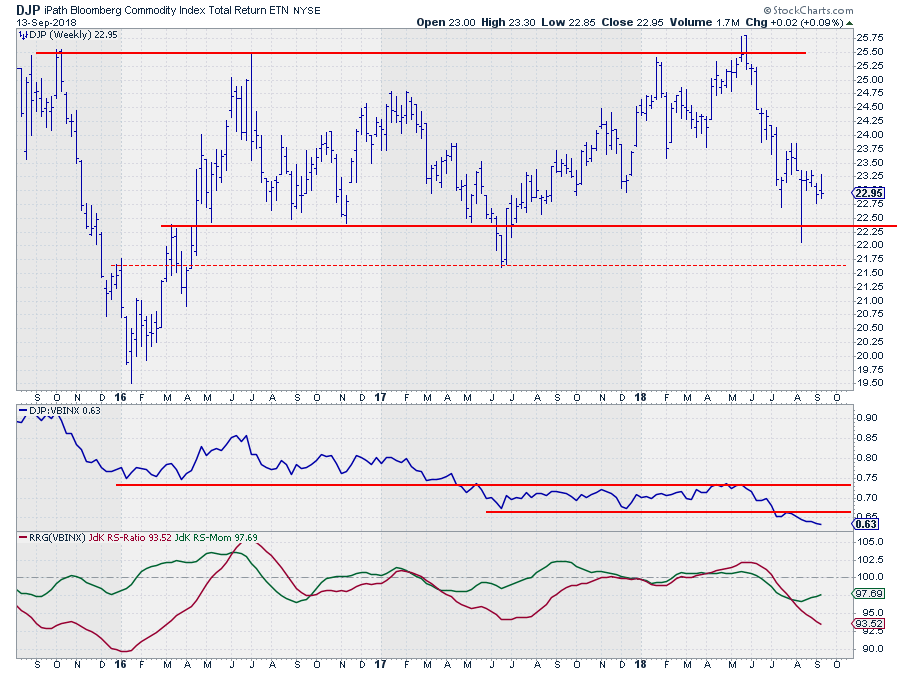 âÂÂÂÂ?ÂÂÂÂ?Commodities (DJP) once again peaked against the upper boundary of its trading range at the end of May. From that peak, a swift decline took commodities back to the lower boundary of the range where the market is currently hovering.
This range is now in play since mid-2016, so over two years already, This makes a break in any direction meaningful. From a price perspective, there are not many clues as to which direction the market will choose.
In the RRG above, I am comparing commodities with VBINX, a Vanguard Balanced Index Fund that holds 60% equities and 40% bonds. With that fund being driven higher, especially by its equity component, over the past years, the relative strength of commodities as an asset class was mediocre at best. After a long decline in RS also a trading range became visible.
The recent weakness, however, has pushed the relative strength for commodities below its support following the RRG-Lines which were already below the 100-level for a while. Therefore, very little (out-) performance is to be expected from this asset class.
Real Estate
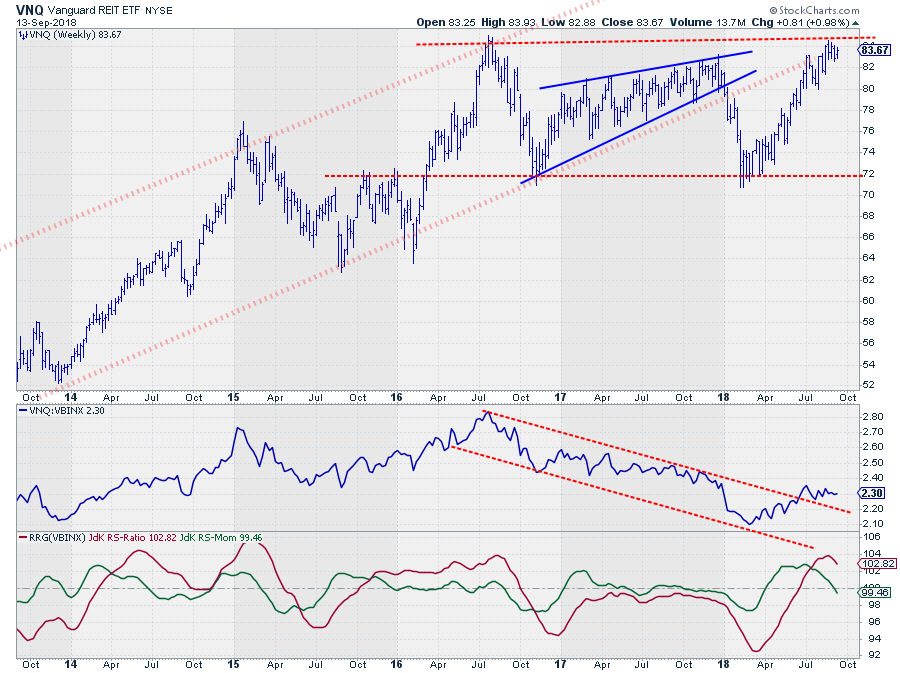
After its massive run up from $ 15 in 2009 to the peak at $ 85 in August 2016, VNQ started to move sideways and broke its rising support line at the beginning of this year (2018). That break resulted in an acceleration to support around $ 72 where a new low was formed.
The current rally is now running into trouble at the double resistance near $ 85, coming from the old support line that now acts as resistance and horizontal resistance coming from the 2015 high. This combination is now limiting the upside potential for VNQ.
From a relative perspective, the outlook seems a bit better. The JdK RS-Ratio line followed the RS-Momentum line higher when raw relative strength managed to break above its falling resistance but a rally did not materialize (yet).
The lack of follow-through resulted in a downturn of the RRG-Lines which positions VNQ inside the weakening quadrant after a rotation through leading. Measured on the RS-Ratio scale, Real Estate is still the strongest asset class. I am on the lookout for a turn back up towards the leading quadrant while still inside leading.
A break above resistance around $ 85 could well be the catalyst for such a rotation in coming weeks,
Equities
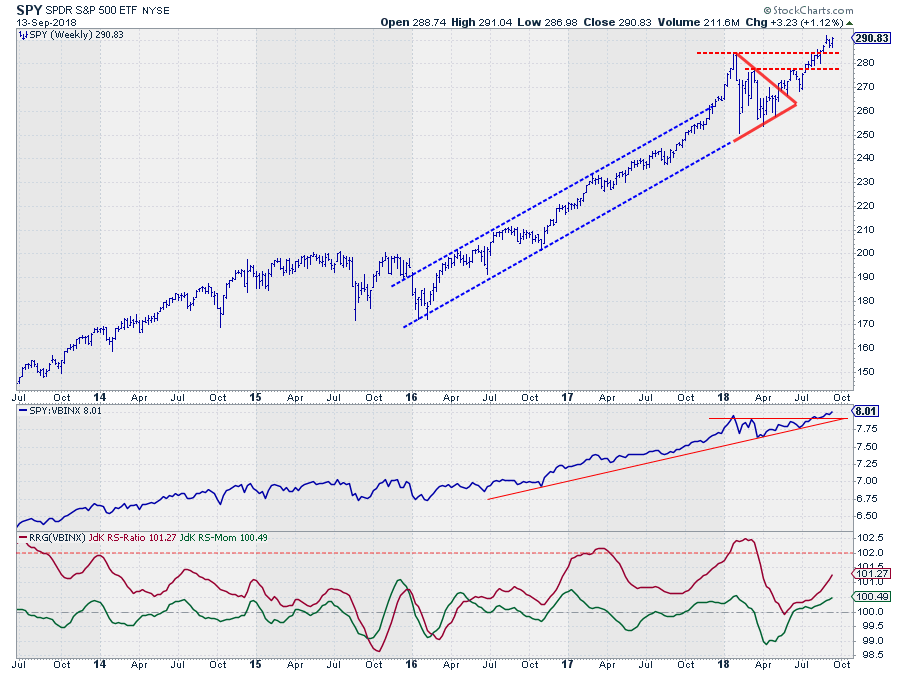
The SPY chart continues to show strength, especially after taking out the, early, 2018 high.
The prelude for this break came when SPY managed to break away from the symmetrical triangle and subsequently managed to take out the first horizontal barrier just below 280.
So far every dip in the S&P 500 has been used as a buying opportunity by investors causing a continued rhythm of higher highs and higher lows. It's better not to argue with that phenomena.
Relative strength from an asset allocation perspective is showing similar behavior. The raw RS-Line broke to new highs while the RS-Ratio line took off again to higher levels after a touch and go with the 100-level in May.
Neither price nor relative strength is sending any warning signals with regard to the direction of the S&P at the moment. The only observation that I, still, see is the preference for more defensive sectors among stock investors as highlighted in this article.
But so far even these defensive sectors have managed to keep the uptrend in SPY intact.
Bonds
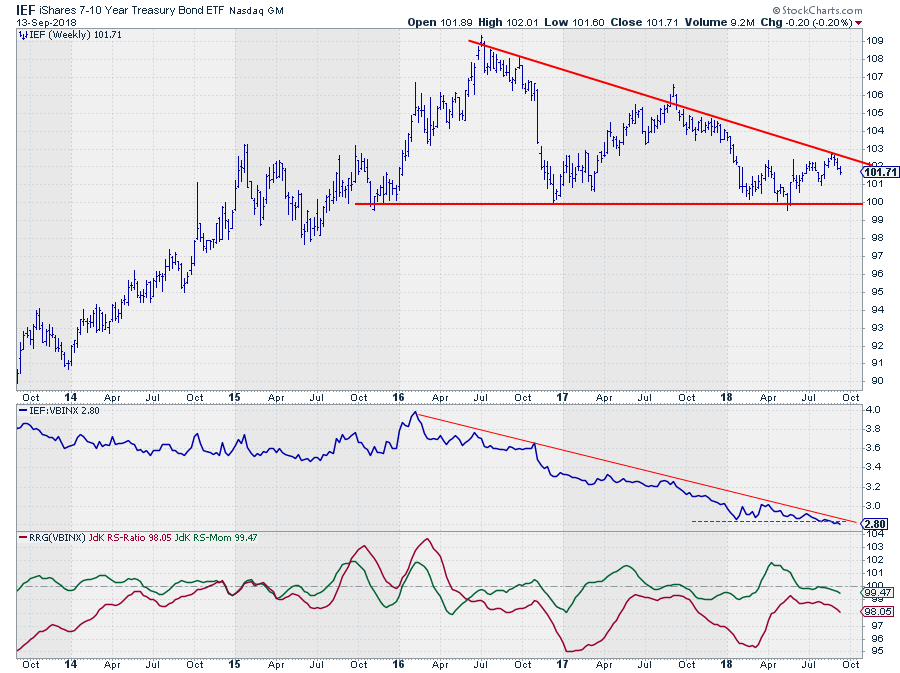 On the IEF chart, a descending triangle is developing, for a while already.
The lower boundary of this formation lies at $ 100 while the descending resistance line that connects the major highs since 2016 is now found around $ 102.
Descending triangles are price patterns with a negative expectation, a break to the downside. The rationale behind this is that buyers have been coming back to the market at the same level a few times (the lows in the formation) while the sellers over the same period came back at lower levels each time (the highs in the formation).
The sellers happy to accept lower prices while buyers were not ready to pay higher prices. As soon as the buyers give up and the sellers keep coming back, the horizontal level that marks the bottom of the formation gives way and an acceleration of the decline is expected as there are no buyers left.
I am not a big fan of price patterns that stretch out over a very long period. What I usually do to get a confirmation and see if the suspected price pattern is really playing out is to switch to a higher time frame, in this case, the monthly chart.
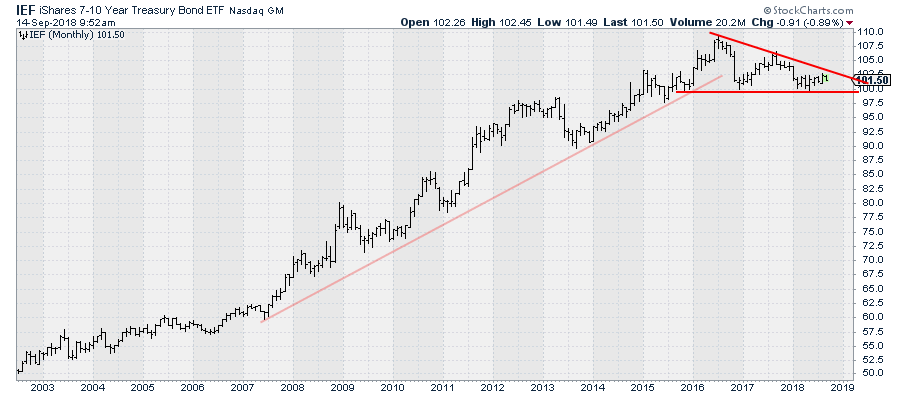 This shows the descending triangle much more pronounced and in combination with the prior up-trend gives a better perspective of the potential impact.
Descending triangles can come as reversal or continuation formations. In this case, there is little doubt that it will be a reversal formation. IF the break comes around 2/3 of the base of the pattern, which is roughly where we are now in time, give or take a few bars (months). If support holds up and IEF continues to move sideways and eventually come above the falling resistance the triangle becomes void.
Equity/Bond
The almost opposite charts for IEF and SPY are reflected in their position on the relative rotation graph for asset classes. SPY is in the leading quadrant heading higher on both axes while IEF is inside the lagging quadrant and heading lower on both axes.
For now, this means that the Equity/Bond relationship is still very much in favor of Equities.
Let me know what you think of this usage of RRG in the comments below. If you would like to receive a notification when a new RRG blog article is published, simply "Subscribe" with your email address.
Julius de Kempenaer | RRG Research
RRG, Relative Rotation Graphs, JdK RS-Ratio, and JdK RS-Momentum are registered TradeMarks ®; of RRG Research
Follow RRG Research on social media:
If you want to discuss RRG with me on SCAN, please use my handle Julius_RRG so that I will get a notification.
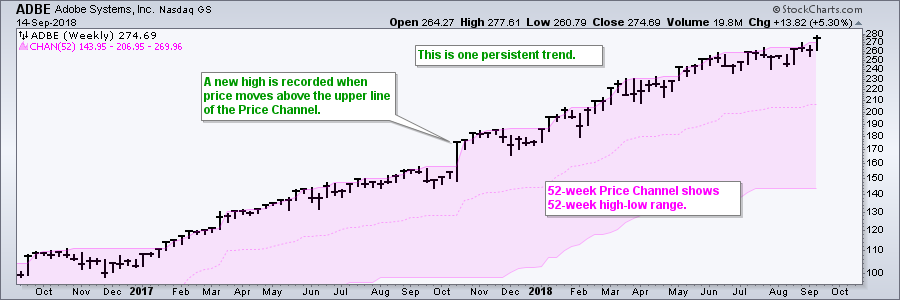
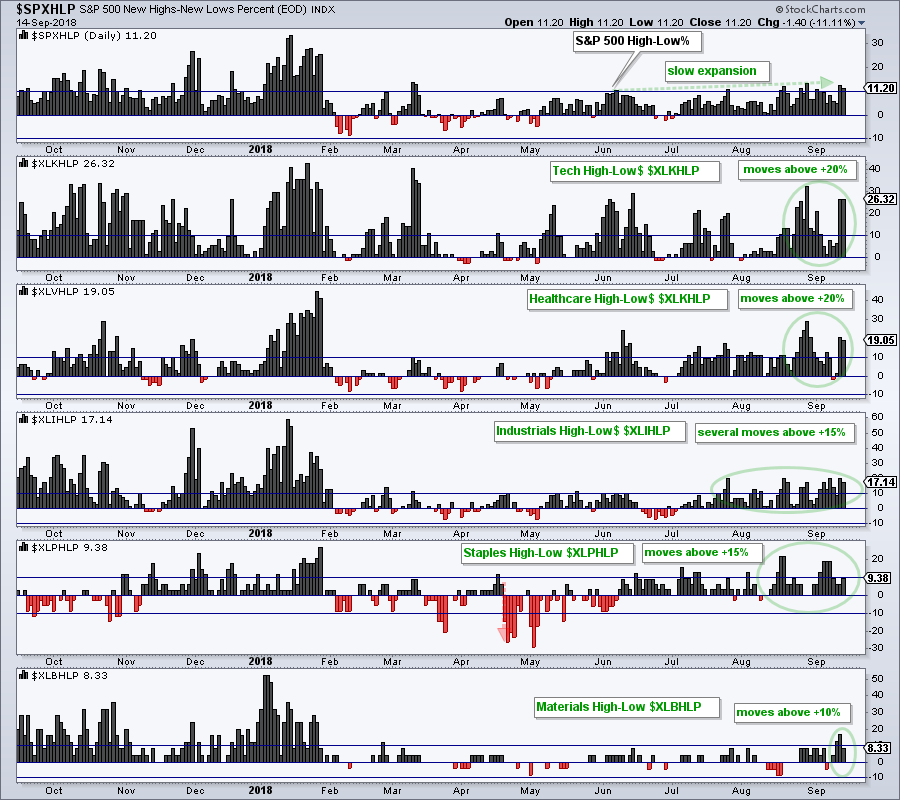
 There are lots of indicators out there, but one metric stands head and shoulders above the rest. No, it is not a head-and-shoulders pattern. There are hundreds, if not zillions, of ways to measure the trend and identify trend reversals. Over the years, I have found trend reversals to be more the exception rather than the norm. Trends show a tendency to persist and this means we are better off staying with the trend instead of looking for reversals.
 I did a review of UTX on a Don't Ignore This Chart article titled
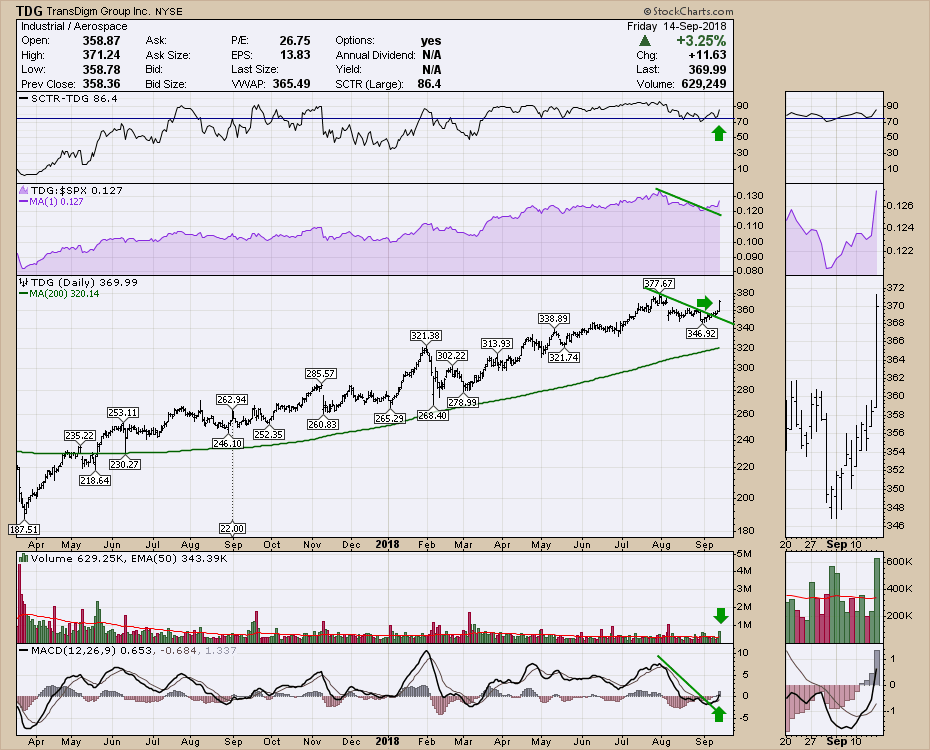
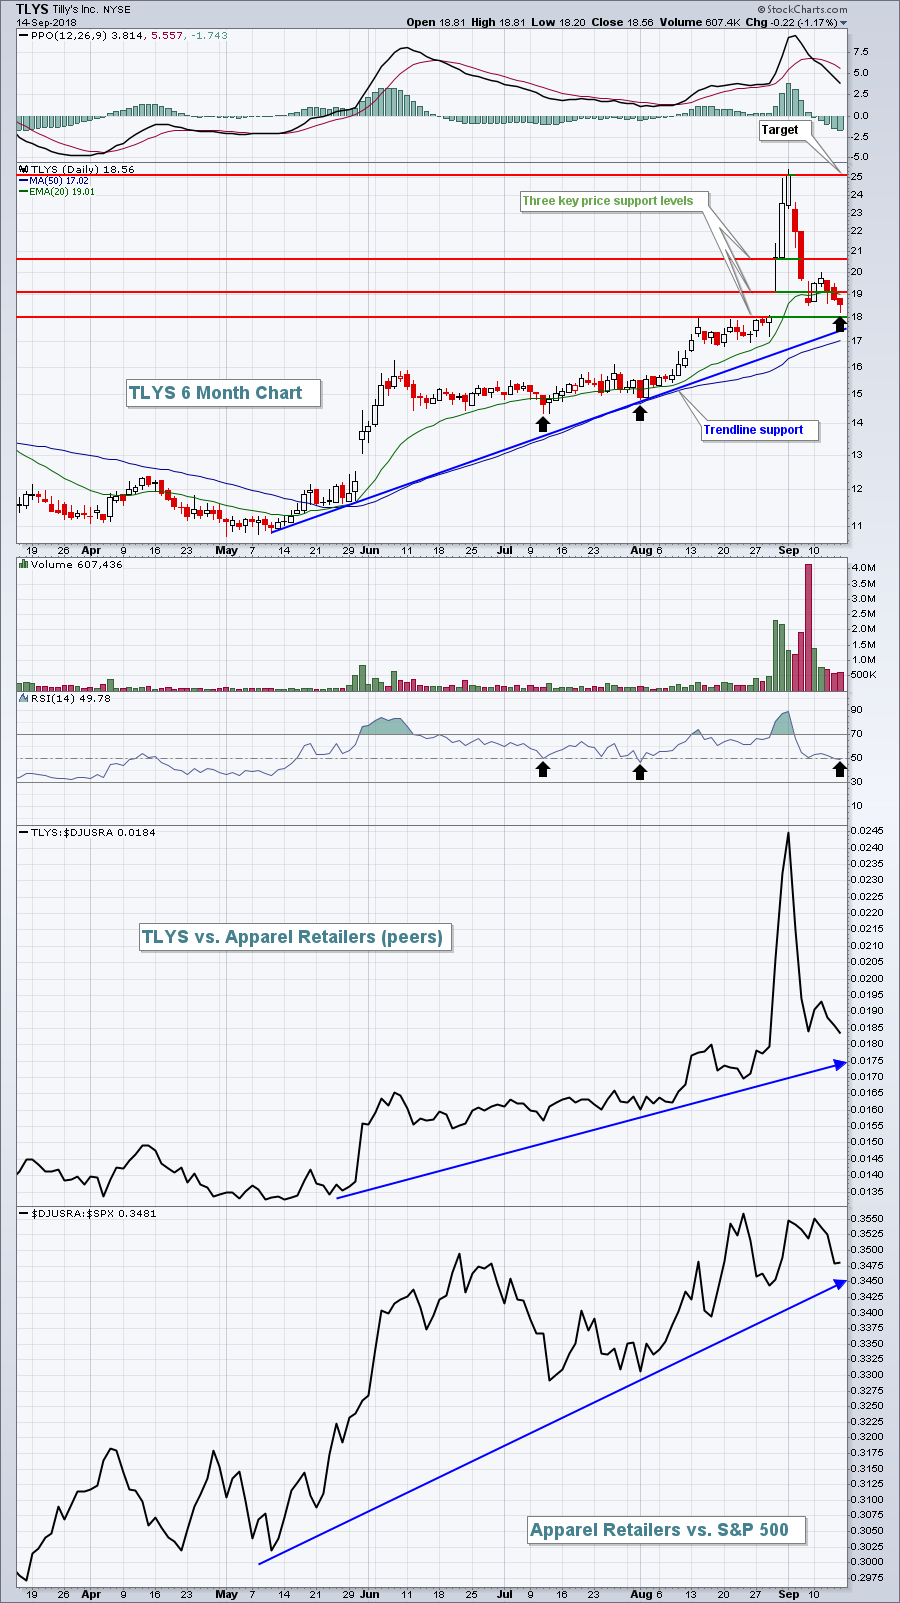
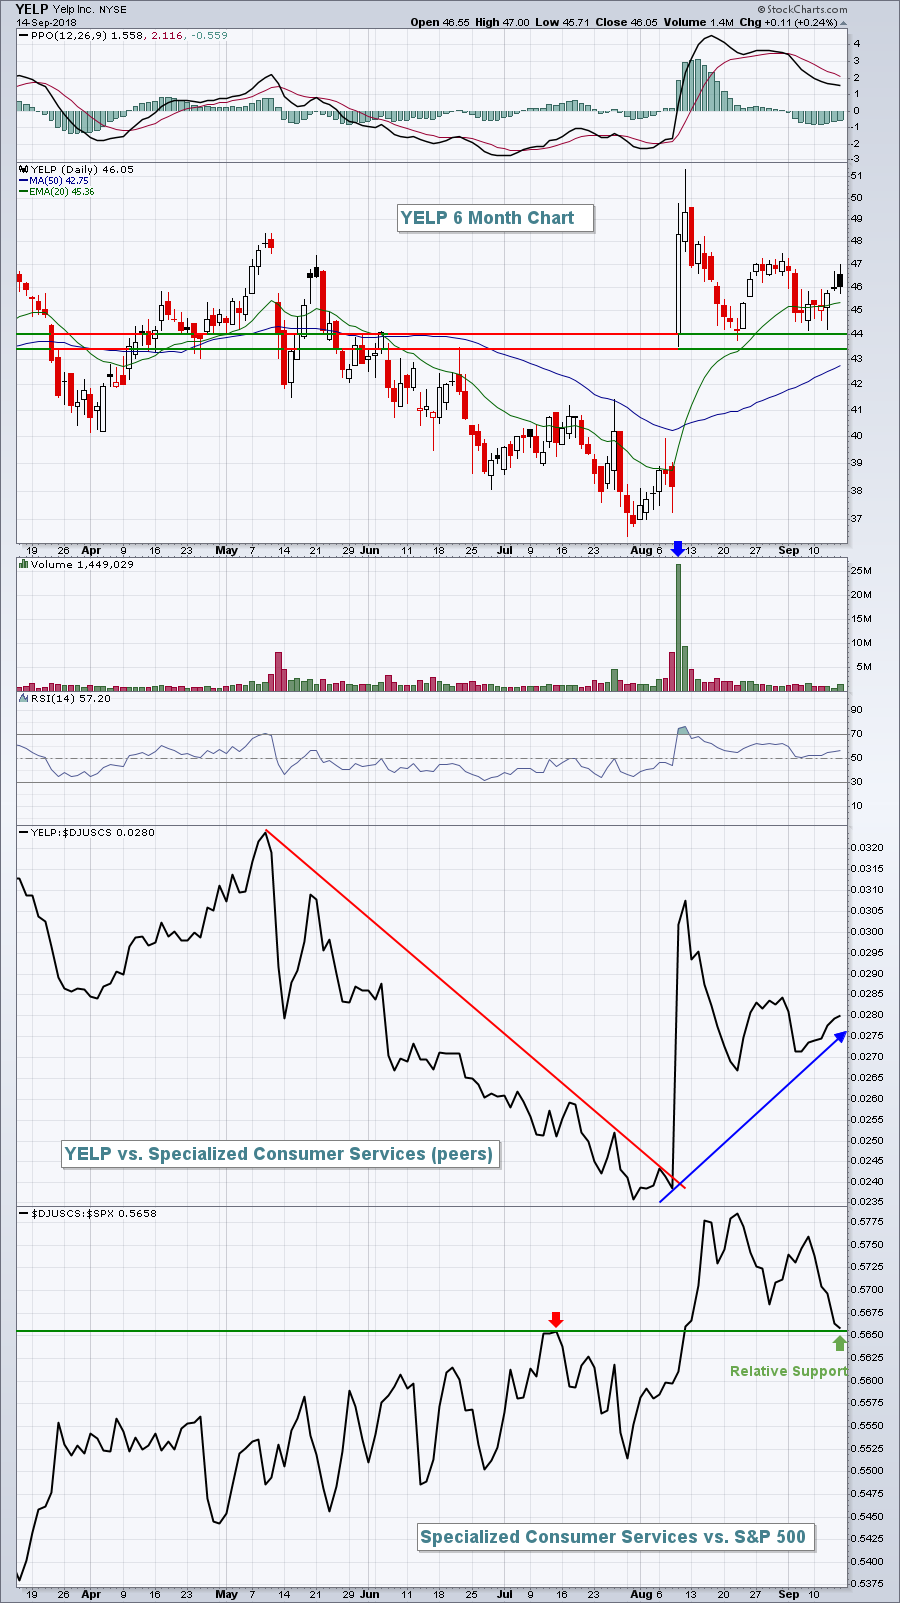
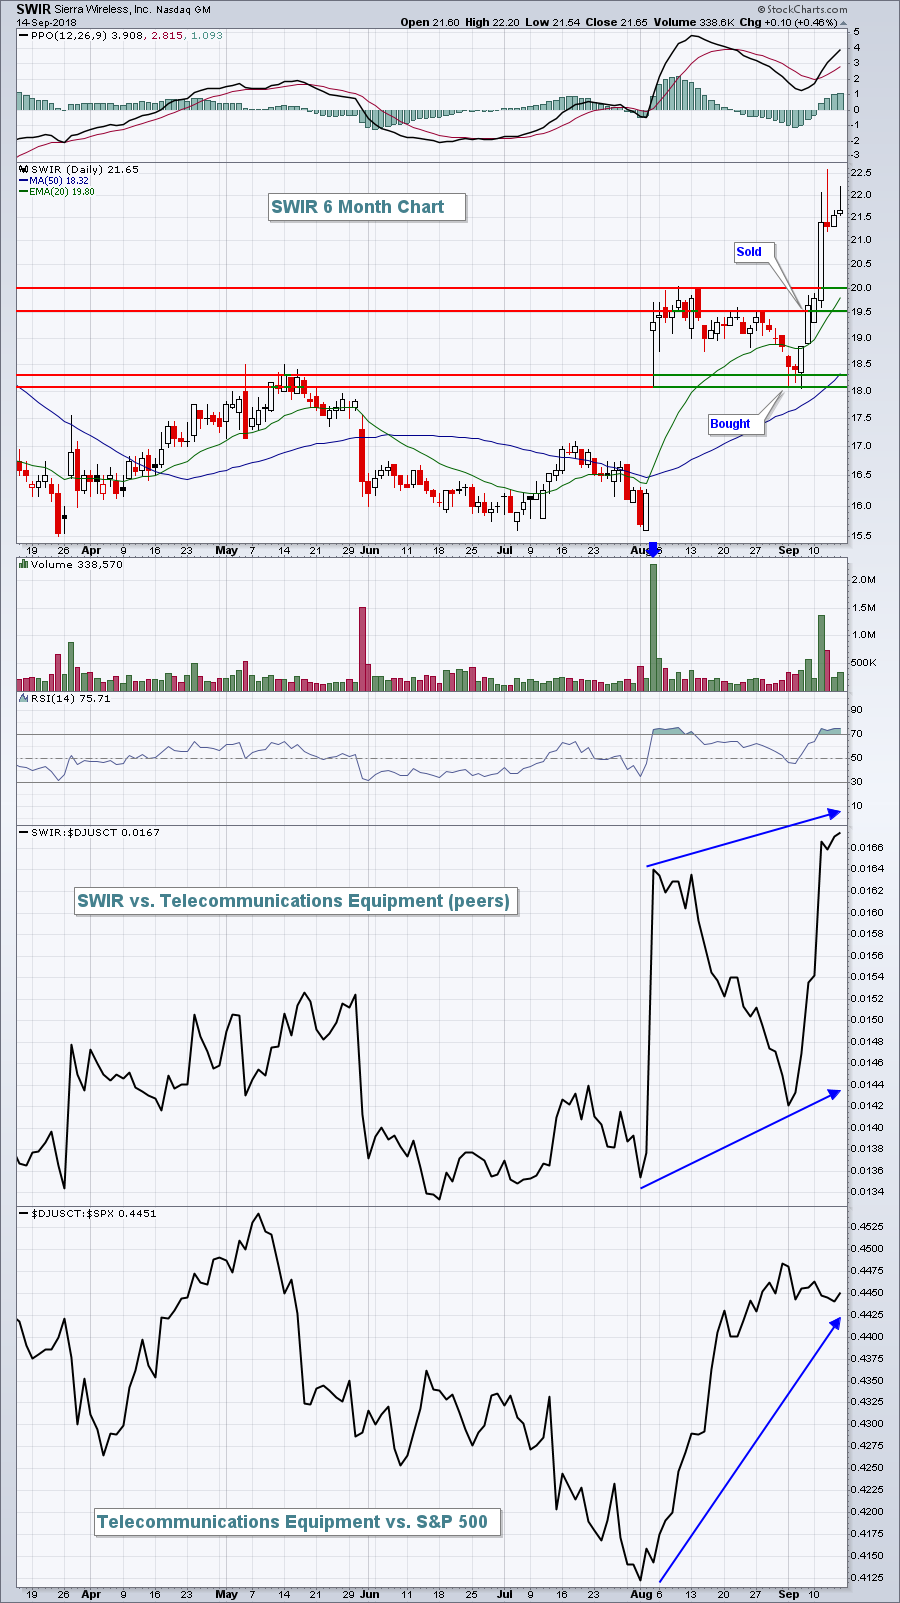

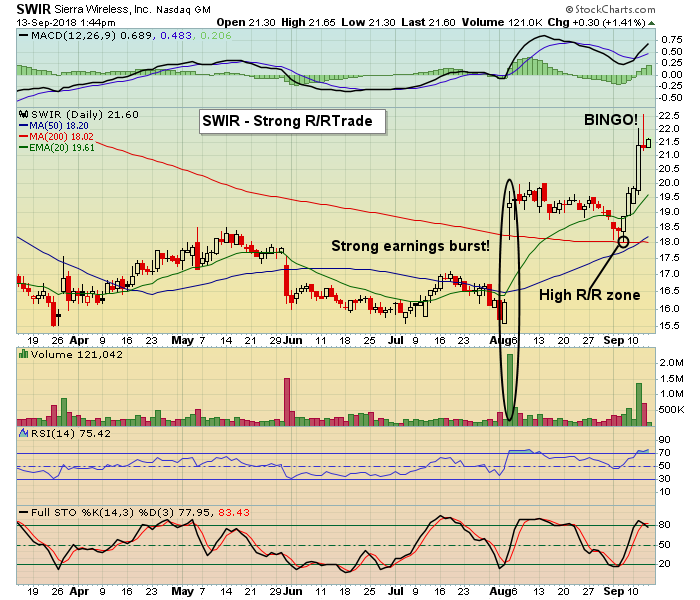 You can see that the stock moved up sharply on extremely heavy volume once earnings were released. The stock then settled down for a few weeks until it pulled back to a key technical level, its