| THIS WEEK'S ARTICLES |
| The Market Message |
| Stocks Rally on Reduced Mideast Tensions |
| by John Murphy |
After several tense days, some calm is being restored to global markets. The fact that last night's attack by Iran on allied bases in Iraq resulted in no casualties; plus a more conciliatory-sounding speech by President Trump shortly before noon appear to have reduced geopolilitical tensions in the Mideast. That can be seen by reactions in financial markets. Global stocks are in rally mode. Stock indexes in the U.S. are having a strong day with the Nasdaq in record territory and the S&P 500 not far behind.
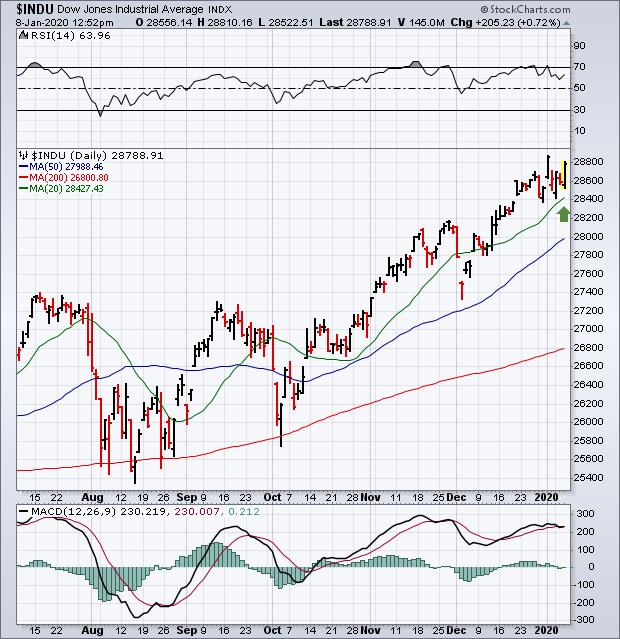
Chart 1 shows the Nasdaq Composite trading in record territory today. Chart 2 shows the S&P 500 close to doing the same. Chart 3 shows the Dow Industrials also nearing record territory. All three remained above their green 20-day moving averages which kept their uptrends intact.
Ten of eleven stock sectors are in the green today led by financials, technology, communications, cyclicals, and industrials. Three of those sectors SPDRs are in record territory. Safe havens like bonds and gold are being sold today. So are energy stocks which are the day's only sector losers on a big drop in the price of oil. Airlines and transportation stocks, however, are getting a boost from weaker oil.
Chart 1
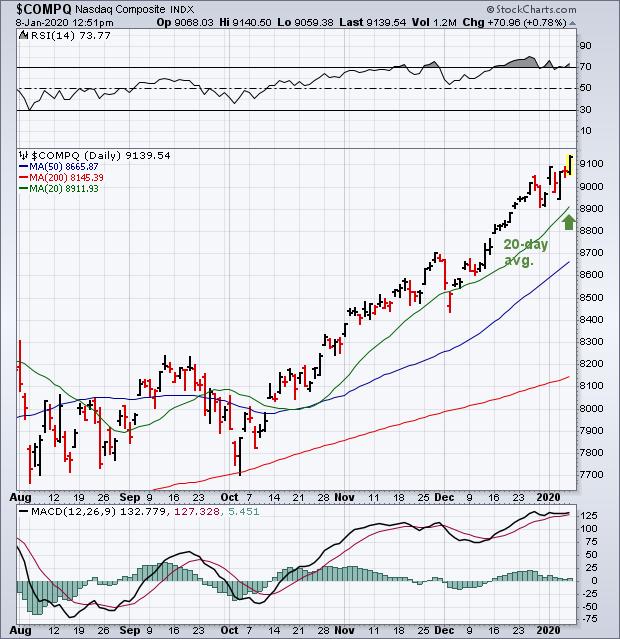
Chart 2
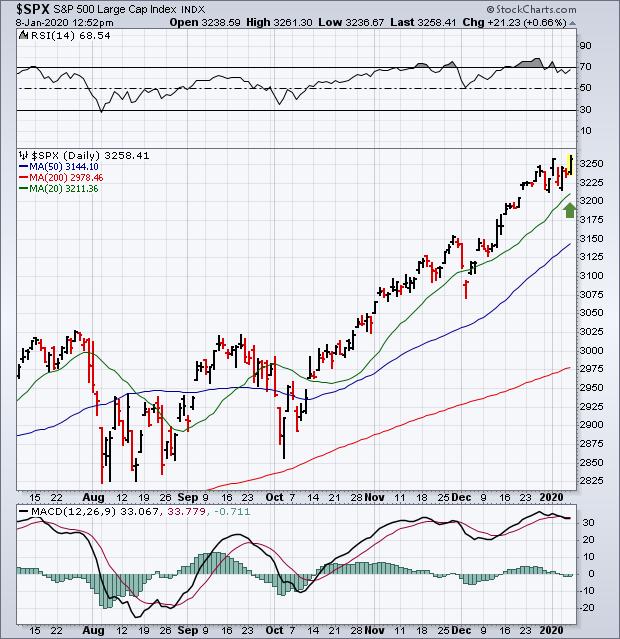
Chart 3
Editor's Note: This is an excerpt of an article that was originally published in John Murphy's Market Message on Wednesday, January 8th at 12:53pm ET. Click here to read the full article, which includes Charts 4-8.
|
| READ ONLINE → |
|
|
|
| Art's Charts |
| REIT SPDR Holds Key Moving Average as its Biggest Components Spring to Life |
| by Arthur Hill |
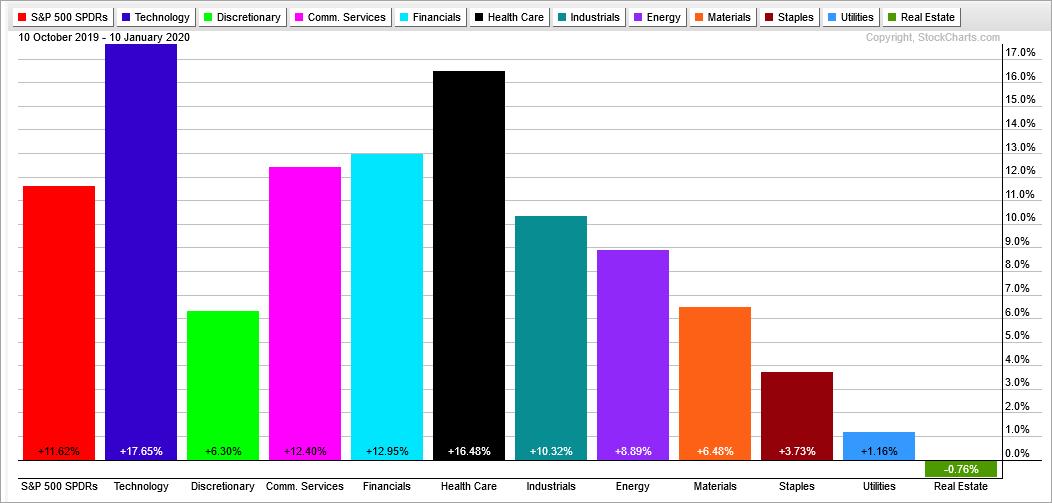
 Ten of the eleven sector SPDRs are positive over the last three months. The Real Estate SPDR (XLRE) is the only sector sporting a loss (~.75%), but I am not concerned with relative weakness because the price chart looks bullish overall. Note that XLRE was the leading sector in early September with the biggest year-to-date gain at the time. It basically moved from leader to laggard over the last three months. Can it move back to leader? Let's check the chart. Ten of the eleven sector SPDRs are positive over the last three months. The Real Estate SPDR (XLRE) is the only sector sporting a loss (~.75%), but I am not concerned with relative weakness because the price chart looks bullish overall. Note that XLRE was the leading sector in early September with the biggest year-to-date gain at the time. It basically moved from leader to laggard over the last three months. Can it move back to leader? Let's check the chart.
Despite relative and absolute weakness since mid October, the price chart shows promise as XLRE bids to end its correction. The ETF advanced some 35% from late December to late October, and hit a new high in the process. This was a massive move and the ETF was entitled to a rest at some point. That point came in the fourth quarter as the stock fell back to the rising 200-day SMA. I still think the long-term trend is up because the 200-day largely held and the PPO(20,200,0) remains positive. This means the 20-day EMA is above the 200-day EMA.
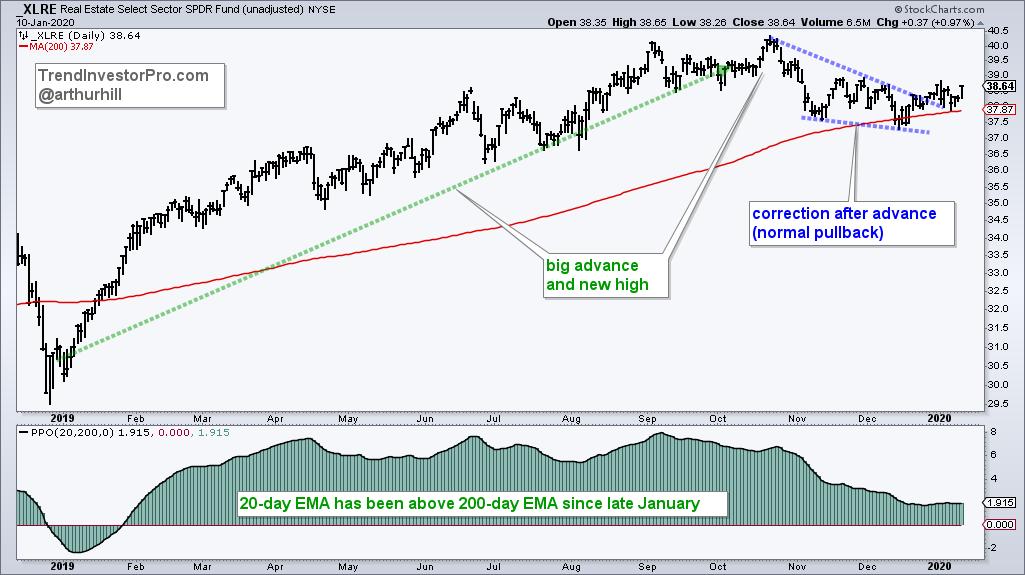
Now let's look at the pattern at work. A falling wedge formed from October to December. These patterns are typical for corrections after advances. The ETF broke above the wedge line in late December and this breakout is largely holding over the last two weeks. This breakout signals an end to the corrective period and a resumption of the bigger uptrend. As such, a move towards, and above, the October high is expected. I would re-evaluate this bullish thesis on a close below 37.50.
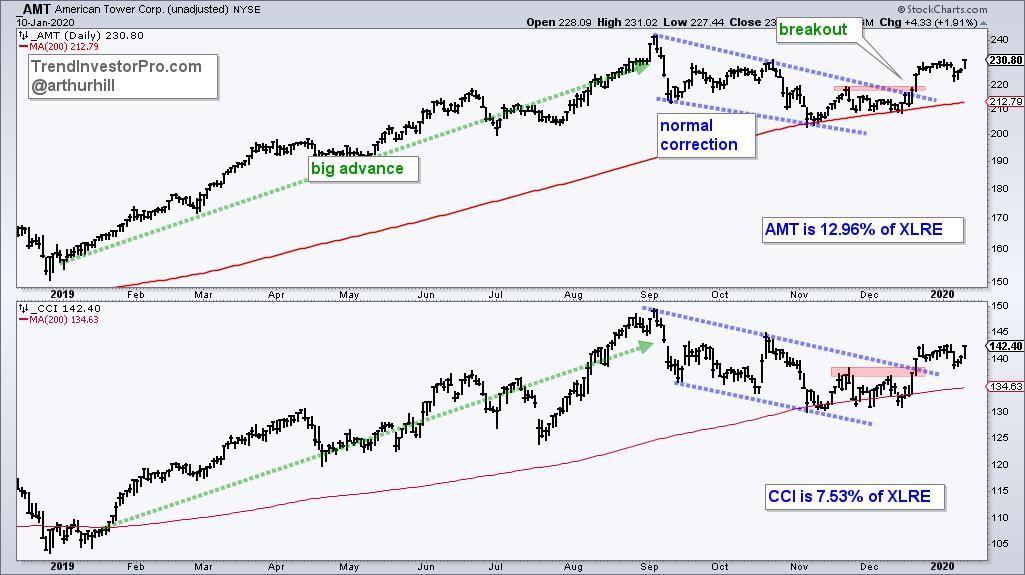
The sector SPDRs are often dominated by a few large-caps and XLRE is not an exception. The two largest stocks, American Tower (AMT) and Crown Castle (CCI) account for over 20% of the ETF. Unsurprisingly, these two cell tower REITs have similar patterns at work. Both hit new highs in early September after big advances, corrected into November and broke out in December. These breakouts bode well for the stocks and for XLRE.
Looking to reduce the noise, cut the hyperbole and focus on what really matters? Check out TrendInvestorPro.com, the home of objective, systematic and thoughtful analysis. Subscribe today and get immediate access to: Weekly Ranking and Analysis for 60 Core ETFs, ETF ChartBook, Market Timing Report, Weekend Video and Saturday Stock Setups. Click here to take your analysis to the next level.
--------------------------
A Challenge for 2020 | Arthur Hill, CMT | Next Level Charting
------------------------------
|
| READ ONLINE → |
|
|
|
| The Canadian Technician |
| Is Big Retail Cliff Diving? |
| by Greg Schnell |
It has been a 10-year parade of improving jobs numbers; naturally, December was no different. There was lots of rhetoric about one level vs. the other, but overall it was hardly a worrisome report. Canada improved this month, but last month was the worst jobs report since 2009. That's the kind of data change that gets a second look! With that as a comparison, the USA jobs number looks great.
So, as I scrolled through some of the S&P 500 charts while (not) binge-watching Netflix shows with my wife, I noticed a few oddities in the retail charts - specifically, in the bigger-name retail charts.
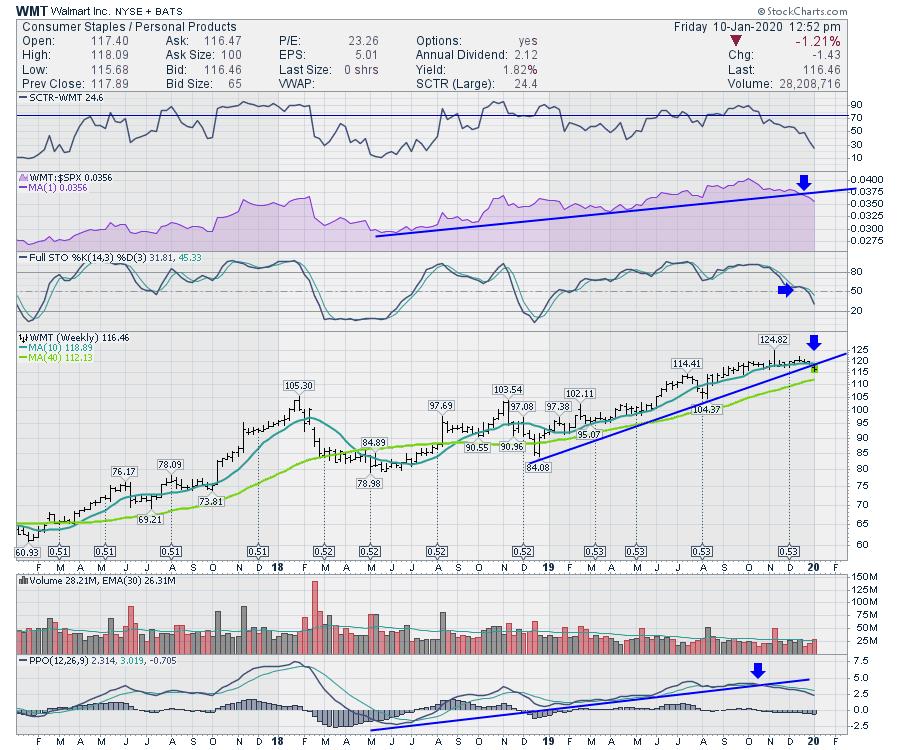
Here is Walmart (WMT). This chart has kicked off all kinds of sell signals. If the overall market was going to correct and investors started hunting for companies with free cash flow, I would expect a move back into Walmart before the PPO goes below zero. Walmart followed the market lower in January 2018 and September 2018, so it's not as defensive as I might have expected. Both Walmart drops were around 20%.
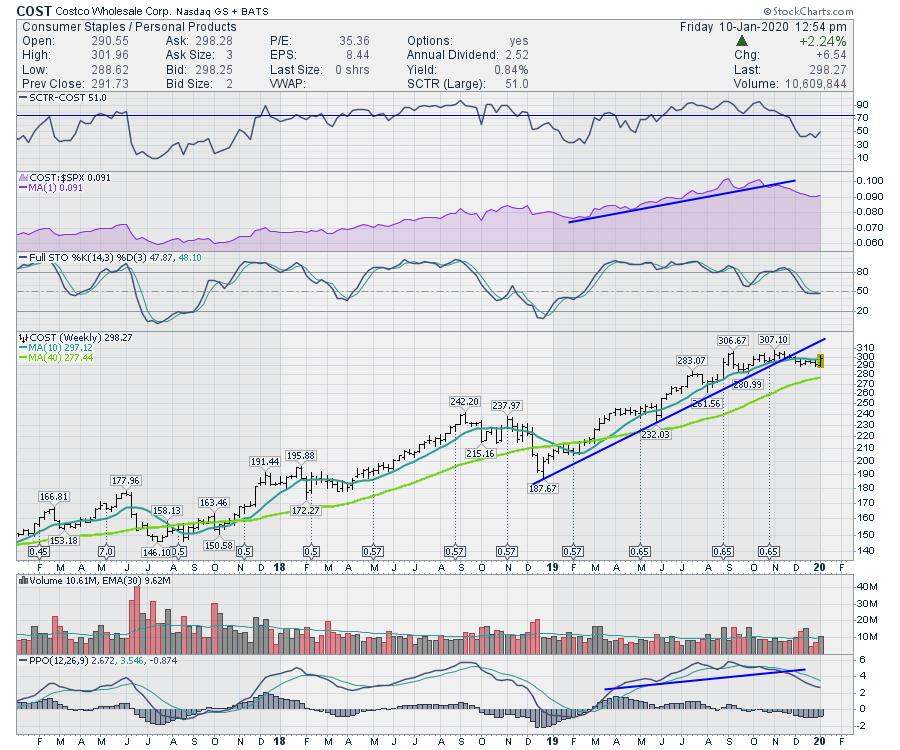
Costco (COST) has not fallen as hard as Walmart. The full stochastic is holding around 50. Bull markets trends usually turn up or resume around the 50 level. Walmart has already broken down from there, but the Costco full stochastic is intact so far. Costco was not as volatile as the market in the major drop in 2018, so can we call it more defensive? Slightly, but it still warrants caution with the stretched indexes.
Target (TGT) has the best chart shape so far as it just keeps extending to the upside. A few trend changes are starting to show up for me. For example, the relative strength trend in purple is starting to wobble below the line. Another is the strong PPO uptrend, which is currently breaking a year-long momentum uptrend on the PPO. Both of those changes suggest caution, especially in light of the two charts above.
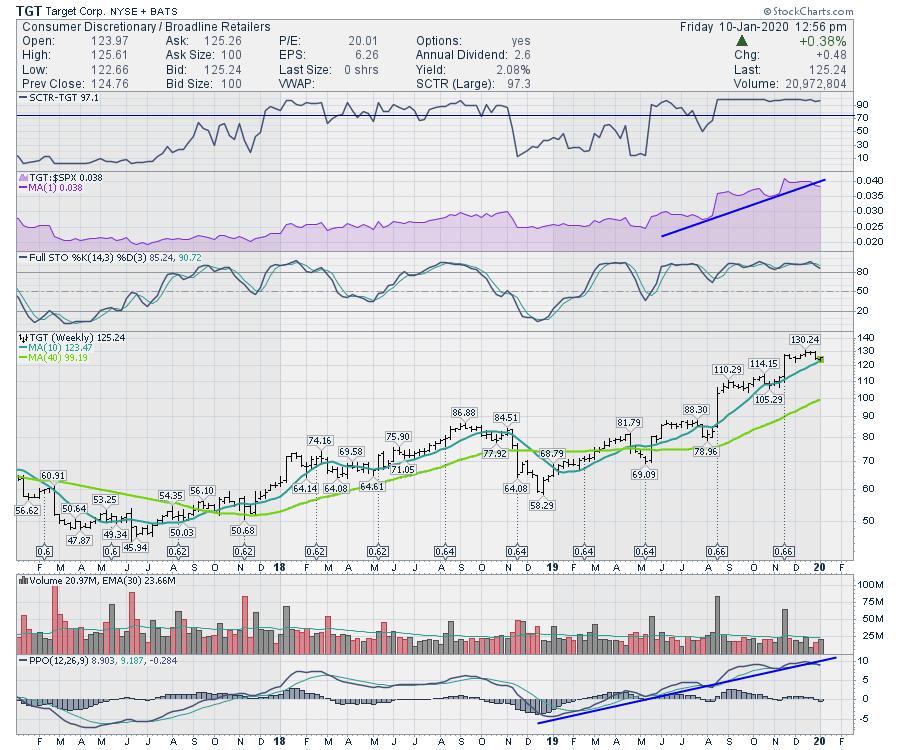
Normally, retail charts run up through to March. These charts need to start improving technically for investors to reap the same typical trend. That suggests a need to watch them closely for improving clues.
I covered off the top 30 retail stocks on the Friday (January 10th) edition of Market Buzz.
Indexes are Stretched
Have a good weekend!
|
| READ ONLINE → |
|
|
|
| The Traders Journal |
| Do You Use The "Krauthammer Conjecture" To Improve Your Sell Discipline? |
| by Gatis Roze |

I know a majority of my fellow investors are also ardent sports fans who live-a-little or die-a-little with each win or loss by their respective team. The parallels to investing are self-evident. Afterall, our portfolios of equities are our teams as well.
According to the Krauthammer Conjecture, "the pleasure of winning is less than the pain of losing". In his final book published posthumously, Charles Krauthammer put forth a number of sports examples to illustrate this point. As both a serious investor and an avid sports fan, I concur wholeheartedly. This is precisely why my foremost concern is always how to avoid the pain before I focus on the profits. Where do I set my stops before I calculate potential upside targets? I want to know my exit strategies even before I ever enter a trade. These are my rules. Read the Market Wizards books and you'll see most investment gurus affirming this discipline.
Charles Krauthammer uses LeBron James as one of his examples to illustrate that nothing matches the depth of emotions brought on by losing. Remember when the Cleveland Cavaliers lost the 2015 NBA finals to the Golden State Warriors? LeBron sat motionless on the bench staring straight ahead — still in his jersey — for 45 minutes after the game. Similarly, for every profit in the market or every win on a sports field, there are unequal and opposite feelings of loss and intense despair on the other side.
My point being that we each must understand the calculus between profit and pleasure versus pain and loss. It's essential to personally acknowledge this imbalance. Use this pleasure / pain calculus to motivate your Investor Self and to embrace and follow your sell disciplines.
In closing, I'd like to refer you to two previous Traders Journal blogs that I've written on this topic. Hopefully, this will empower you further with the emotional discipline to become a consistently profitable investor.
1 – The Art of Selling Well
2 – My Selling Methodology
Trade well; trade with discipline!
- Gatis Roze, MBA, CMT
StockMarketMastery.com
|
| READ ONLINE → |
|
|
|
| DecisionPoint |
| This Chart Suggests Rally Should Continue in the Very Short-Term |
| by Erin Swenlin |
This is an excerpt from yesterday's DecisionPoint Alert [with updated comments & charts]. If you'd like to subscribe to DecisionPoint.com's DP Alert, click here! You can also join our free newsletter list here!
One of my favorite indicators is the 10-DMA of the High-Low Differential, which is on our ST New Highs/New Lows chart. This chart is available to all DecisionPoint.com members in the "DecisionPoint Alert ChartList" with annotations. [If you are an Extra member of StockCharts, you can find the charts (minus annotations) in the free DecisionPoint Market Indicator ChartPack.] New Highs continued to expand for the fourth day in a row [on Thursday]. I noticed that we have a defined bottom on the H-L Differential; these indicator bottoms are generally right on the money. Tops on this indicator are fairly good determinants of a downturn as well. We've watched negative divergences in play before, but, with Thursday's reading, I'm seeing a confirmation as readings are rising.
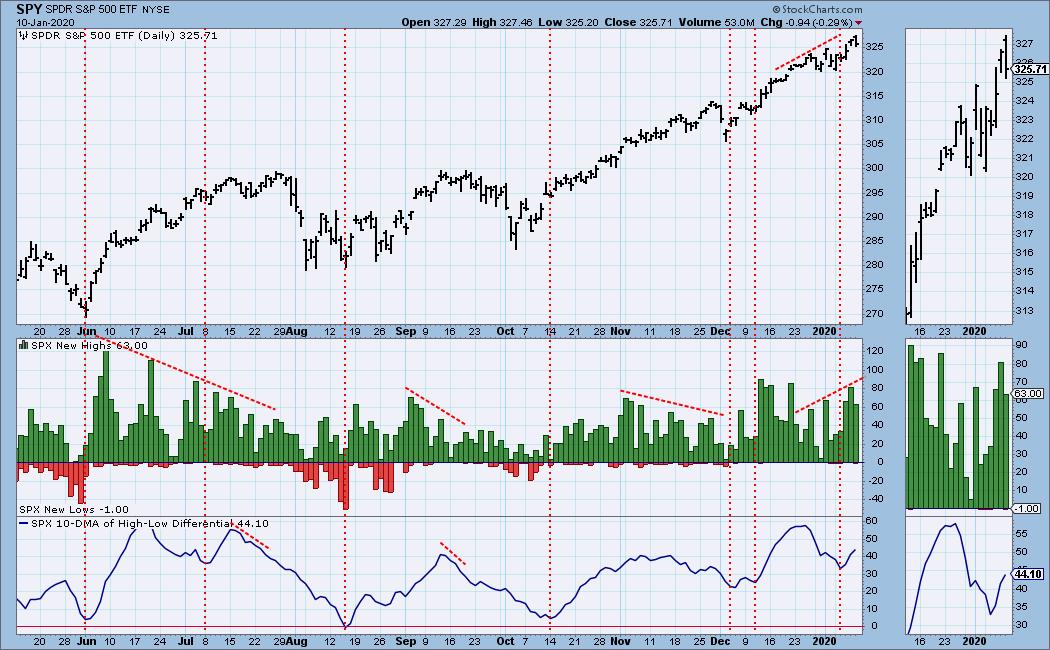
Watch the latest episode of DecisionPoint on StockCharts TV's YouTube channel here!
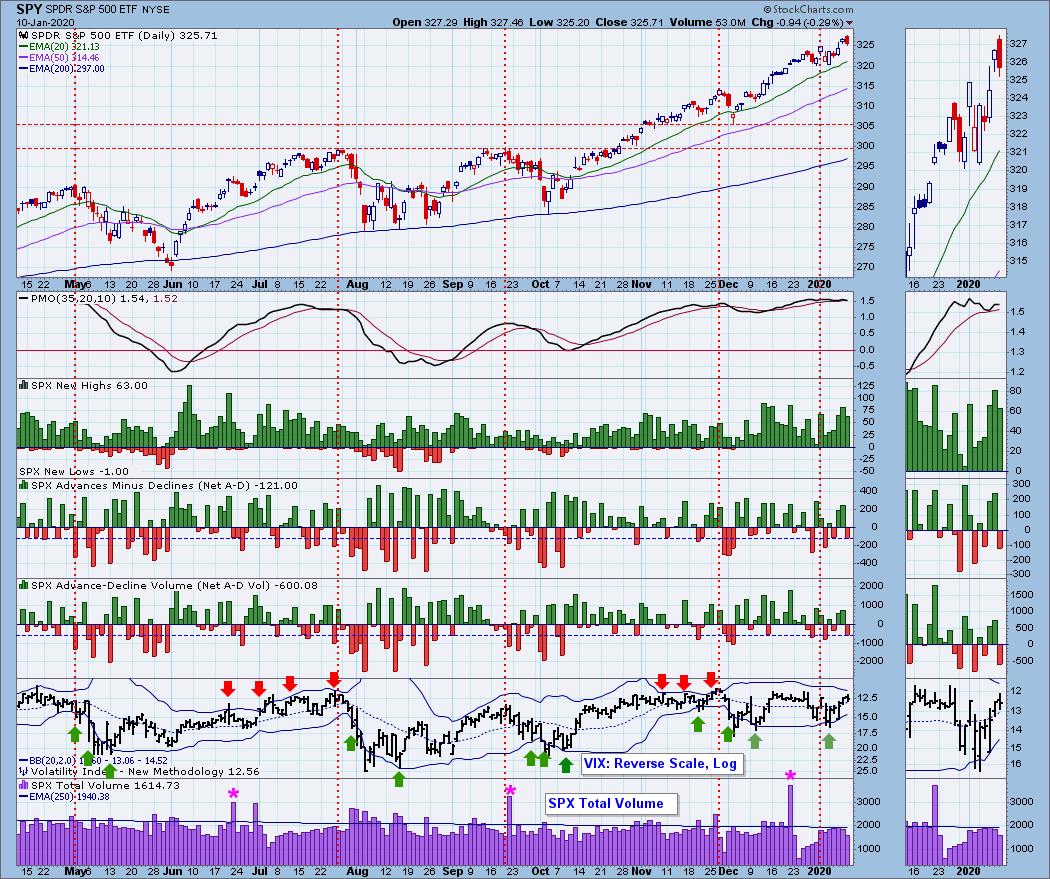
Climactic Market Indicators: New Highs are rising, as I noted in my opening, and are reaching heights that suggest short-term strength and a rally continuation. Breadth readings weren't climactic [yesterday nor] today. [We saw negative breadth readings, but nothing climactic. I also find it positive that volume contracted on today's decline.] The VIX has gotten above the moving average on the inverted scale, which also suggests short-term strength. [A note of caution is that we are seeing the Bollinger Bands squeezing. We saw this in July and again in November right before the corrections.]
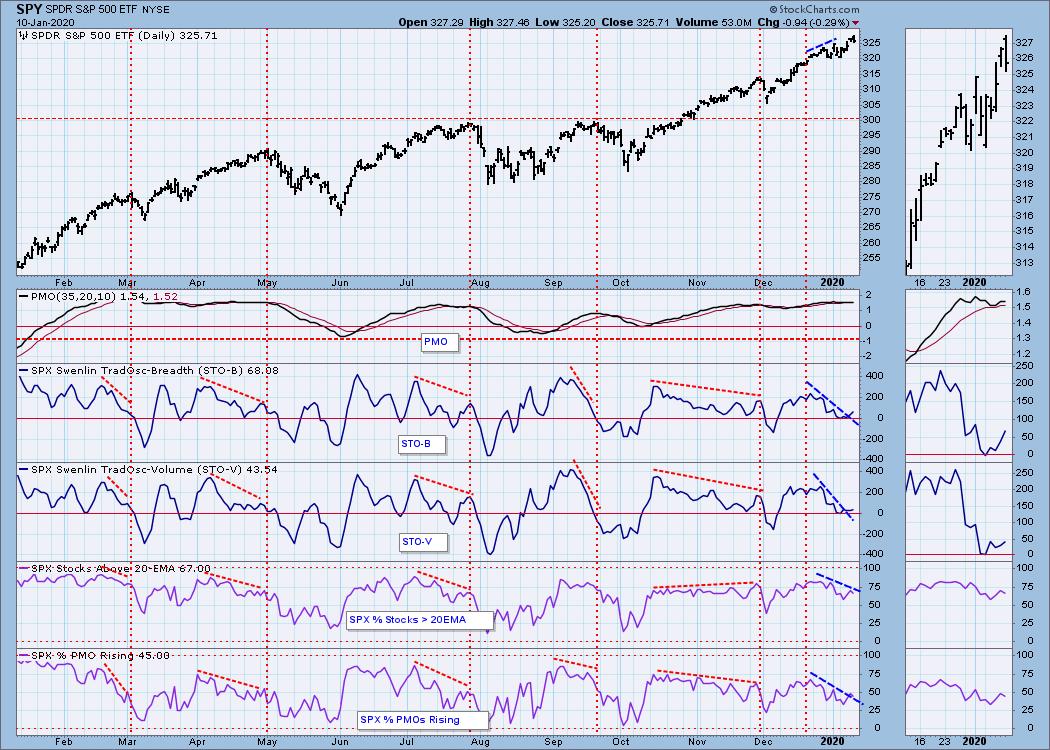
Short-Term Market Indicators: The STOs are breaking out of their declining trends. Oscillation above the zero line is bullish, suggesting internal strength. I'm relieved to see the %stocks above their 20/50-EMAs is improving. This tells me that we could be seeing the beginning of broader participation. [However, Carl wrote today in his "DP Weekly Wrap" that negative divergences are still in play, so be alert!]
CONCLUSION: I talked to my friend and fellow analyst Mary Ellen McGonagle (MEM Investment Research) about the drop off at the end of the close [on Wednesday] - she told me it had more to do with missiles and not a crisis of confidence. She remains very bullish. Yesterday's market action, along with the reversal on some of our indicators, has me more bullish. [Carl isn't convinced just yet and made some great points in today's Weekly Wrap (DP subscribers: MUST READ). The market remains overbought and, while some of our indicators are turning in the right direction, our intermediate-term indicators are not ideal. My final comment is that overbought conditions can persist, but the ice could get thin.]
Technical Analysis is a windsock, not a crystal ball.
Happy Charting! - Erin
Email: erin@decisionpoint.com

Erin Swenlin will be presenting at the The MoneyShow Las Vegas May 11-13, 2020! You'll have an opportunity to meet Erin and discuss the latest DecisionPoint news and Diamond Scans. The conference is free to attend or view online!
Helpful DecisionPoint Links (Can Be Found on the DecisionPoint.com Links Page):
Erin's PMO Scan
DecisionPoint Shared ChartList and DecisionPoint Chart Gallery
Trend Models
Price Momentum Oscillator (PMO)
On Balance Volume
Swenlin Trading Oscillators (STO-B and STO-V)
ITBM and ITVM
SCTR Ranking
|
| READ ONLINE → |
|
|
|
| SPECIAL EVENT ANNOUNCEMENT |
| Don't miss your chance to hear David Keller, Chief Market Strategist at StockCharts.com! David will be a featured presenter at the upcoming Orlando MoneyShow conference, February 6th - 8th. The event is free to register and attend, and you'll have the chance to hear David speak alongside a long list of other industry legends and market experts. Click the banner below to learn more. |
 |
| LEARN MORE → |
|
| ChartWatchers |
| Get Ready - Earnings Season Ready to Kick into High Gear |
| by John Hopkins |
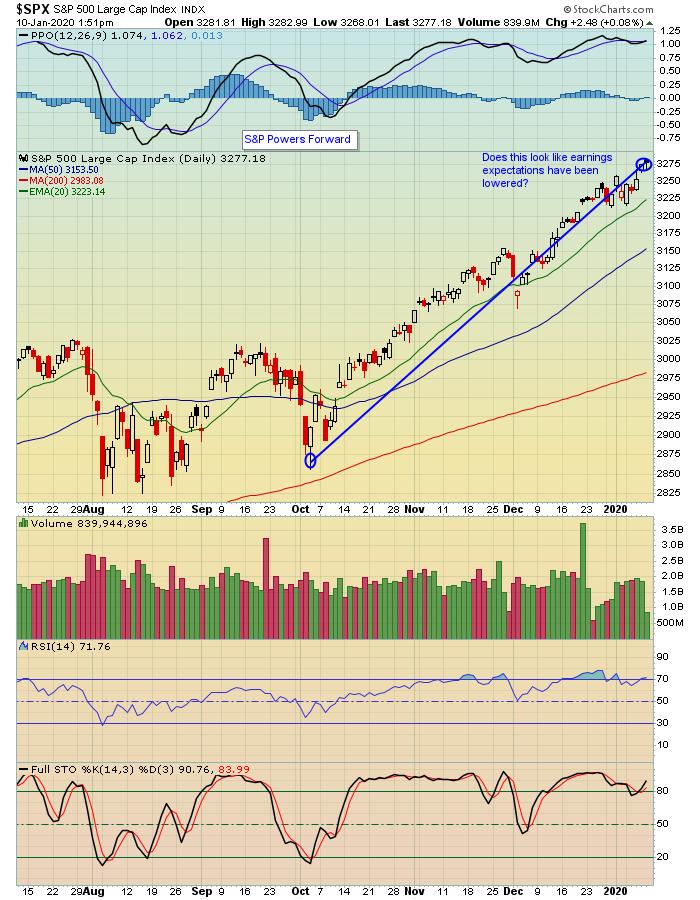
Most of the talking heads on TV have gone out of their way to indicate that analysts have lowered their expectations for Q4 earnings. Given the way the market has powered forward with a new year underway, one can only imagine what the S&P might look like if these analysts are right - or wrong.
Take a look at the chart below, which shows that the S&P has moved higher almost non-stop since the October 3 low, with one minor correction in November that lasted for about 3 days. Since that October 3 low, the S&P has risen by 15%. That doesn't look like a chart that says earnings could disappoint.
The good news is we don't have to wait much longer to get a first glimpse at earnings, with Citigroup (C), JP Morgan (JPM) and Wells Fargo (WFC) set to report their numbers next Tuesday and thousands of companies set to report over the next several weeks. As the beginning of earnings season is upon us, we should see some great opportunities to zero in on those stocks that could present high reward-to-risk opportunities.
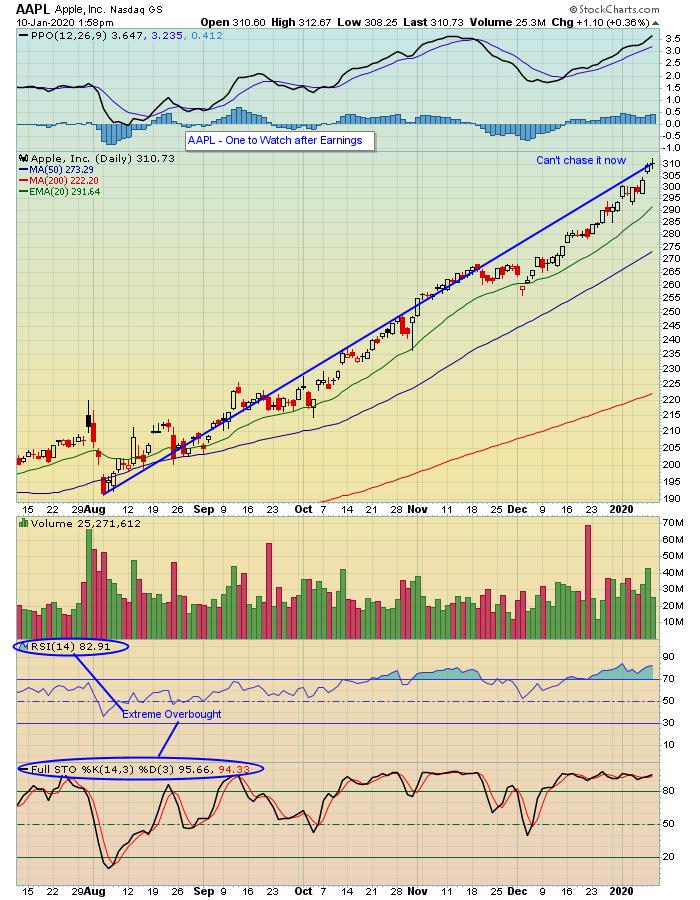
For example, look at the chart on Apple below, a stock that has been at the forefront of the market's march higher. Would I buy AAPL at these lofty levels? Not a chance. But once AAPL reports its earnings - and especially if it beats expectations and does correct in some fashion - at some point, it could be a stock that will continue to attract buyers. I just would like to get it cheaper!
In fact, we've scheduled two webinars set to take place over the next few weeks, which will focus specifically on Q4 earnings - what to expect, which stocks could soar and which stocks could pull back significantly once they report their numbers. Prior to those two events, we'll be conducting a special webinar this Monday, January 13 with the topic being "The January Effect." Very timely! In addition, EarningsBeats.com Chief Market Strategist Tom Bowley will be unveiling his Top 15 Stocks for 2020. This will be a members-only event, so if you are interested in learning more and how you can attend for FREE, just click here.
At your service,
John Hopkins
EarningsBeats.com
|
| READ ONLINE → |
|
|
|
|
|
| MORE ARTICLES → |
|


 Ten of the eleven sector SPDRs are positive over the last three months. The Real Estate SPDR (XLRE) is the only sector sporting a loss (~.75%), but I am not concerned with relative weakness because the price chart looks bullish overall. Note that XLRE was the leading sector in early September with the biggest year-to-date gain at the time. It basically moved from leader to laggard over the last three months. Can it move back to leader? Let's check the chart.


