This is an excerpt from yesterday's DecisionPoint Alert [with updated comments & charts]. If you'd like to subscribe to DecisionPoint.com's DP Alert, click here! You can also join our free newsletter list here!
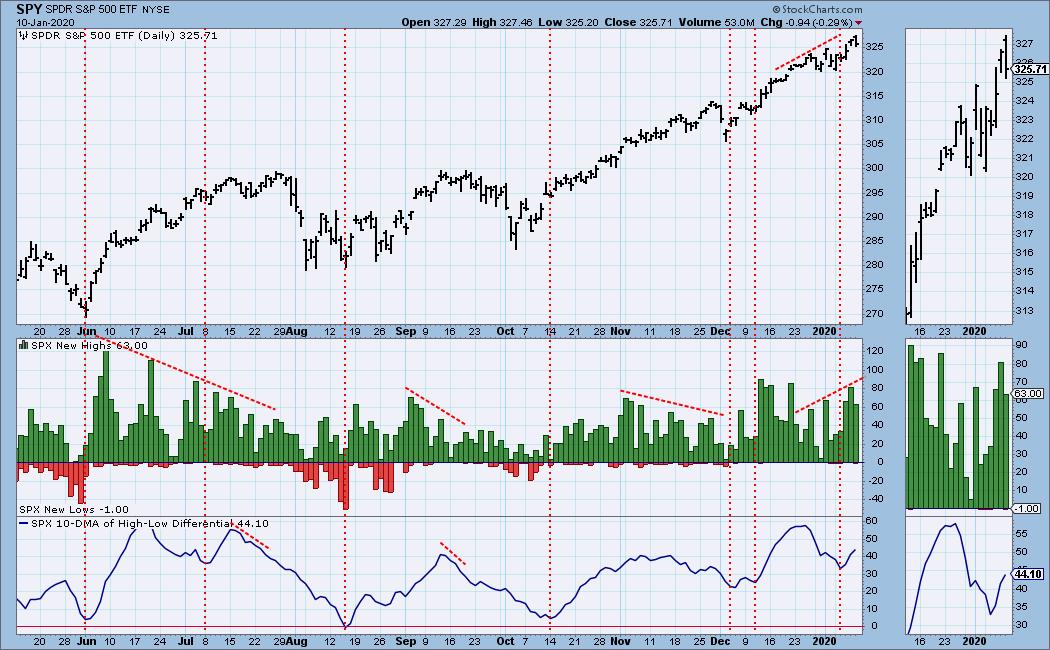
One of my favorite indicators is the 10-DMA of the High-Low Differential, which is on our ST New Highs/New Lows chart. This chart is available to all DecisionPoint.com members in the "DecisionPoint Alert ChartList" with annotations. [If you are an Extra member of StockCharts, you can find the charts (minus annotations) in the free DecisionPoint Market Indicator ChartPack.] New Highs continued to expand for the fourth day in a row [on Thursday]. I noticed that we have a defined bottom on the H-L Differential; these indicator bottoms are generally right on the money. Tops on this indicator are fairly good determinants of a downturn as well. We've watched negative divergences in play before, but, with Thursday's reading, I'm seeing a confirmation as readings are rising.

Watch the latest episode of DecisionPoint on StockCharts TV's YouTube channel here!
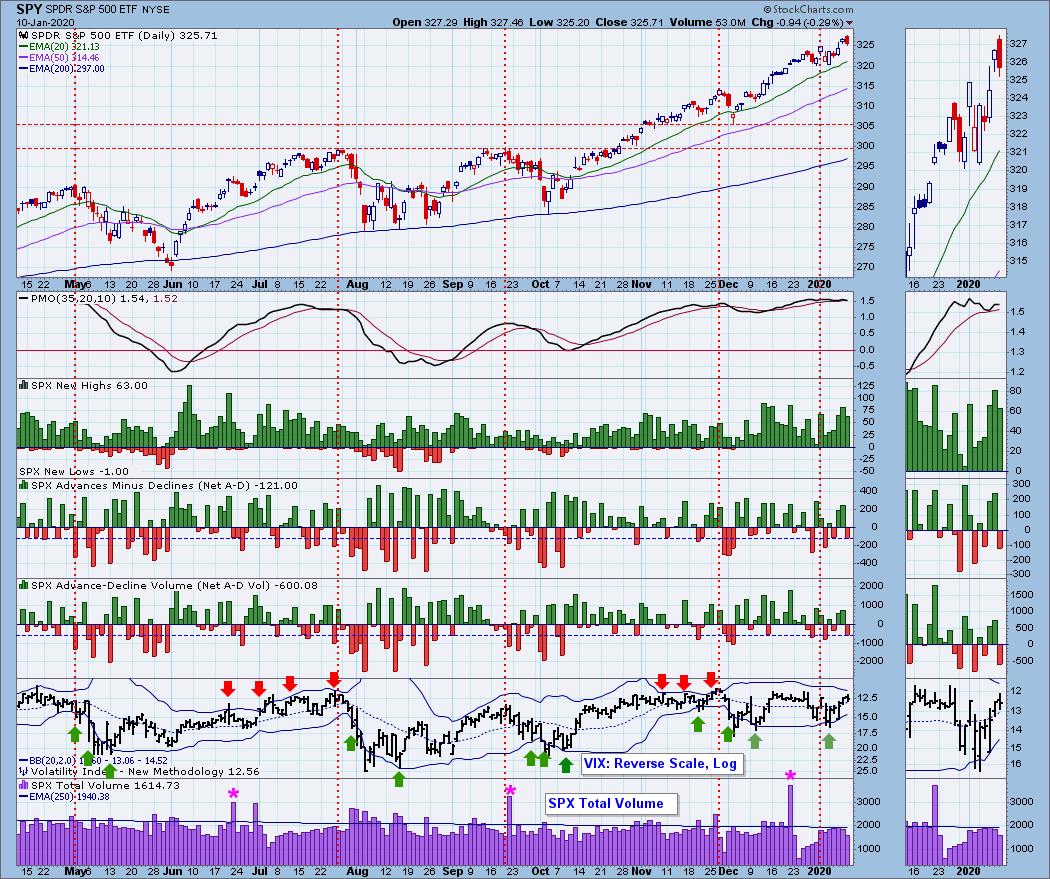
Climactic Market Indicators: New Highs are rising, as I noted in my opening, and are reaching heights that suggest short-term strength and a rally continuation. Breadth readings weren't climactic [yesterday nor] today. [We saw negative breadth readings, but nothing climactic. I also find it positive that volume contracted on today's decline.] The VIX has gotten above the moving average on the inverted scale, which also suggests short-term strength. [A note of caution is that we are seeing the Bollinger Bands squeezing. We saw this in July and again in November right before the corrections.]

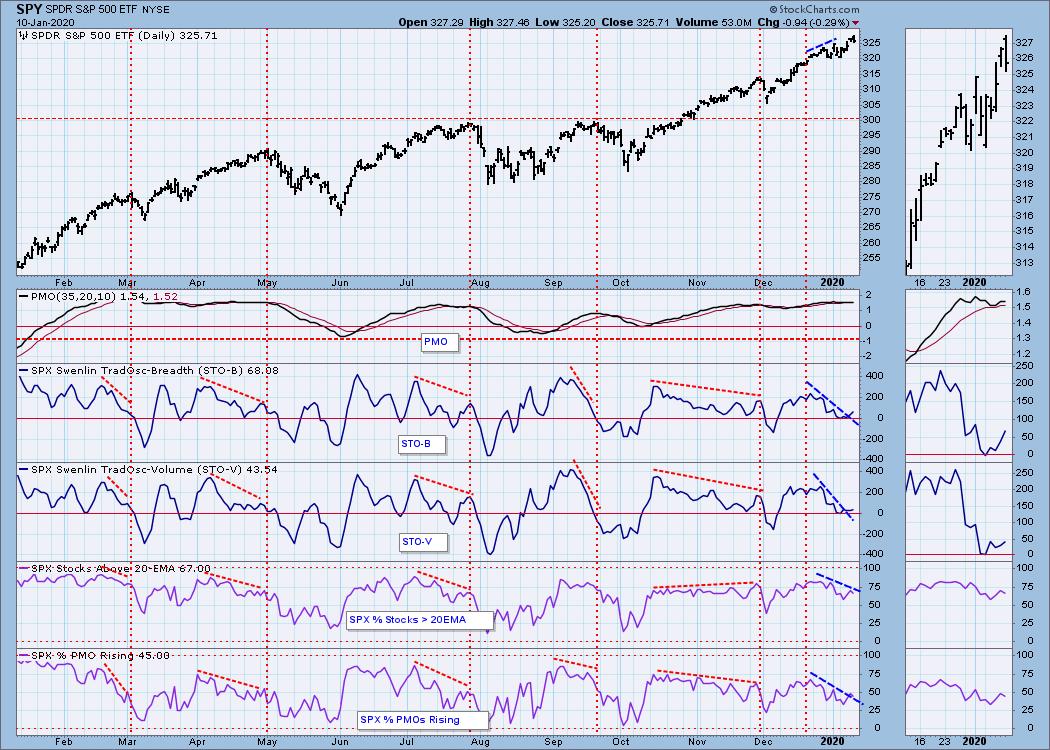
Short-Term Market Indicators: The STOs are breaking out of their declining trends. Oscillation above the zero line is bullish, suggesting internal strength. I'm relieved to see the %stocks above their 20/50-EMAs is improving. This tells me that we could be seeing the beginning of broader participation. [However, Carl wrote today in his "DP Weekly Wrap" that negative divergences are still in play, so be alert!]

CONCLUSION: I talked to my friend and fellow analyst Mary Ellen McGonagle (MEM Investment Research) about the drop off at the end of the close [on Wednesday] - she told me it had more to do with missiles and not a crisis of confidence. She remains very bullish. Yesterday's market action, along with the reversal on some of our indicators, has me more bullish. [Carl isn't convinced just yet and made some great points in today's Weekly Wrap (DP subscribers: MUST READ). The market remains overbought and, while some of our indicators are turning in the right direction, our intermediate-term indicators are not ideal. My final comment is that overbought conditions can persist, but the ice could get thin.]
Technical Analysis is a windsock, not a crystal ball.
Happy Charting! - Erin
Email: erin@decisionpoint.com

Erin Swenlin will be presenting at the The MoneyShow Las Vegas May 11-13, 2020! You'll have an opportunity to meet Erin and discuss the latest DecisionPoint news and Diamond Scans. The conference is free to attend or view online!
Helpful DecisionPoint Links (Can Be Found on the DecisionPoint.com Links Page):
DecisionPoint Shared ChartList and DecisionPoint Chart Gallery
Price Momentum Oscillator (PMO)
Swenlin Trading Oscillators (STO-B and STO-V)


