It has been a 10-year parade of improving jobs numbers; naturally, December was no different. There was lots of rhetoric about one level vs. the other, but overall it was hardly a worrisome report. Canada improved this month, but last month was the worst jobs report since 2009. That's the kind of data change that gets a second look! With that as a comparison, the USA jobs number looks great.
So, as I scrolled through some of the S&P 500 charts while (not) binge-watching Netflix shows with my wife, I noticed a few oddities in the retail charts - specifically, in the bigger-name retail charts.
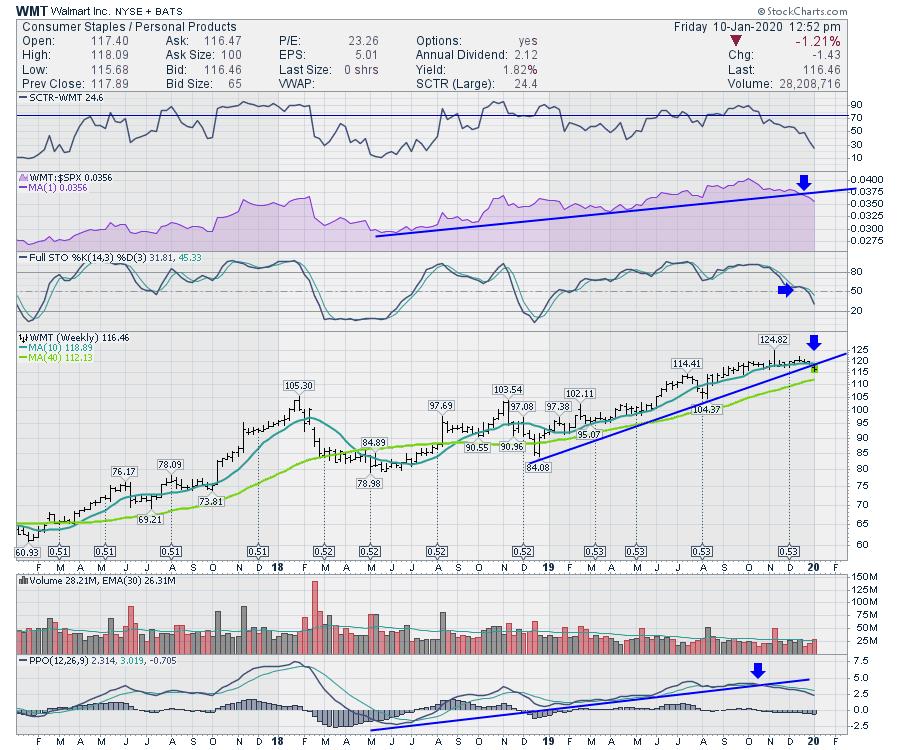
Here is Walmart (WMT). This chart has kicked off all kinds of sell signals. If the overall market was going to correct and investors started hunting for companies with free cash flow, I would expect a move back into Walmart before the PPO goes below zero. Walmart followed the market lower in January 2018 and September 2018, so it's not as defensive as I might have expected. Both Walmart drops were around 20%.
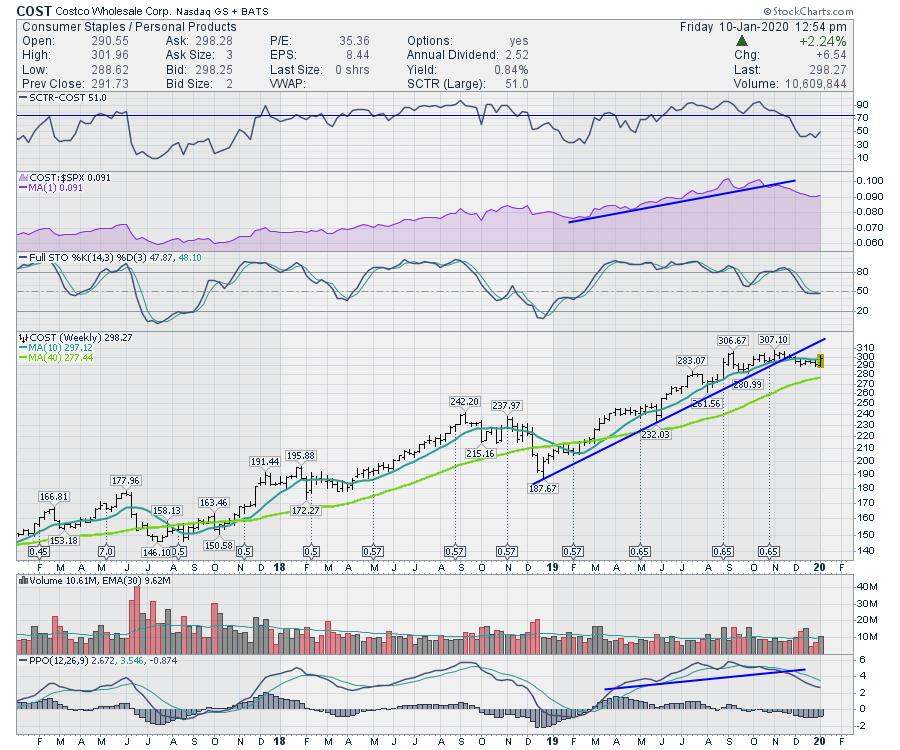
Costco (COST) has not fallen as hard as Walmart. The full stochastic is holding around 50. Bull markets trends usually turn up or resume around the 50 level. Walmart has already broken down from there, but the Costco full stochastic is intact so far. Costco was not as volatile as the market in the major drop in 2018, so can we call it more defensive? Slightly, but it still warrants caution with the stretched indexes.
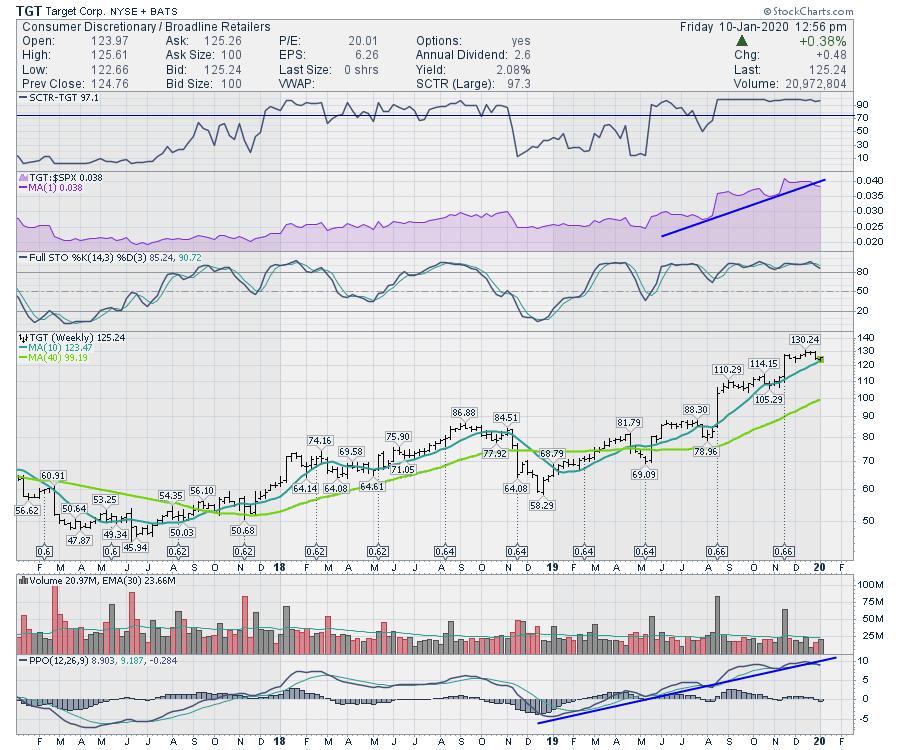
Target (TGT) has the best chart shape so far as it just keeps extending to the upside. A few trend changes are starting to show up for me. For example, the relative strength trend in purple is starting to wobble below the line. Another is the strong PPO uptrend, which is currently breaking a year-long momentum uptrend on the PPO. Both of those changes suggest caution, especially in light of the two charts above.
Normally, retail charts run up through to March. These charts need to start improving technically for investors to reap the same typical trend. That suggests a need to watch them closely for improving clues.
I covered off the top 30 retail stocks on the Friday (January 10th) edition of Market Buzz.
Indexes are Stretched
Have a good weekend!
Good trading,
Greg Schnell, CMT, MFTA
Senior Technical Analyst, StockCharts.com
Author, Stock Charts For Dummies
Want to stay on top of the market's latest intermarket signals?
– Follow @SchnellInvestor on Twitter
– Connect with Greg on LinkedIn
– Subscribe to The Canadian Technician
– Email at info@gregschnell.com


