| THIS WEEK'S ARTICLES |
| John Murphy's Market Message |
| THE NASDAQ SHOWS RELATIVE WEAKNESS AND MAY HOLD KEY TO MARKET DIRECTION |
| by John Murphy |
THE NASDAQ REMAINS IN SHORT-TERM DOWNTREND... The tech-dominated Nasdaq market continues to show relative weakness. Chart 1 shows the Nasdaq Composite trading well below its 50-day average and in a short-term downtrend. Prices are attempting a rebound today from yesterday's heavy selling. If that low doesn't hold, the next level of potential support lies along its March reaction lows and its 200-day moving average. The Dow and S&P 500 have held up much better and remain above their 50-day lines.
NASDAQ RELATIVE WEAKNESS... Chart 2 plots a ratio of the Nasdaq divided by the S&P 500 which has fallen to the lowest level since last June. It's pretty hard for the rest of the market to ignore that level of relative weakness. A lot of that relative weakness, however, reflects rotation out of growth stocks into more value-oriented cyclical stocks.
 Chart 1 Chart 1
 Chart 2 Chart 2
S&P 500 BOUNCES OFF 50-DAY LINE...Chart 3 shows the S&P 500 bouncing today off its 50-day moving average. Prices are rebounding today despite higher than expected producer prices for April. Yesterday's surprisingly high consumer price report pushed stocks sharply lower. It remains to be seen if stocks can build on today's buying.
 Chart 3 Chart 3
|
| READ ONLINE → |
|
|
|
| ChartWatchers |
| Dead Cat Bounce on S&P 500? |
| by David Keller |
When a market makes a quick move lower from an established peak, then quickly rebounds back to the upside, you will hear the dreaded phrase "dead cat bounce" emerge on trading floors. What is this pattern, and what can it tell us about next steps for the S&P 500?
Basically, the phrase is a somewhat vulgar way to imply a market that is bouncing after a first move down, but, overall, the swing higher is not a sign of a life but simply the market's involuntary rise after a quick drop.
Royal Caribbean (RCL) provides a pretty good example of this pattern in mid-2020.
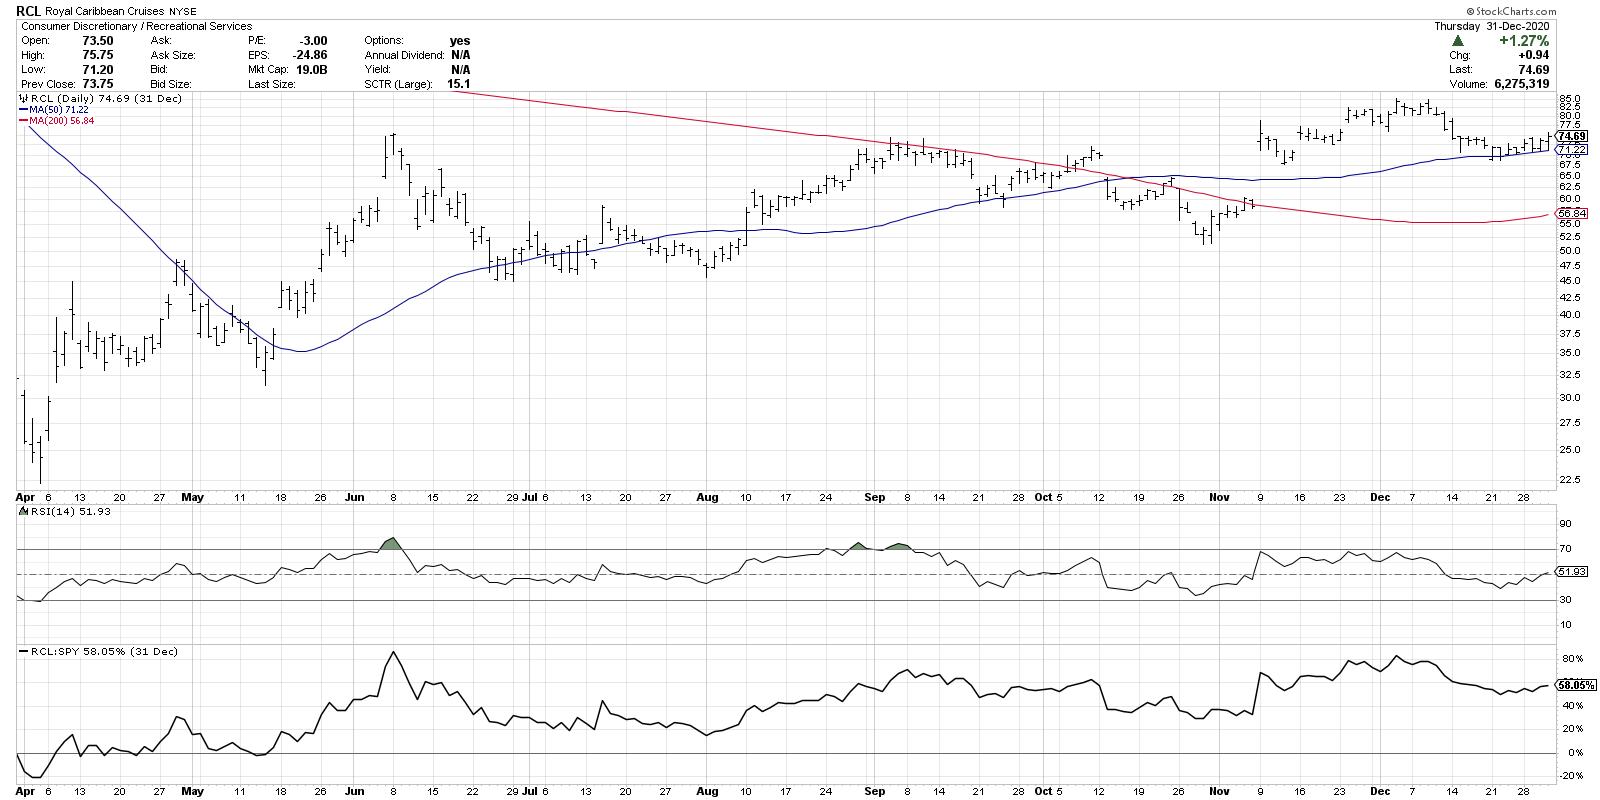
After moving from the low 20s to the upper 70s in early June, RCL gapped up in one final push higher. Notice how that last move higher included a number of topping signals, including an exhaustion gap (a gap higher after an extended uptrend), a dragonfly doji candle (open and close even with no upper shadow and a long lower shadow) and the RSI in the overbought range. Following this confluence of topping signals, RCL traded down heavily in what appeared to be a clear distribution move after the long uptrend. Three days later, the stock jumped higher in reaction to the initial selloff.
The initial selloff from the highs tells you of an exhaustion of buyers. The quick bounce higher is considered the "disbelief" phase, where buyers are sucked in on the assumption that they've bought on the dip and are prepared to ride the price back to new highs.
So what confirms this dead cat bounce? Once the stock continued its downtrend, signaling that upside is limited and downside potential has increased, investors get nervous and start to sell. This causes further downward pressure and a feedback loop that pushes prices down even more.
In this case, the downside was relatively limited. The stock found support around the 50-day moving average, but never traded below that support level in the weeks to come. That serves as a solid reminder to always look to key support and resistance levels during periods of market dislocation.
Now let's review the current S&P 500 chart.
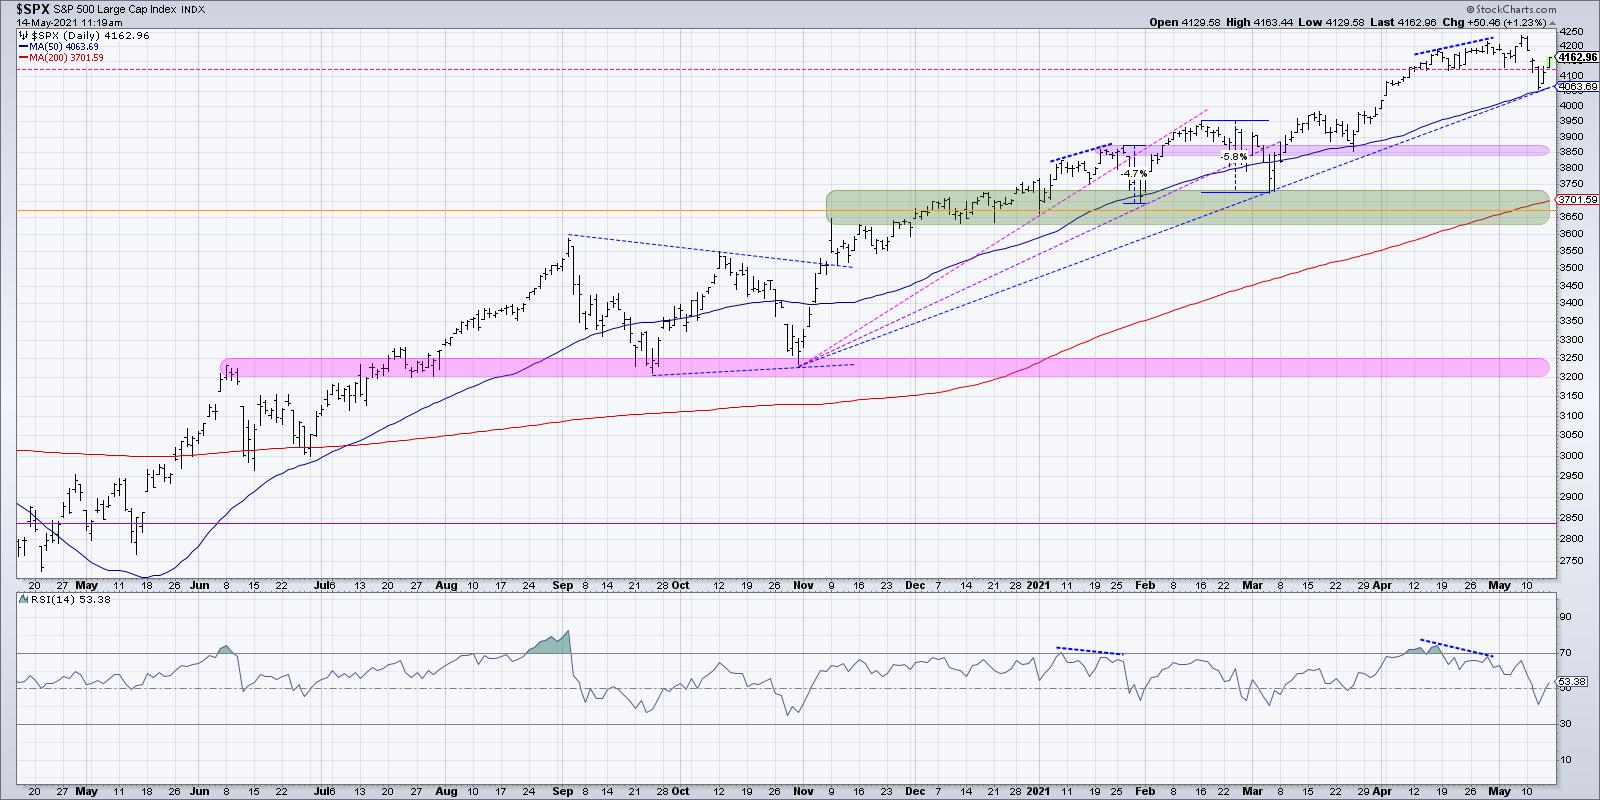
Wednesday's selloff this week brought the S&P quickly down to the 50-day moving average, bringing the index about 5% below its recent all-time highs. This is about the same pullback that we saw in January, coincidentally, after a similar bearish momentum divergence. After trading down to the 50-day moving average as well as clear trendline support, the S&P bounced higher on Thursday, then really followed through to the upside on Friday.
Investors have clearly bought into the "buy the dip" strategy, and Friday's rally seems to indicate the disbelief mindset often seen after an initial selloff from a market peak.
What would confirm the dead cat bounce thesis? Quite simply, a break below the 50-day moving average and trendline support would indicate that Friday's rally was a reaction move within a longer corrective period. This would also differentiate the current move from January's 5% selloff, drawing comparisons to deeper price/time corrections such as September/October 2020.
What would invalidate the dead cat bounce thesis? A move back to the 4200-4250 range early next week would certainly suggest that we have experienced yet another garden-variety pullback within an increasingly euphoric uptrend phase.
Either way, this week's increased volatility suggests investors are nervous about potential downside risk. At the same time, the fear of missing out appears alive and well!
Want to digest this article in video format? Here we go:
RR#6,
Dave
P.S. Ready to upgrade your investment process? Check out my free course on behavioral investing!
David Keller, CMT
Chief Market Strategist
StockCharts.com
Disclaimer: This blog is for educational purposes only and should not be construed as financial advice. The ideas and strategies should never be used without first assessing your own personal and financial situation, or without consulting a financial professional.
The author does not have a position in mentioned securities at the time of publication. Any opinions expressed herein are solely those of the author, and do not in any way represent the views or opinions of any other person or entity.
|
| READ ONLINE → |
|
|
|
|
|
| ChartWatchers |
| A Tech ETF Forming A Short-term Bullish Pattern within a Bigger Bullish Pattern |
| by Arthur Hill |
The Cybersecurity ETF (CIBR) was hit with the rest of the tech sector over the last few weeks, but it held the March lows and is on my radar as a possible triangle forms over the last few months. In particular, I am watching downswing within this triangle for early clues on bullish reversal. First, note that the long-term trend is up because CIBR is above its rising 200-day SMA. Otherwise, I would not even consider a bullish setup.
The chart shows CIBR hitting new highs in February and then correcting with a trading range the last three months. With a lower high and possible higher low, a triangle could be taking shape. Note that a triangle within an uptrend represents a consolidation or bullish continuation pattern. CIBR was quite overextended after the prior 42% advance and this triangle worked off these overbought conditions. A break above the upper line would end the consolidation and signal a continuation of the bigger uptrend.
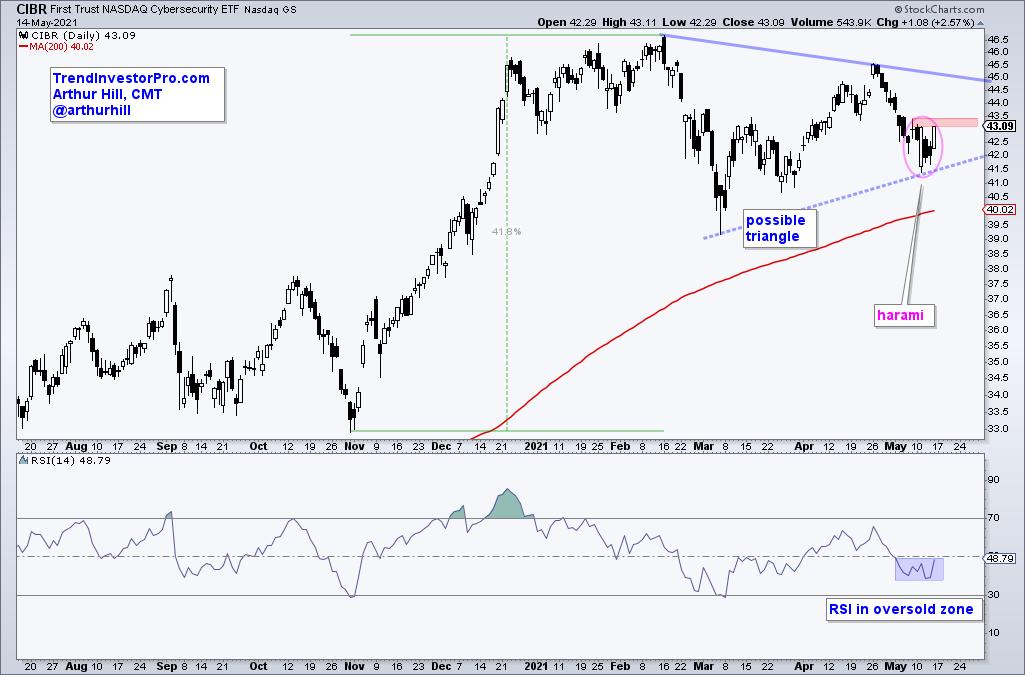
I do not want to wait for a break above the upper trendline so I am watching the swings within the triangle for a quicker jump. CIBR fell from late April to early May and the current swing is down. A harami formed on Tuesday-Wednesday with the long white candlestick and inside candle. After a few weeks of selling pressure, harami signal sudden indecision that can sometimes foreshadow a reversal. There was another inside candle on Thursday and nice bounce on Friday. A break above 43.5 would fully reverse the downswing within the triangle and provide the first sign that a bigger breakout is in the making.
Covering over 200 names in our master ETF chartlist, TrendInvestorPro specializes in finding bullish setups within bigger uptrends. This week are looking at the Airline ETF, China Financials ETFs and a few others setting up. Click here for immediate access to our reports, videos and ETF ranking table.
---------------------------------------------
|
| READ ONLINE → |
|
|
|
|
|
| The Traders Journal |
| An 18-Year Living Investment Experiment And Its Most Impactful Conclusions |
| by Gatis Roze |
 Last month, Grayson and I had the pleasure of Zooming online to a combined audience of both the Los Angeles and San Diego chapters of the AAII. Our investment talk to this significant group of investors was presented in three distinct pods of investment strategy and money management topics. It was, in essence, a summary of an 18-year "living investment experiment" – one that began when Grayson was 10 years old. Last month, Grayson and I had the pleasure of Zooming online to a combined audience of both the Los Angeles and San Diego chapters of the AAII. Our investment talk to this significant group of investors was presented in three distinct pods of investment strategy and money management topics. It was, in essence, a summary of an 18-year "living investment experiment" – one that began when Grayson was 10 years old.
At that time, I was teaching weekly investment courses here in the Puget Sound area, and I had him step up in front of my students to demonstrate how to draw trendlines on stock charts. Now, 18 years later, the experiment continues to yield fruitful insights. Judging by the very positive responses from the AAII attendees that joined us online, we've decided to make our presentation available to everyone via YouTube.
POD 1
The Most Impactful Investing Lessons I Taught My Son
In the first part of our talk, I discuss the most important and impactful investing tools that I've given my son over the past 18 years. In full disclosure, I acknowledge that it's hardly been a one-way transfer. Over the intervening years, a great deal has flowed from son to father as well. In this pod, I delve into specific tools, skills and routines, but I also discuss the motivation, action and importance of understanding the Investor Self for younger investors. There's also a portion detailing common investor blunders and how best to avoid these financial potholes.
POD 2
It Pays To Be Young: How To Turn Your Age Into Profits
In the next part of our talk, Grayson details the many unique advantages that young investors have in today's market. He digs deep into the specifics of turning those advantages into profits, and shares exactly how he manages his own money as a younger investor in his late 20s. His presentation includes timely examples to illustrate those concepts and philosophies.
POD 3
Passing The Financial Baton, But Investing Together
In the final pod, Grayson and I both speak together about mutual and respective lessons learned over these past 18 years of actively investing in the markets alongside each other. This includes penetrating reflections on our journey as father and son, as co-authors and as modern investors in today's day and age.
In sharing this candid conversation with a wider audience beyond the AAII, we are endeavoring to negate the old Chinese proverb that claims, "wealth does not pass three generations".
Here's our attempt to prove that wrong!
Trade well; trade with discipline!
- Gatis Roze, MBA, CMT
StockMarketMastery.com
|
| READ ONLINE → |
|
|
|
| ChartWatchers |
| Gold Names Firm Up to 3-Month Highs |
| by Greg Schnell |
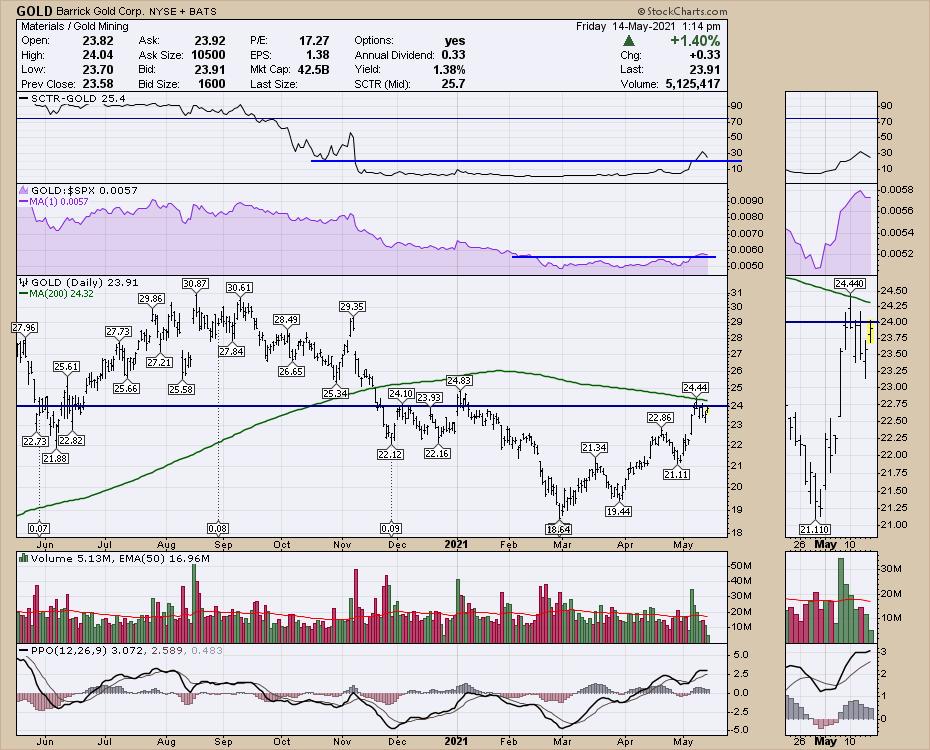
I fired through some scans this morning and only one Gold name popped up. Then, after I altered my scan criteria slightly, a plethora of nice setups showed up. In a few weeks, StockCharts will have some new shows regarding scanning. Scanning alerts you to names you might not be watching; it is truly the gem for investing technically.
Here is Barrick Gold (GOLD). I like the price bull flagging at $24. A push to $25 puts it at 6-month highs and highs for 2021; it would also pop above the 200-DMA. The SCTR is lifting off the bottom. That is one of my favorite setups, especially in the commodity-related trades.
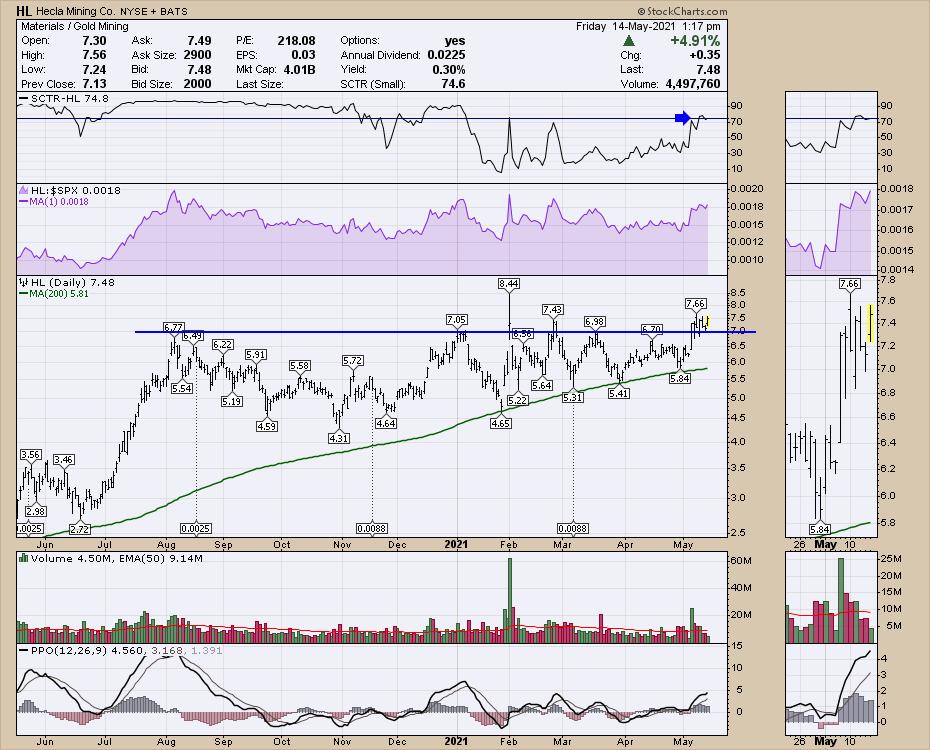
Hecla Mining (HL) is an even stronger setup. Other than the February spike, this chart is at the highs.
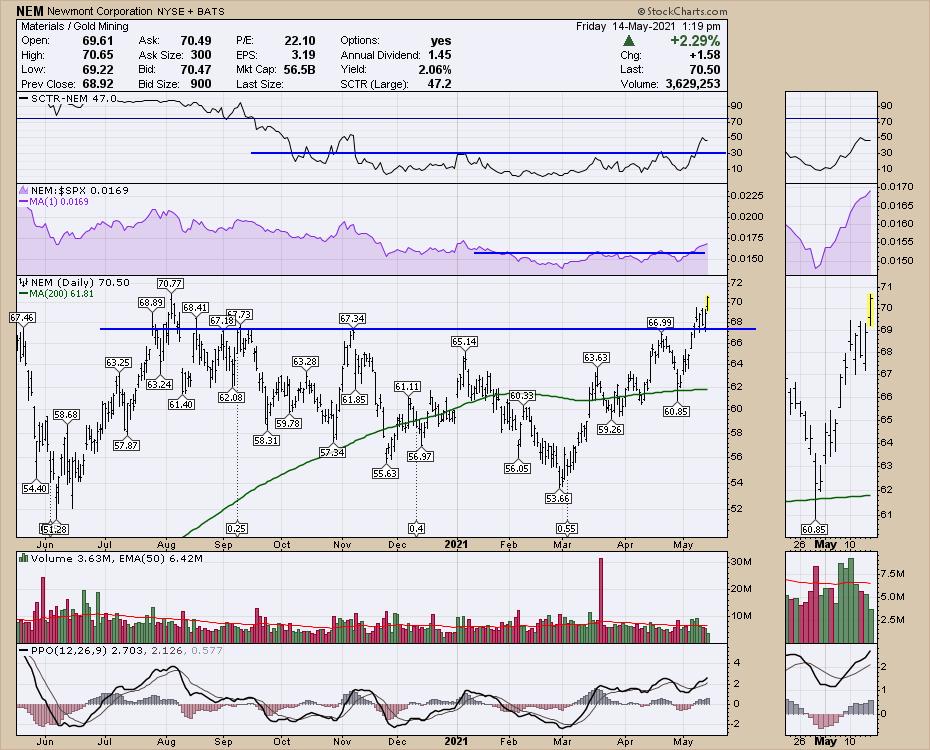
I was buying Gold names on Friday. This Newmont (NEM) mining chart was one of them. Normally, I buy after I publish an article, but I wasn't planning on writing about Gold stocks for the ChartWatchers article today!
Relative strength is at new 3-month highs and the SCTR is popping above 25. Price is very close to taking out August 2020 highs, and the PPO (momentum) is at the highest level since the August peak.
If you like to trade around commodities, you might enjoy my newsletter more than some that are not focused on them. You can find a sale price at GregSchnell.com/Explore.
|
| READ ONLINE → |
|
|
|
| ChartWatchers |
| How to Best Position Yourself For a Rocky Market Ahead |
| by John Hopkins |
The volatility we've seen in the market of late can be linked to some recent reports showing that inflationary concerns are becoming problematic. More specifically, the Labor Department reported that CPI rose by 0.8%, while the rate of inflation over the past year climbed 4.2% in April, the highest level since 2008. And, even though the market recovered some from the market selloff earlier in the week, large cap tech stocks continue to lag.
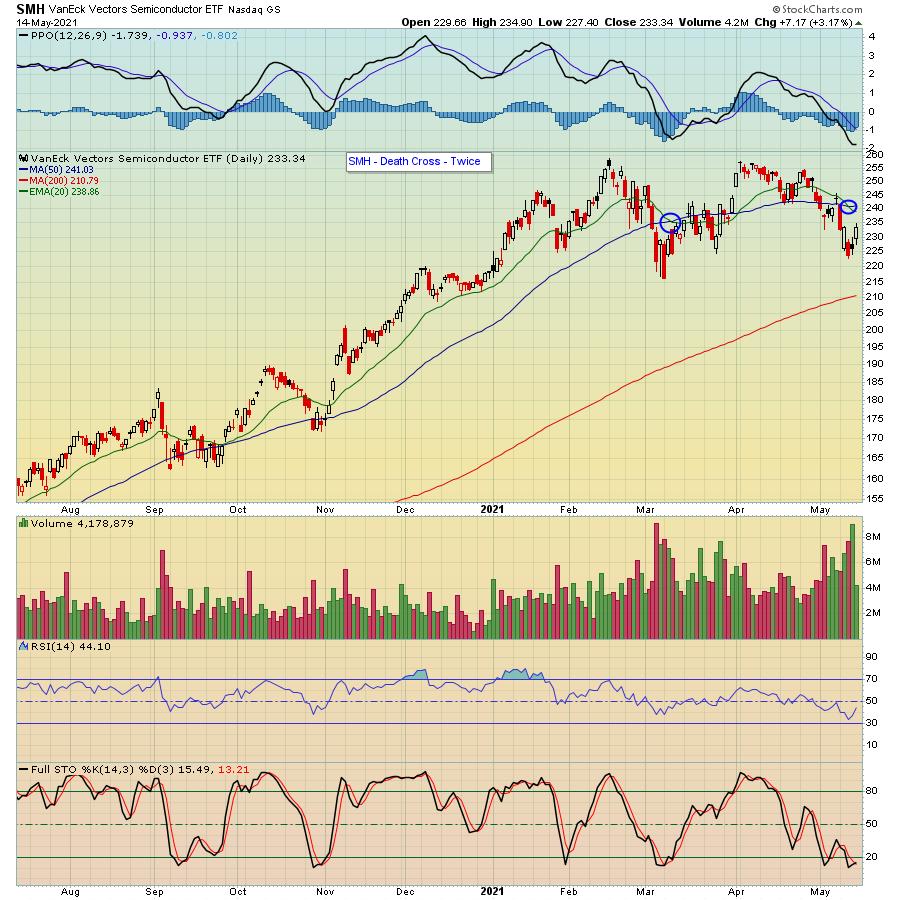
One of the harder-hit sectors has been semiconductors, which, up until late last week, had been taking a pounding. In fact, if you look at the chart below on the SMH, you will see that the 20-day moving average crossed below the 50-day for the second time in the past three months. It is now at an 8-month relative low to the S&P 500.
 We're also seeing previous market leaders, like TSLA, struggling to advance, in spite of the significant pullback since its peak in late January. The stock is now battling to remain above its 200-day moving average, a level last visited in March of last year when the pandemic was just moving into high gear. We're also seeing previous market leaders, like TSLA, struggling to advance, in spite of the significant pullback since its peak in late January. The stock is now battling to remain above its 200-day moving average, a level last visited in March of last year when the pandemic was just moving into high gear.
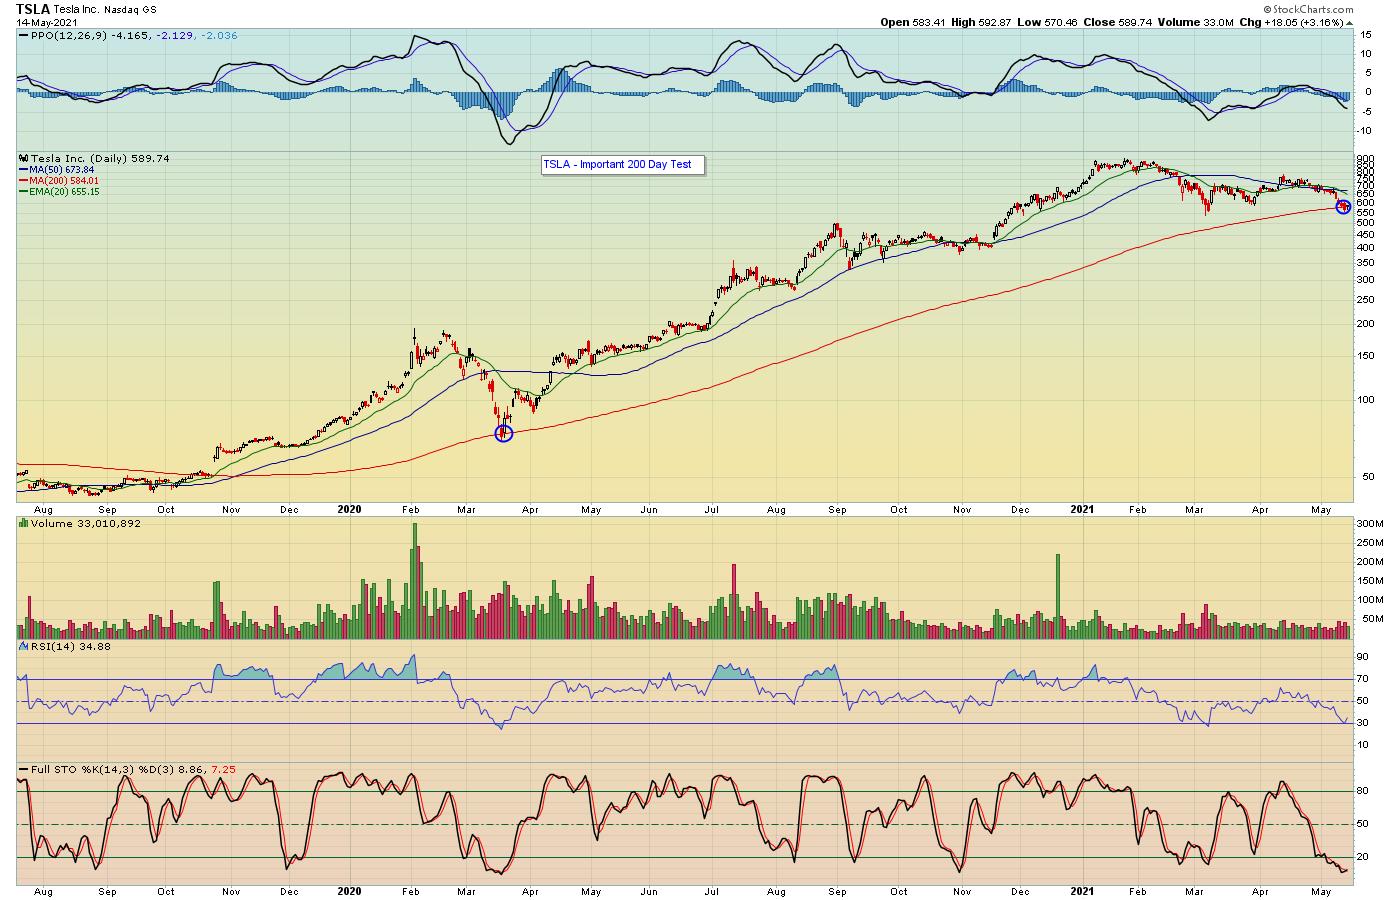
Of course, it is possible TSLA will hold the line at this critical support level, but, if it doesn't, the stock could deteriorate further.
TSLA certainly isn't the only stock struggling at a key support level. There are many large-cap tech stocks in the same position. So, in some ways, the tech sector is at a "do-or-die" moment in the near term.
Given the weakness in tech stocks, where might investors turn to over the summer months? It's an extremely important and timely question and one that our Chief Market Strategist Tom Bowley will be addressing with our members during the upcoming "Top 10 Stock Picks" webinar this Wednesday, May 19. During this event Tom will be focusing on leading stocks in leading industry groups as he unveils his Top 10 Stock Picks in our 4 portfolios (40 stocks in all). This is one of our most popular quarterly events and, if you would like to learn more on how you can participate, just click here.
Rising inflation, increasing volatility and ongoing sector rotation has made it more difficult to navigate today's market. So make sure you focus on those sectors and stocks that are likely to benefit the most in these changing times.
At your service,
John Hopkins
EarningsBeats.com
|
| READ ONLINE → |
|
|
|
| Mish's Market Minute |
| Is the Current Market Rally Sustainable? |
| by Mish Schneider |
This past week, dip buyers saved the market from breaking lower.
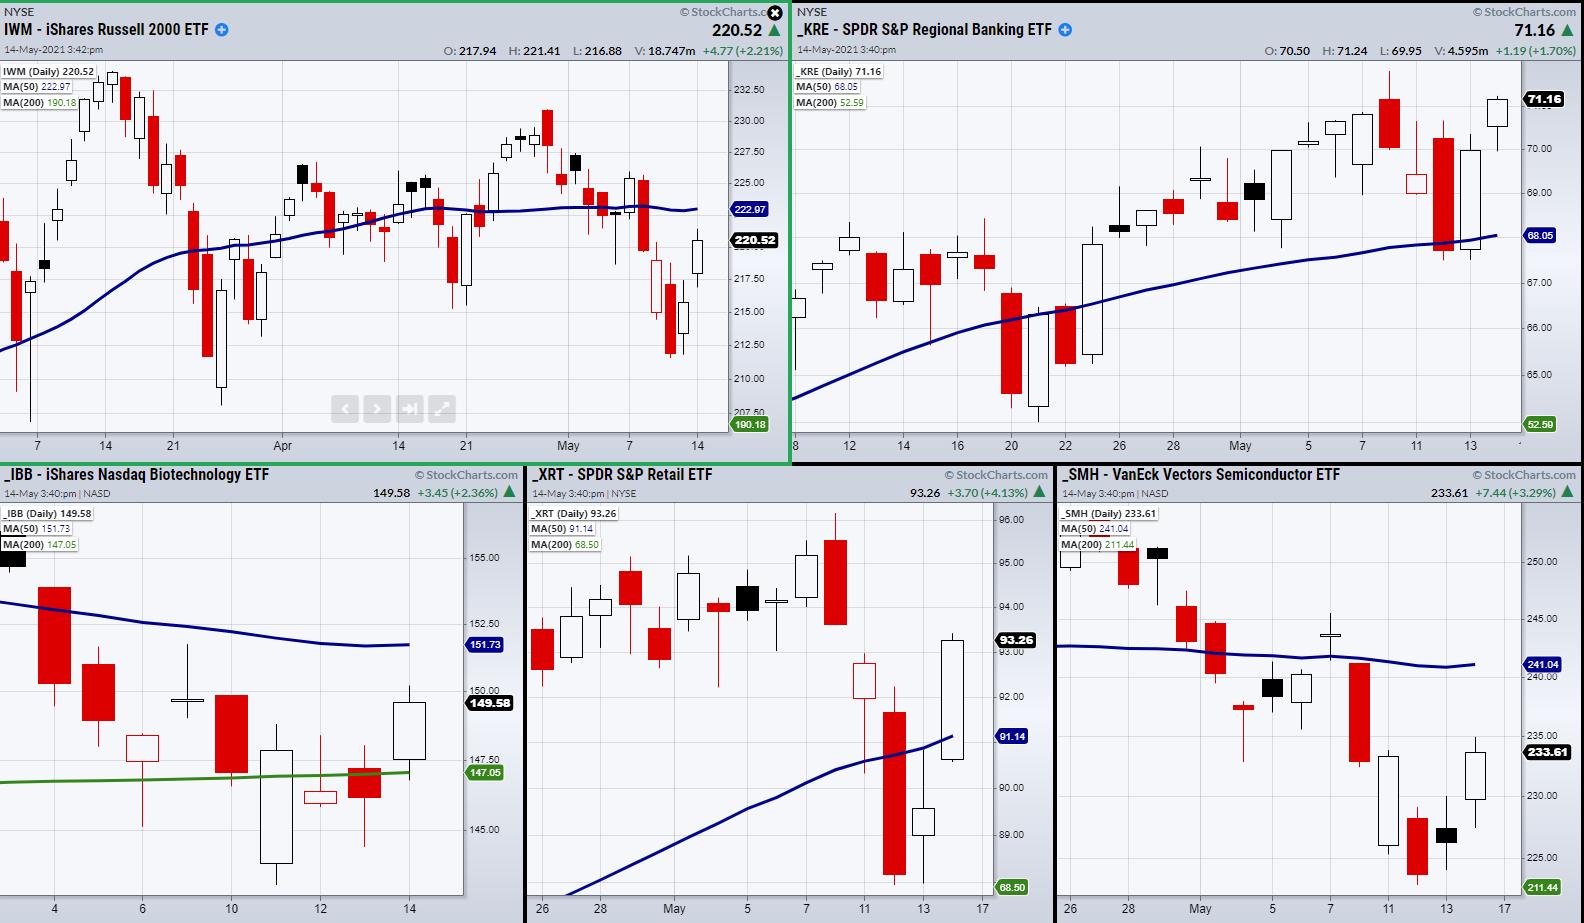
The Retail (XRT) and Regional Banking (KRE) sectors have cleared back over resistance from their 50-day moving averages, followed by the Biotech (IBB) clearing back over its 200-DMA. However, the small-cap Russell 2000 (IWM) and Semiconductors (SMH) are still underneath their 50-DMA. Luckily, they are holding support from their respective trading ranges. Moreover, SMH is back within its trading range from mid-March, while IWM has been stuck roughly between $215 and $230 for over 3 months.
With that said, the next positive sign to look for is follow-through from new buyers in the coming week. If fresh interest does not enter the market, we could be looking at a choppy situation as the market tries to find its direction. Furthermore, from a trading standpoint, this leaves us with a few options, as a choppy market can flip direction quickly.
- Take trades with profit targets that do not require the market to run to new highs.
- Look to diversify from equities into some commodities. Therefore, you are not constrained by overall market action.
- Watch the U.S. dollar ,as it is under threat to break down further, which could reignite inflation fears.
Of course, there is always the option to do nothing if you want to wait for more market clarity.
Part lesson and part actionable information, Mish takes you through the longer-term moving averages, plus gives you a bunch of long and short picks, in this week's edition of StockCharts TV's Mish's Market Minute.

Is the market correction over? In the Friday, May 14th edition of StockCharts TV's Your Daily Five, Mish goes through the economic modern family and outliers. Plus, she discusses the outliers or the influences on the markets such as the bonds, the dollar and gold.
Follow Mish on Twitter @marketminute for stock picks and more. Follow Mish on Instagram (mishschneider) for daily morning videos. To see updated media clips, click here.
ETF Summary
- S&P 500 (SPY): Cleared the 10-DMA at 415.51.
- Russell 2000 (IWM): Support 215.
- Dow (DIA): Cleared 342.96, the 10-DMA.
- Nasdaq (QQQ): Watching to clear back over the 50-DMA at 326.52.
- KRE (Regional Banks): 71.82 resistance.
- SMH (Semiconductors): 233 pivotal area.
- IYT (Transportation): 282.40 resistance.
- IBB (Biotechnology): 147.05 support.
- XRT (Retail): Cleared the 50-DMA and the 10-DMA at 92.94.
Forrest Crist-Ruiz
MarketGauge.com
Assistant Director of Trading Research and Education
|
| READ ONLINE → |
|
|
|
| MORE ARTICLES → |
|