-SPY forms doji near September highs
-Short-term uptrend remains in place for SPY
-Treasury yields surge over the last two days
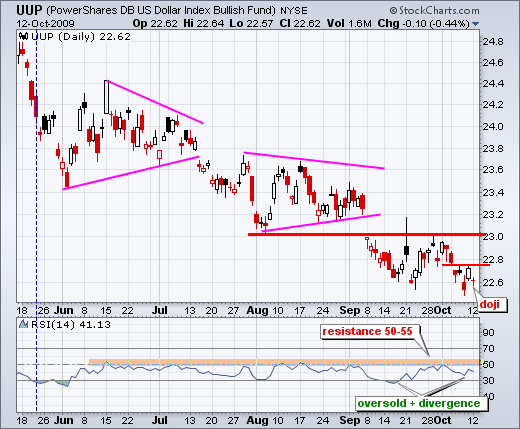
-Dollar ETF forms doji near September lows
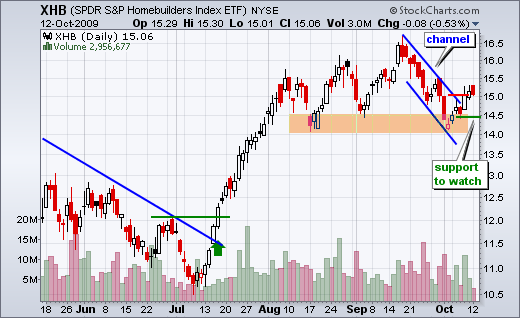
-Homebuilders SPDR bounces off support
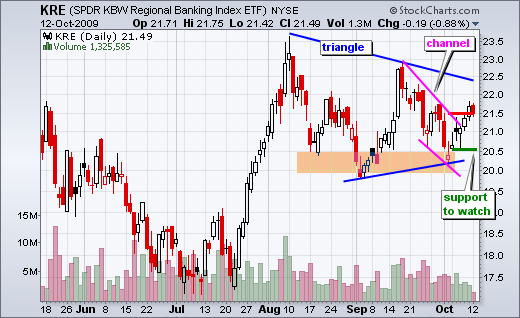
-Regional Bank SPDR breaks channel resistance
-Transport iShares hits retracement zone
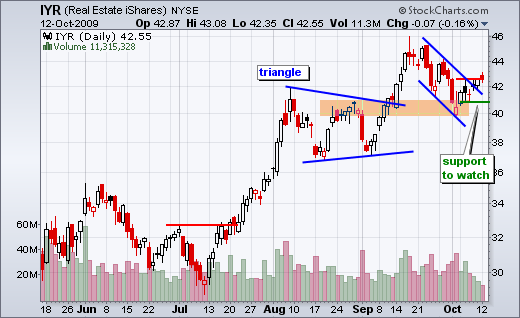
-REIT iShares edges above channel trendline
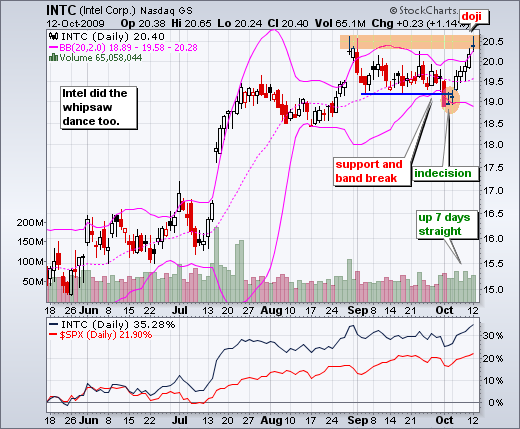
-Semis and Intel show leadership with big move
-Cigna (CI) bounces ahead of key vote
-CME Group (CME) forges bullish wedge
-CSX Corp (CSX) shows relative weakness
-Rockwell Automation (ROK) forms small consolidation
-Supervalu (SVU) breaks out on good volume
-Click here for video page.
-Next commentary: Friday, October 16th around 7AM
*****************************************************************
Indecision At the Prior Highs
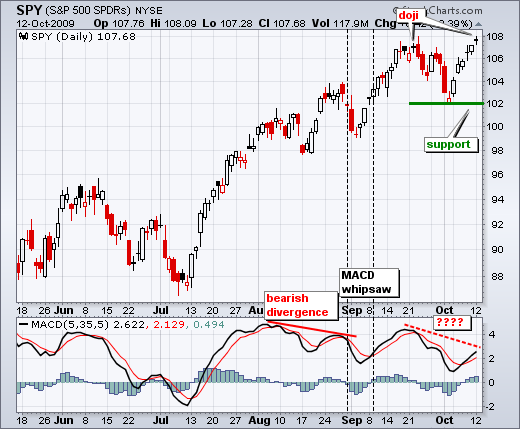
The medium-term trend is clearly up as the S&P 500 ETF (SPY) forged a higher low in early October and surged to its September high over the last six days. With the medium-term trend up, short-term declines are still deemed pullbacks within the uptrend. One pullback will ultimately go too far and reverse the medium-term uptrend. So far we have yet to see a trend reversing pullback.
SPY opened strong on Monday morning, but finished the day near opening levels to form a doji. These candlesticks signal indecision that can sometimes foreshadow a short-term reversal. Also notice that SPY is trading near potential resistance from the September highs. DIA and QQQQ also formed doji near their September highs. SPY surged to 108 in mid September, stalled for a few days and then pulled back to 102 with a rather sharp decline. Also notice that doji and indecision foreshadowed this pullback.
The bottom indicator window shows SPY with MACD (5,35,5), as opposed to classic MACD (9,26,9). I adjusted the settings to increase sensitivity. A bearish divergence formed in August and this preceded a short pullback. However, this bearish signal did not translate into a good trade. It resulted in a whipsaw and relatively small loss. Not all divergences work. It is important to implement an exit strategy before entering a trade. Another bearish divergence is brewing, but MACD remains above its signal line. A move below the signal line would be negative for momentum. A break below the zero line would be outright bearish for momentum.
*****************************************************************
The Three Little Gaps
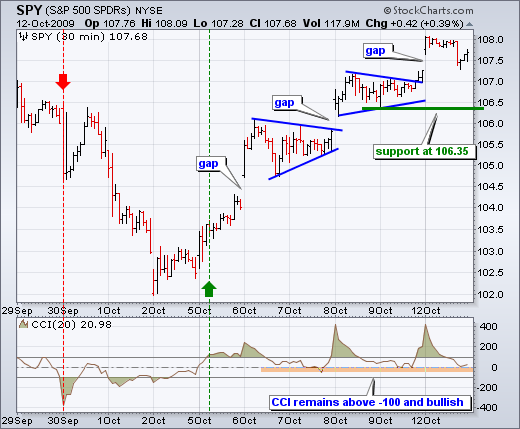
The S&P 500 ETF (SPY) gapped up on Monday for the third time in five days. Like the previous gaps, Monday's gap held and the short-term trend remains firmly bullish. With this gap and the Thursday-Friday consolidation, I am marking short-term support at 106.35. A move below this level would reverse the short-term uptrend.
I am also cueing off CCI(20) form short-term clues. CCI surged above +100 on October 5th and remains bullish. Remember, I consider CCI bullish after a surge above +100 (show of strength). A bearish signal is rendered with a plunge below -100 (show of weakness). A support break in SPY and CCI plunge below -100 would be reason enough to expect short-term weakness. Until such a signal emerges, SPY remains on the short-term bullish signal from October 5th.
*****************************************************************
Short-term Rates Surge
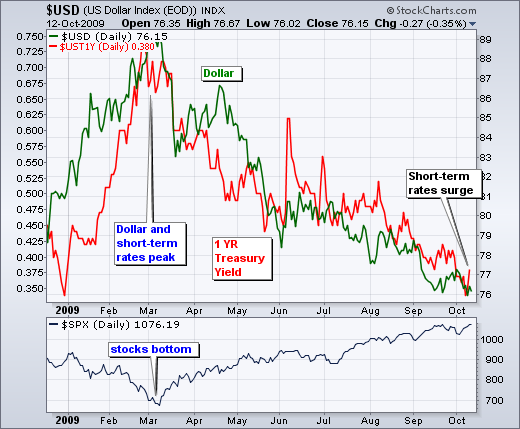
Short-term rates and the US Dollar Index ($USD) have been positively correlated this year. They both rise and fall together. In addition, the S&P 500 and the US Dollar Index have been negatively correlated. Until there is a decoupling, we should expect strength in the Dollar to translate into weakness for stocks. By extension, a rise in short-term rates would translate into strength in the Dollar.
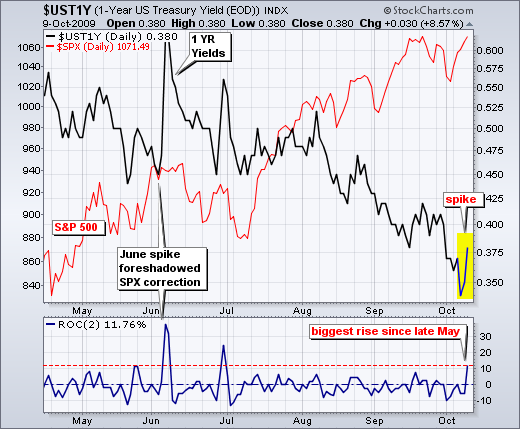
The chart above shows 1-year Treasury Yields ($UST1Y) spiking higher on Friday-Monday. Granted this is just a two-day spike, but it is something we should keep an eye on because it is the biggest two-day spike since late May. A bigger spike in early June foreshadowed the June-July correction in the S&P 500.
*****************************************************************
Dollar ETF Forms Doji
The Dollar Bullish ETF (UUP) is trying to firm near its September low, just as SPY hits its September highs. UUP formed a doji yesterday and RSI has a bullish divergence working. I am marking first resistance with Friday's high. A move above this level in UUP and a RSI break above 55 would be short-term bullish. With the Dollar in a clear downtrend, playing the upside is basically picking a bottom. This means whipsaw risk or loosing trade is above average.
*****************************************************************
Watching the Channel Breakouts
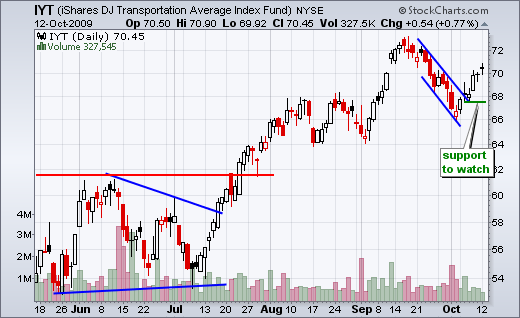
The next charts feature four ETFs with channel breakouts over the last few days. These four ETFs represent some important groups: the Homebuilders SPDR (XHB) for housing, the Regional Bank SPDR (KRE) for banks, the Transport ETF (IYT) for transports and the REIT iShares (IYR) for REITs. Two of the four come from the finance sector. First, notice that all four ETFs show relative weakness. The S&P 500 and Dow Industrials are both trading near their September highs, but these four are currently well below their September highs. They have not kept pace on with the broader market over the last six days. Second, the channel breakouts are bullish only as long as they hold. Each chart shows support based on last Wednesday's low (green line). Failure to hold this low would signal a failed breakout and put these four back in bear mode.
*****************************************************************
Semis Surge
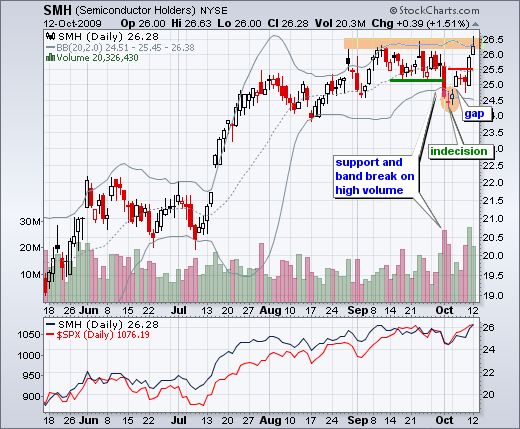
After breaking support and moving below the lower Bollinger Band in early October, the Semiconductors HOLDRS (SMH) rebounded last week and surged back to its September highs. It is time for anatomy of a whipsaw. The break occurred on high volume and looked bearish. SMH formed two indecisive candlesticks immediately after the break. This indecision warned of a possible short-term reversal. SMH moved back above 25 with a gap last Tuesday, stalled for two days and then surged above 25.5 on Friday. At the very least, the second surge on Friday put the bulls back in control. I am not keen on long positions near resistance, but strength in semis is a good sign for the technology sector and Nasdaq.
*****************************************************************
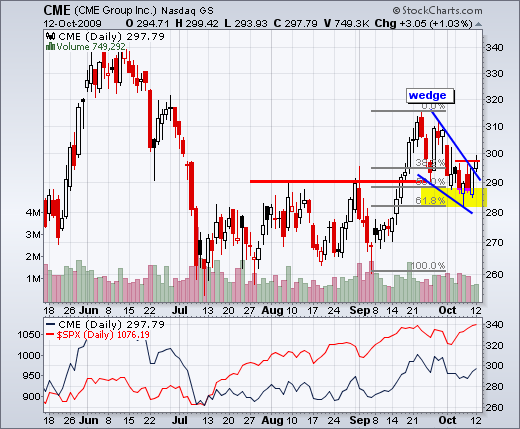
After breaking resistance with a big surge in September, the CME Group (CME) formed a bullish wedge that retraced 62% of this surge. The stock found support around 285 with a bullish engulfing on Friday. Monday's small gain on low volume does not quite confirm though. I would like to see further strength above 300 to complete the breakout. A move below 285 would negate the setup.
*****************************************************************
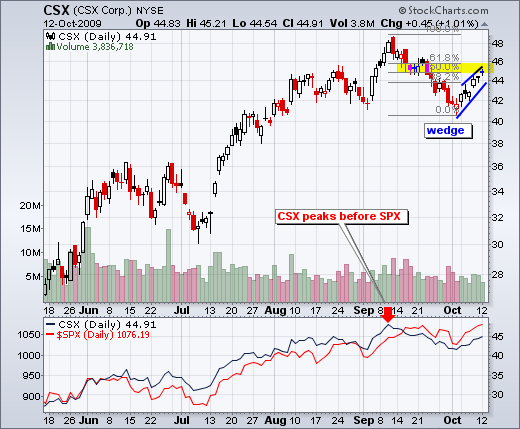
CSX Corp (CSX) is stalling in a potential resistance zone. CSX declined sharply in September with high volume and then retraced 50-62% of that decline with the October bounce. It is another classic wedge/retracement that could peak soon. CSX formed a doji on Monday and a move below 43.8 would break the wedge trendline. CSX is also showing relative weakness by peaking in early September.
*****************************************************************
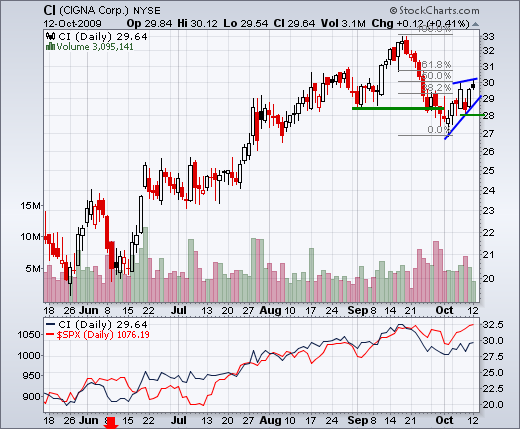
Today's vote in the Senate finance committee is likely to affect health insurance stocks. Cigna (CI), Aetna (AET) and United Healthgroup (UNH) were all hit hard in September. They bounced over the last few days, but this could be a dead-cat bounce. Cigna declined on high volume and then formed a small rising wedge that retraced 50% of this decline. The stock is lagging the broader market over the last few weeks as well. A move below 28 would break wedge support and call for a continuation lower. Be careful because a finance committee surprise would affect the stock - either way.
*****************************************************************
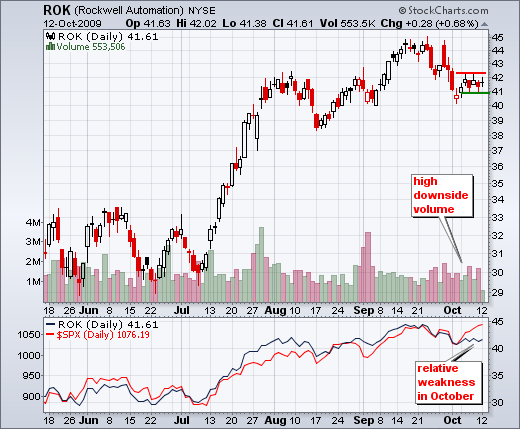
Rockwell Automation (ROK) shows relative weakness in October. While the S&P 500 surged towards its September highs this month, ROK barely bounced and shows relative weakness. The stock declined on high volume and downside volume continues to outpace upside volume in October. Nevertheless, I am watching the consolidation for the next clue. A break above last week's high would be bullish, while a break below last week's lows would be bearish.
*****************************************************************
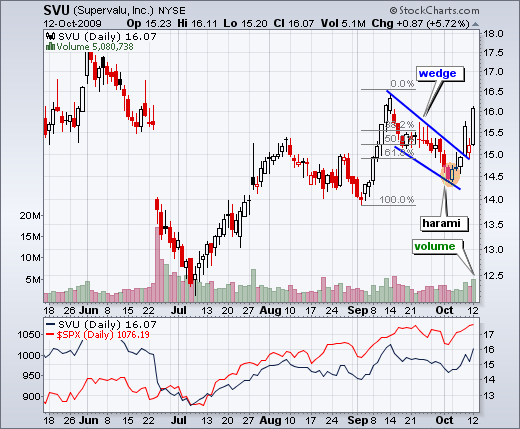
Supervalue (SVU) breaks wedge resistance on high volume. SVU first attempted to firm at the 62% retracement in late September, but fell further the first two days of October. Despite overshooting the 62% retracement mark around 15, the stock firmed with a bullish harami around 14.5 and then broke wedge resistance with good volume last week. SVU followed through with good volume on Monday and this breakout looks valid.
*****************************************************************
Thanks for tuning in and good trading!
*****************************************************************

