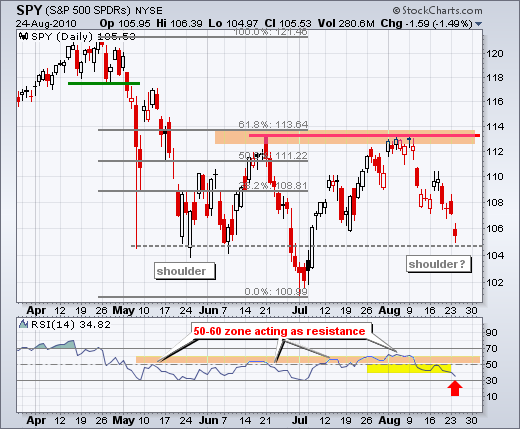
With a gap down and sharp decline, the S&P 500 ETF (SPY) closed below 106 for the first time since early July. Selling pressure has been quite intense since August 9. SPY has closed down 9 of the last 11 days (red candlesticks) with three sizable down gaps along the way. While there are no reasons to turn bullish at this point, it is possible that SPY finds support around 105. Notice that this area marked support from early May until early June. In fact, a reaction low near current levels would raise the specter of an inverse head-and-shoulders pattern. However, I am not ready to consider this possibility right now. Selling pressure remains stronger than buying pressure and RSI broke well below 40. Using the Hindsight Indicator, it appears that the little blip above 60 in early August was a fluke.


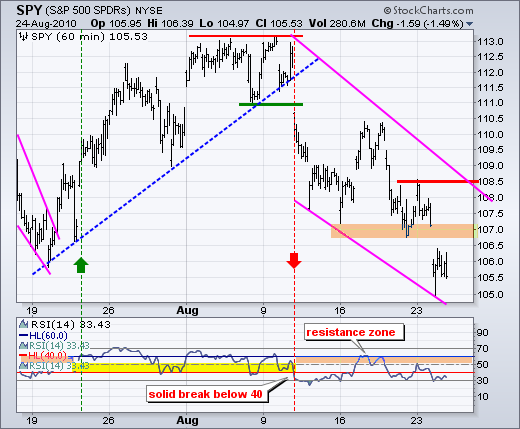
On the 60-minute chart, SPY is now down over 6% from its early August high (11 days). The ETF gapped down and then consolidated around 105.5 the entire day. Selling pressure abated after the gap, which is positive. However, buying pressure was not strong enough to produce a post-gap bounce, which is negative. The downtrend is clearly defined by the falling wedge. At this point, I would not be surprised to see some sort of feeble bounce or consolidation. Broken support around 107 turns into the first resistance level to watch. Key resistance is set at 108.5. RSI remains in bear mode as it trades in the 20-60 range.

Key Economic Reports:
Wed - Aug 25 - 08:30 - Durable Orders
Wed - Aug 25 - 10:00 - New Home Sales
Wed - Aug 25 - 10:30 - Oil Inventories
Thu - Aug 26 - 08:30 - Jobless Claims
Fri - Aug 27 - 08:30 - GDP
Fri - Aug 27 - 09:55 - U Michigan Consumer Sentiment
Charts of Interest: Tuesday and Thursday
This commentary and charts-of-interest are designed to stimulate thinking. This analysis is not a recommendation to buy, sell, hold or sell short any security (stock ETF or otherwise). We all need to think for ourselves when it comes to trading our own accounts. First, it is the only way to really learn. Second, we are the only ones responsible for our decisions. Think of these charts as food for further analysis. Before making a trade, it is important to have a plan. Plan the trade and trade the plan. Among other things, this includes setting a trigger level, a target area and a stop-loss level. It is also important to plan for three possible price movements: advance, decline or sideways. Have a plan for all three scenarios BEFORE making the trade. Consider possible holding times. And finally, look at overall market conditions and sector/industry performance.

About the author:
Arthur Hill, CMT, is the Chief Technical Strategist at TrendInvestorPro.com. Focusing predominantly on US equities and ETFs, his systematic approach of identifying trend, finding signals within the trend, and setting key price levels has made him an esteemed market technician. Arthur has written articles for numerous financial publications including Barrons and Stocks & Commodities Magazine. In addition to his Chartered Market Technician (CMT) designation, he holds an MBA from the Cass Business School at City University in London.
Learn More


