Stocks started the day weak, but surged in the final hour on rumors of a Greek debt deal involving the European Central Bank (ECB), IMF and the European Commission. Gee, maybe we can find a few more organizations to throw into this rumor. In any case, these rumors and "big" announcements are the challenge to traders. Positive rumors/announcements trigger quick buying binges, while negative rumors/announcements lead to sharp sell offs. In addition to the ongoing European debt debacle, we also have the Fed meeting starting today and a policy statement on Wednesday afternoon. It may be best to take the rest of the week-month off! There will not be any charts of interest this week. I am going to let things settle down a bit.
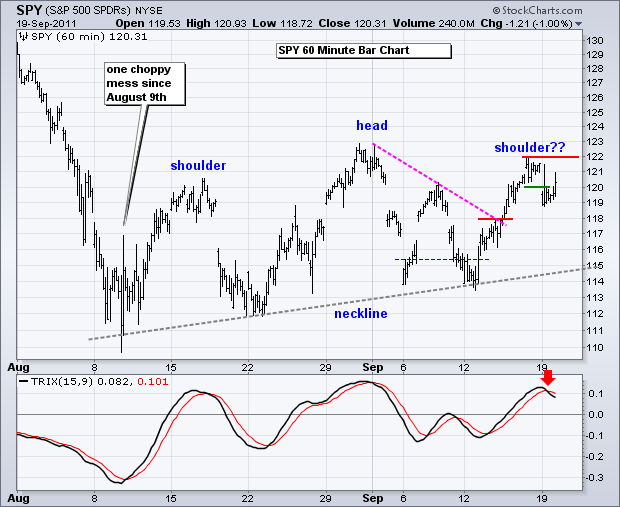
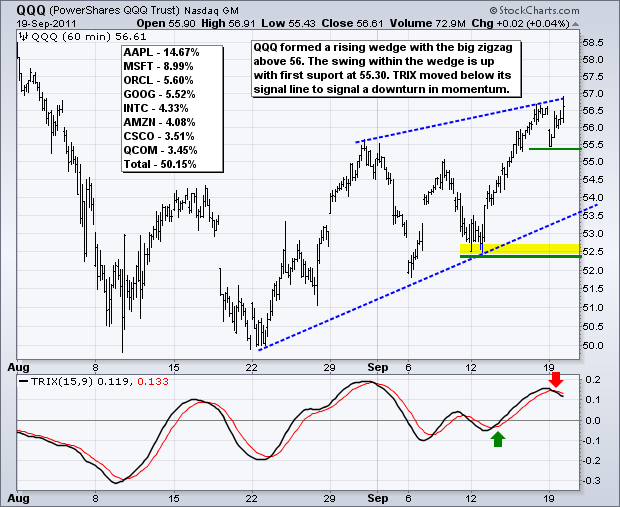
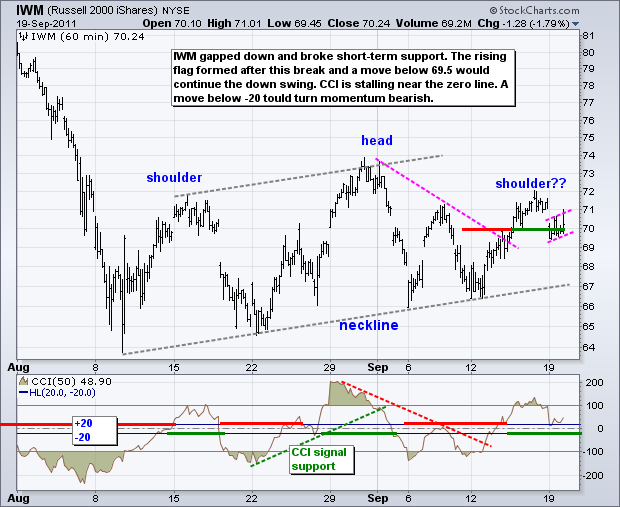
IWM and SPY have Head-and-Shoulders patterns evolving, while QQQ remains the strongest with a surge above last week's high. Large-cap techs are showing some serious resilience and relative strength. SPY broke short-term support with the open below 120, but moved back above this level in the final hour. The TRIX moved below its signal line and remains below. I will treat this support break as valid as long as the TRIX remains below its signal line and resistance at 122 holds. For the Head-and-Shoulders, neckline support is around 114-115. A break below this level targets a move to the 104.50 area. The height of the pattern (±10) is subtracted from the neckline break (114.5) for a target.
**************************************************************************
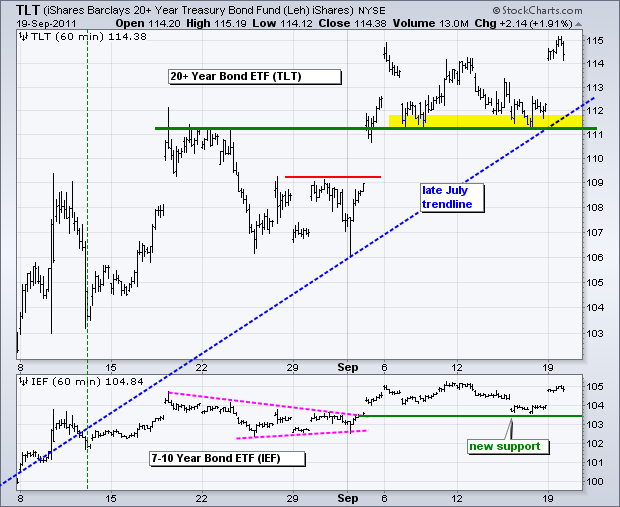
The 20+ year Bond ETF (TLT) surged off support to reinforce the importance of the 111 area. Once again, the risk-off trade triggered the move into US Treasuries. Bonds are likely to be quite volatile the next few days as the Fed meeting starts Tuesday and the policy statement is Wednesday.
**************************************************************************
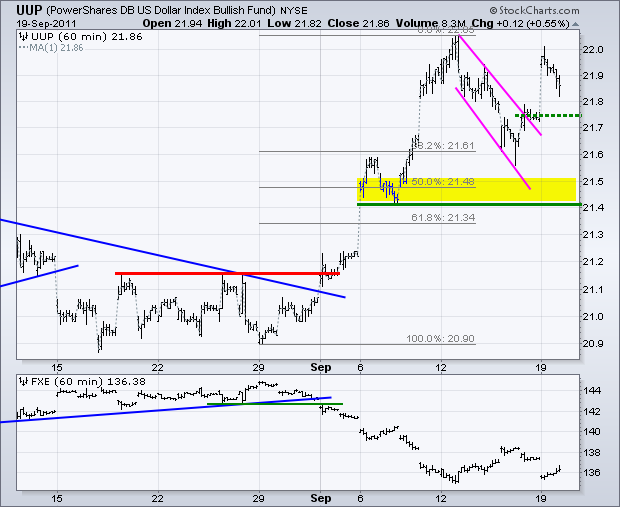
With the Euro accounting for 57% of the US Dollar Fund (UUP), this ETF is subject to the news/rumor flow out of Europe. This news flow will affect the short-term trend by causing volatility and knee-jerk reactions. However, I think the bigger trend is up after UUP broke its May high. This means declines will be treated as corrections. UUP corrected last week and broke flag resistance with a surge on Friday-Monday. Key support is set at 21.40.
**************************************************************************
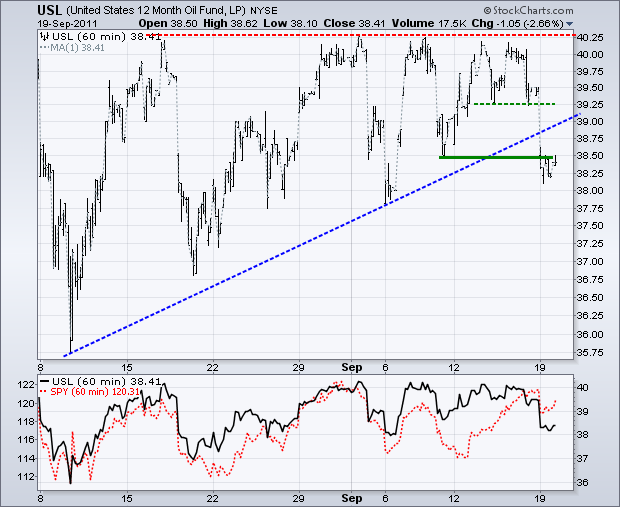
The 12-Month US Oil Fund (USL) failed at resistance in the 40.25 area and broke supports with a sharp decline the last two days. USL broke the early August trendline and exceeded the reaction low (trough) at 38.50.
**************************************************************************
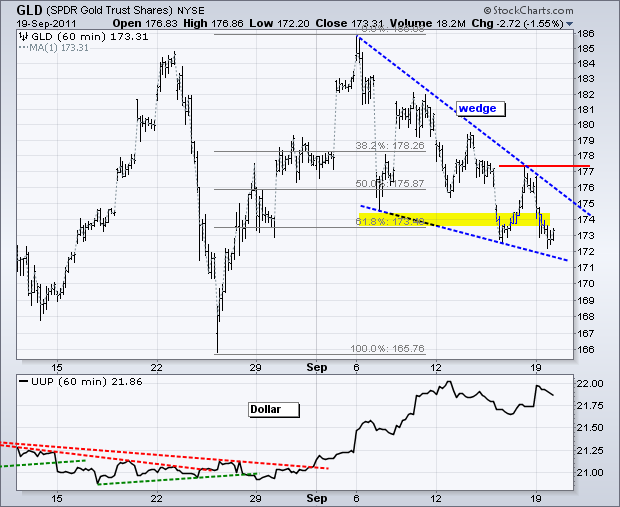
The Gold SPDR (GLD) has one of the more interesting patterns/setups. The short-term trend is down as the ETF declines within a falling wedge. However, the bigger trend remains up and this decline looks corrective. Both the pattern and a 61.80% retracement are normal for corrections. Friday's high marks first resistance. A move above this level would reverse the short-term downtrend and call for a continuation higher.
**************************************************************************
Key Economic Reports:
Tue - Sep 20 - 08:30 - Housing Starts-Building Permits
Tue - Sep 20 - 08:30 - FOMC Meeting Begins
Wed - Sep 21 - 07:00 - MBA Mortgage Index
Wed - Sep 21 - 10:00 - Existing Home Sales
Wed - Sep 21 - 10:30 - Crude Inventories
Wed - Sep 21 - 14:15 - FOMC Policy Statement
Thu - Sep 22 - 08:30 - Initial Claims
Thu - Sep 22 - 10:00 - Leading Indicators
Charts of Interest: Not this week.
This commentary and charts-of-interest are designed to stimulate thinking. This analysis is not a recommendation to buy, sell, hold or sell short any security (stock ETF or otherwise). We all need to think for ourselves when it comes to trading our own accounts. First, it is the only way to really learn. Second, we are the only ones responsible for our decisions. Think of these charts as food for further analysis. Before making a trade, it is important to have a plan. Plan the trade and trade the plan. Among other things, this includes setting a trigger level, a target area and a stop-loss level. It is also important to plan for three possible price movements: advance, decline or sideways. Have a plan for all three scenarios BEFORE making the trade. Consider possible holding times. And finally, look at overall market conditions and sector/industry performance.

