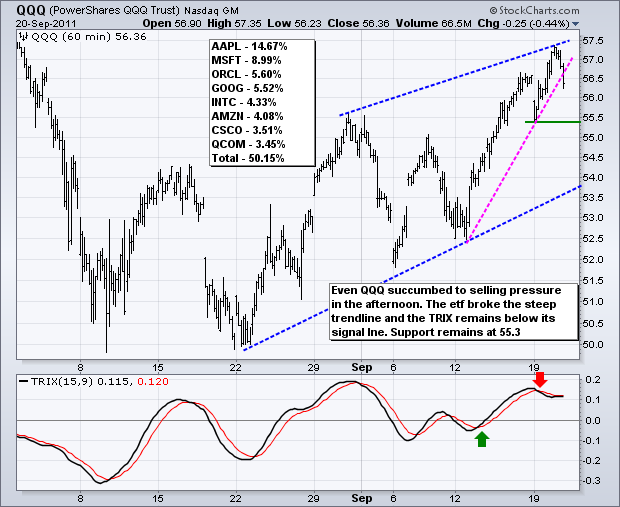
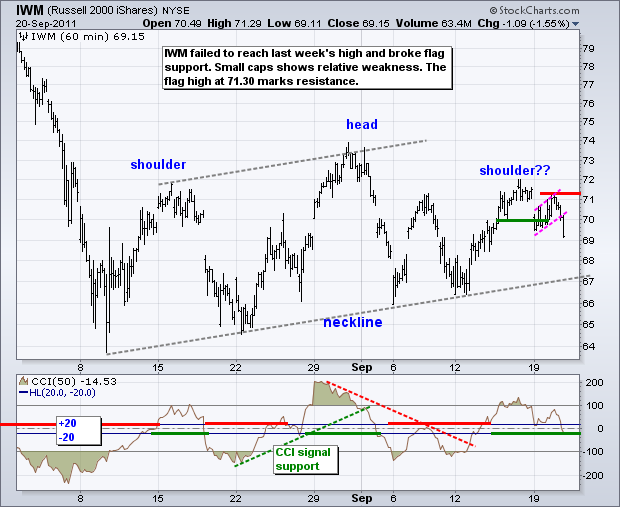
In an about face, stocks started the day strong and sold off in the final hour. Perhaps even more telling, small-caps led the way lower with the Russell 2000 ETF (IWM) loosing 1.55% on the day. This is a negative sign to see small-caps lead lower. These stocks (companies) are like the canaries in the coal mine so to speak. They are more sensitive to changes in the economy, especially the domestic economy. These companies do not have as much exposure to the global economy (Europe).
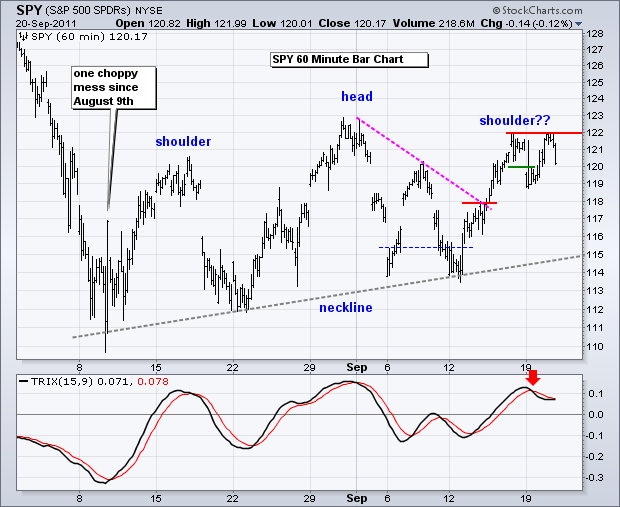
There is no change on the S&P 500 ETF (SPY) chart. The ETF surged to last week's high, but met resistance at 122 and sold off in the afternoon. This reinforces resistance at 122. A Head-and-Shoulders is still possible with neckline support rising to the 115 area. The TRIX rolled over and broke its signal line last week and remains below this line. It looks like the advance since last week is running out of steam. The FOMC policy statement is slated for 2:15PM today. Anything is possible on Fed days. Typically, the market trades flat into the early afternoon and then turns volatile around 2PM. The chances of a false breakout (head fake) are high.
**************************************************************************
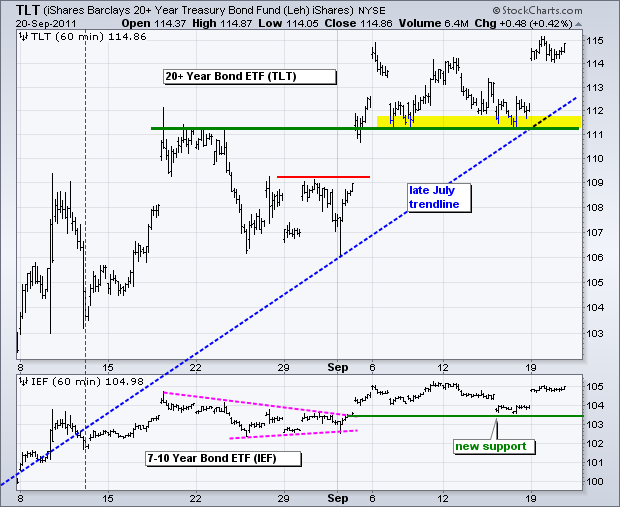
The 20+ year Bond ETF (TLT) held its gains as the Fed meeting approaches. Long bonds have been rallying since late July in anticipation of QE3 or Operation Twist. This means we could get a buy-the-rumor and sell-the-news scenario over the next few days. It is also possible that the split within the FOMC produces a weaker QE3/Twist. On the price chart, 111 marks key support for TLT and a break below this level would argue for a correction of the July–September advance.
**************************************************************************
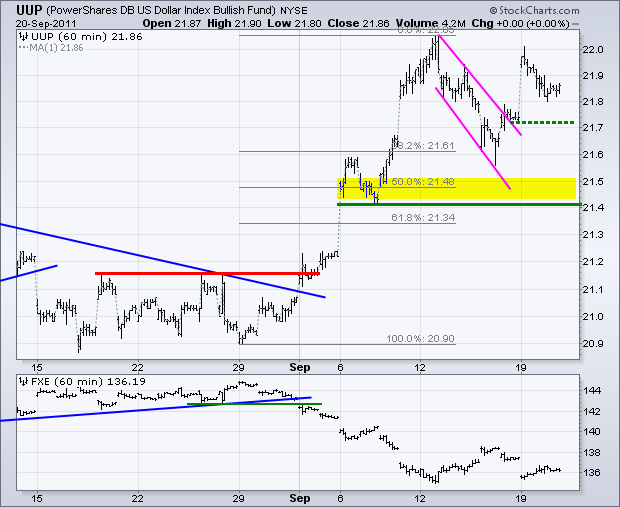
There is no change for the US Dollar Fund (UUP). The ETF corrected with a 38-50% retracement that formed a falling flag. UUP then broke flag resistance with a surge on Monday and is holding this breakout. First support is set at 21.70. A break below this level would negate the flag breakout. Key support remains at 21.40.
**************************************************************************
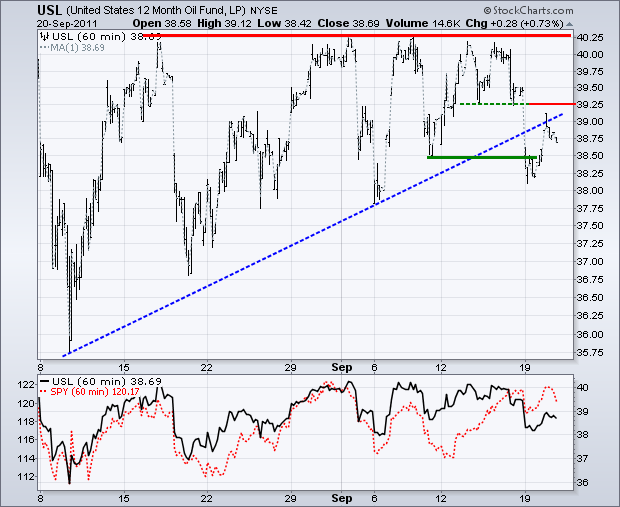
The 12-Month US Oil Fund (USL) failed at resistance in the 40.25 area and broke supports with a sharp decline below 38.50. The ETF got an oversold bounce back to around 39 and the 39.25 level now acts a first resistance. Key resistance is set at 40.25.
**************************************************************************
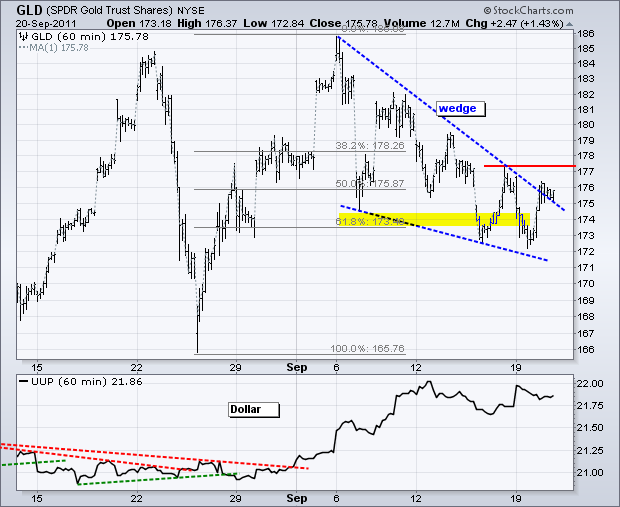
There is not change Gold SPDR (GLD), which has one of the more interesting patterns/setups. The short-term trend is down as the ETF declines within a falling wedge. However, the bigger trend remains up and this decline looks corrective. Both the pattern and a 61.80% retracement are normal for corrections. Friday's high marks first resistance. A move above this level would reverse the short-term downtrend and call for a continuation higher.
Key Economic Reports:
Wed - Sep 21 - 07:00 - MBA Mortgage Index
Wed - Sep 21 - 10:00 - Existing Home Sales
Wed - Sep 21 - 10:30 - Crude Inventories
Wed - Sep 21 - 14:15 - FOMC Policy Statement
Thu - Sep 22 - 08:30 - Initial Claims
Thu - Sep 22 - 10:00 - Leading Indicators
Charts of Interest: Tuesday and Thursday in separate post.
This commentary and charts-of-interest are designed to stimulate thinking. This analysis is not a recommendation to buy, sell, hold or sell short any security (stock ETF or otherwise). We all need to think for ourselves when it comes to trading our own accounts. First, it is the only way to really learn. Second, we are the only ones responsible for our decisions. Think of these charts as food for further analysis. Before making a trade, it is important to have a plan. Plan the trade and trade the plan. Among other things, this includes setting a trigger level, a target area and a stop-loss level. It is also important to plan for three possible price movements: advance, decline or sideways. Have a plan for all three scenarios BEFORE making the trade. Consider possible holding times. And finally, look at overall market conditions and sector/industry performance.

