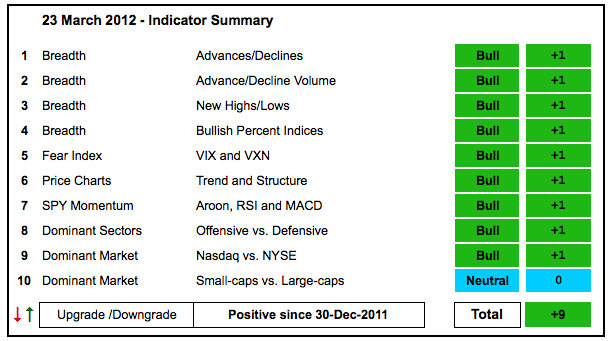
The indicator summary remains firmly positive with relative weakness in small-caps the only concern in the market right now. Well, I am also concerned with overbought conditions that could lead to a corrective period ahead. Nevertheless, we have yet to see any signs of significant selling pressure. The current advance is six months old and the S&P 500 up over 25% from its October low. At this stage, I would not be surprised to see a 3-4 week pullback. But when? That, of course, is the $64,000 question. I am noticing that breadth momentum is waning significantly on the NYSE and Nasdaq. The McClellan Oscillators peaked in early February and spent much of March in negative territory ($NAMO, $NYMO).
- AD Lines: Bullish. The Nasdaq AD Line rebounded this week to establish support with the early March low. The NYSE AD Line surged to a new 52-week high on 13-March and then pulled back sharply the last seven trading days.
- AD Volume Lines: Bullish. The Nasdaq and NYSE AD Volume Lines hit new 52-week highs on 19-March and established key support with the early March lows.
- Net New Highs: Bullish. The Nasdaq and NYSE recorded fewer Net New Highs in March than in early February, but the Cumulative Net New Highs Lines remain in uptrends (above their 10-day EMAs).
- Bullish Percent Indices: Bullish. All sector BPIs are above 50% and bullish.
- VIX/VXN: Bullish. The CBOE Volatility Index ($VIX) and the Nasdaq 100 Volatility Index ($VXN) hit new lows in mid March and remain in clear downtrends. Even though both are near their 2011 lows, declining volatility means less risk and this is bullish overall.
- Trend-Structure: Bullish. Even though stocks pulled back the last few days, the major indices hit new 52-week highs in mid March and remain in clear uptrends.
- SPY Momentum: Bullish. RSI is in its bull range (40-80), the Aroon Oscillator has been positive since mid December and MACD(5,35,5) has been positive since 21-Dec.
- Offensive Sector Performance: Bullish. The four offensive sectors are in clear uptrends with no signs of weakness (consumer discretionary, finance, industrials and technology).
- Nasdaq Performance: Bullish. The $COMPQ:$NYA ratio hit another new 52-week high as the Nasdaq continues to outperform the NY Composite.
- Small-cap Performance: Neutral. The $RUT:$OEX ratio peaked in early February and remains in a 6-7 week downtrend. Relative weakness in small-caps during a broad market advance is a concern.
- Breadth Charts (here) and Inter-market charts (here) have been updated.
This table is designed to offer an objective look at current market conditions. It does not aim to pick tops or bottoms. Instead, it seeks to identify noticeable shifts in buying and selling pressure. With 10 indicator groups, the medium-term evidence is unlikely to change drastically overnight.
Previous turns include:
Positive on 30-December-11
Negative on 16-December-11
Positive on 3-December-11
Negative on 23-November-11
Positive on 28-October-11
Negative on 5-August-11
Neutral on 29-Jul-11
Positive on 30-Jun-11
Negative on 17-Jun-11
Positive on 25-Mar-11
Negative on 18-Mar-11
Positive on 3-Sep-10
Negative on 13-Aug-10
Positive on 6-Aug-10
Negative on 24-Jun-10
Positive on 18-Jun-10
Negative on 11-Jun-10
Positive on 5-March-10
Negative on 5-Feb-10
Positive on 11-Sept-09


