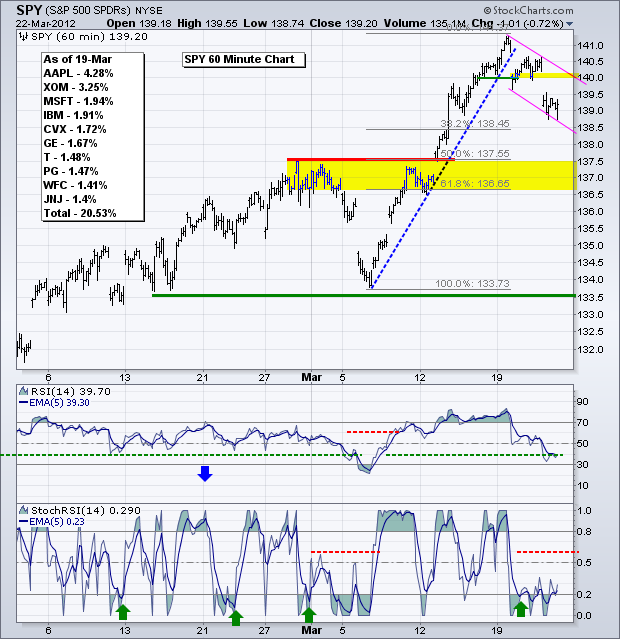
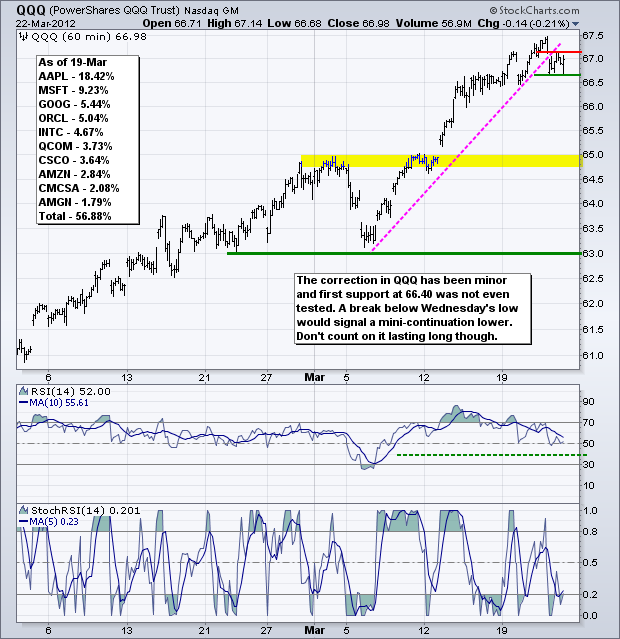
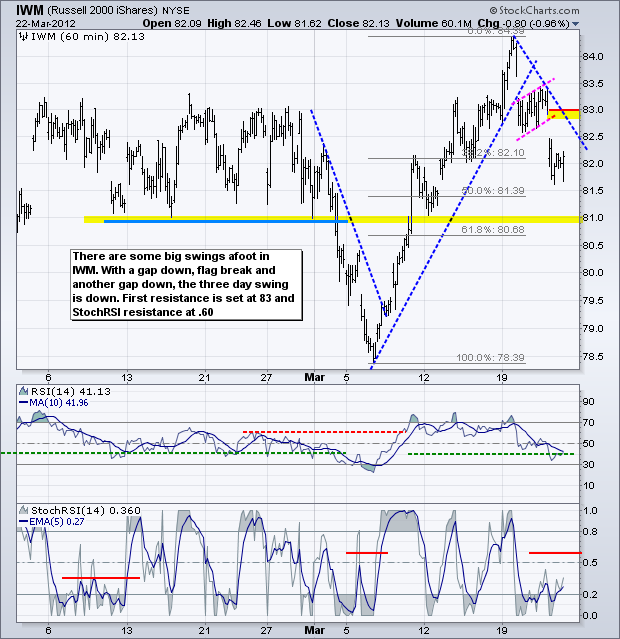
The second shoe dropped for the S&P 500 ETF (SPY) and Russell 2000 ETF (IWM), but the Nasdaq 100 ETF (QQQ) held up rather well (surprise, surprise). I heard an interview with Barry Ritholtz talking about the four asset classes: stocks, commodities, bonds and Apple. While Apple sentiment is extremely one sided, the story is as compelling as ever and their products are truly unrivaled for now. Turning back to stocks, we have now seen a three to five day correction. DIA has been under mild selling pressure for five days, while IWM pulled back over the last three days. For the very short-term, some stocks are oversold and those who missed the rally are seeing discounts. On the SPY chart, the ETF pulled back with a potential falling flag taking shape. Thursday's gap down is holding and the flag is still falling as broken support turns first resistance around 140. StochRSI bounced off the zero line a few times and its 5-day EMA bounced around .20, both of which reflect short-term oversold conditions. Look for a surge above .60 to signal a rebound in momentum that could reignite the uptrend.
**************************************************************************
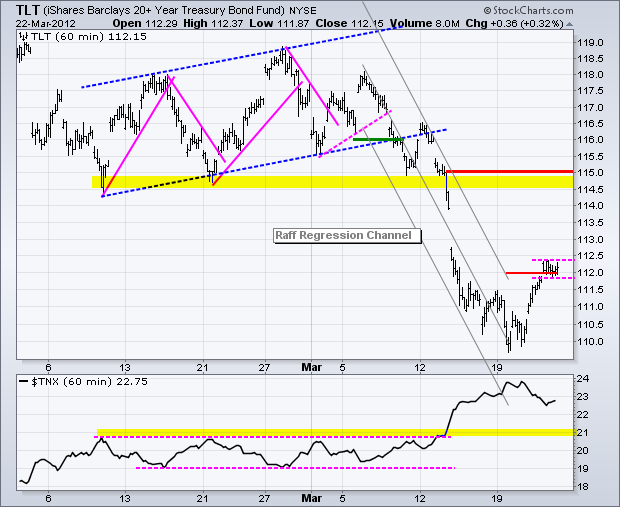
Treasuries will likely benefit as long as stocks remain soft or in corrective mode. The 20+ Year T-Bond ETF (TLT) surged back above 112 and then consolidated with a flat flag. A break above Thursday's high would signal a continuation higher, while a break below the low would argue for a pullback.
**************************************************************************
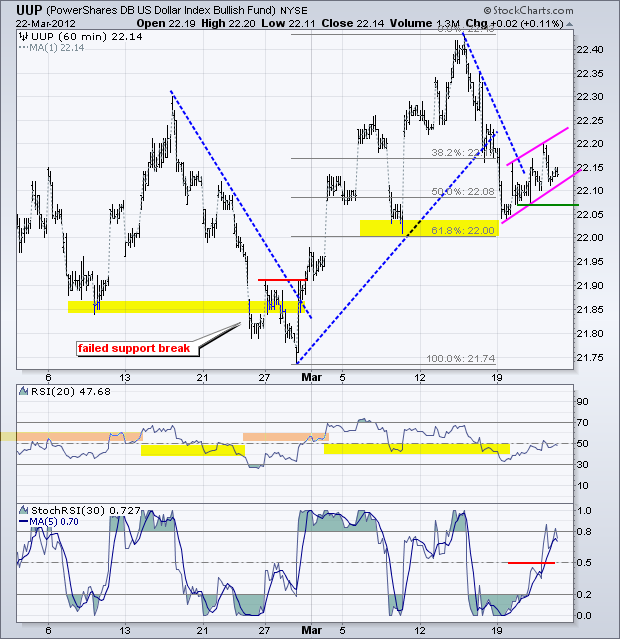
I am not impressed with this bounce in the Dollar over the last few days. After hitting the 50-61.80% retracement zone around 22, the US Dollar Fund (UUP) edged higher with very choppy and tentative action. The advance over the last four days looks like a rising flag, which is a bearish continuation pattern. A move below support would signal a continuation lower.
**************************************************************************
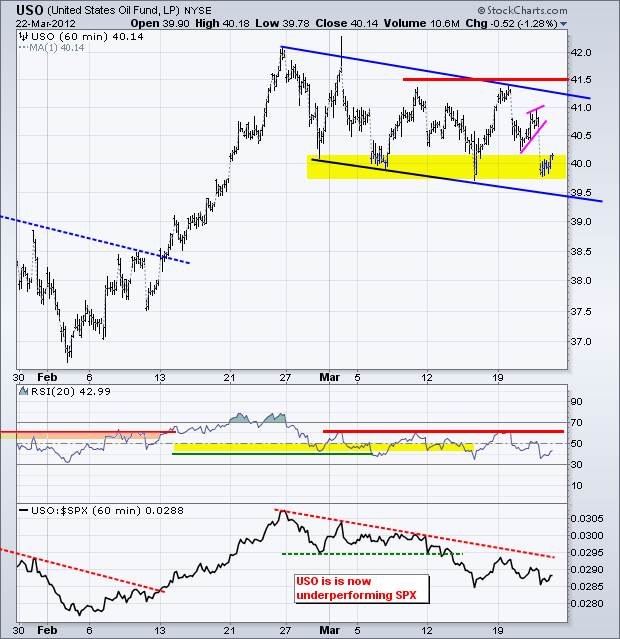
The US Oil Fund (USO) continued lower on Thursday and energy stocks got hammered. The trend in USO is clearly down after the failure at 41.50 and return to support the last three days. Overall, a falling channel is taking shape with a zigzag lower. There may be some support around 40, but a convincing move above 41.50 is needed to reverse the downtrend. Before getting too bearish, note that the bigger trend for oil remains up and this four week decline still looks corrective on the daily chart.
**************************************************************************
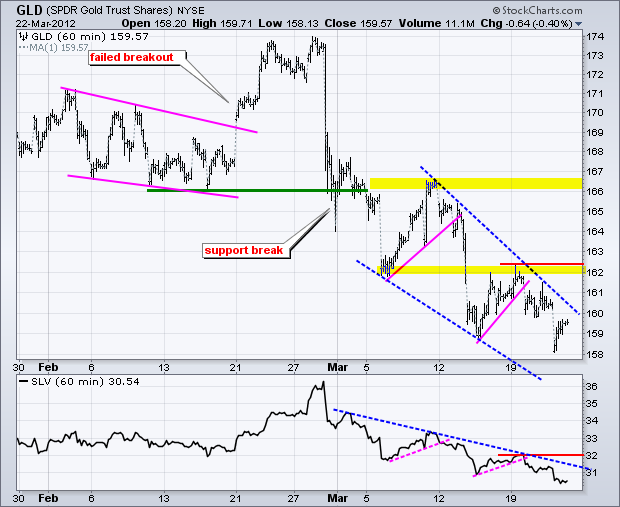
The Gold SPDR (GLD) continued lower and broke below last week's low to extend its downtrend. Longer term, GLD is still near a key retracement (61.80%) on the daily chart. However, gold cannot hold a bid and the trend here is clearly down. Broken support turned resistance and a break above this week's high is needed to reverse the downtrend.
**************************************************************************
Key Economic Reports:
Fri - Mar 23 - 10:00 - New Home Sales
Charts of Interest: Tuesday and Thursday in separate post.
This commentary and charts-of-interest are designed to stimulate thinking. This analysis is not a recommendation to buy, sell, hold or sell short any security (stock ETF or otherwise). We all need to think for ourselves when it comes to trading our own accounts. First, it is the only way to really learn. Second, we are the only ones responsible for our decisions. Think of these charts as food for further analysis. Before making a trade, it is important to have a plan. Plan the trade and trade the plan. Among other things, this includes setting a trigger level, a target area and a stop-loss level. It is also important to plan for three possible price movements: advance, decline or sideways. Have a plan for all three scenarios BEFORE making the trade. Consider possible holding times. And finally, look at overall market conditions and sector/industry performance.

