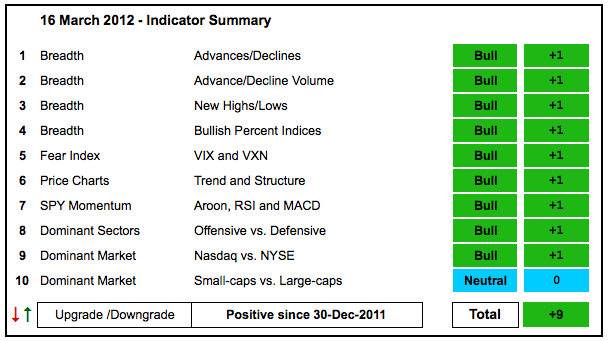
There is no change in the indicator summary. Nine indicators were bullish at the start of the week and nine remain bullish. The AD Volume Lines surged to new highs with a strong move the last seven days. Net New Highs also expanded on both the NYSE and Nasdaq as the advance broadened. With the exception of the small-cap indices, the major indices forged fresh 52-week highs and remain in clear uptrends. Forget about low volume, a few underperforming groups and overbought conditions, the trend is up and there are simply no signs of significant selling pressure.
- AD Lines: Bullish. The Nasdaq AD Line rebounded this week to establish support with the early March low. The NYSE AD Line surged to a new 52-week high this week and remains very strong.
- AD Volume Lines: Bullish. The Nasdaq and NYSE AD Volume Lines surged to new 52-week highs this week and remain in strong uptrends.
- Net New Highs: Bullish. The Nasdaq Cumulative Net New Highs Line has been trending up since the second week of January. The NYSE Cumulative Net New Highs Line has been trending up since the last week of November.
- Bullish Percent Indices: Bullish. All sector BPIs are above 50% and bullish.
- VIX/VXN: Bullish. The CBOE Volatility Index ($VIX) and the Nasdaq 100 Volatility Index ($VXN) hit new lows this week and remain in clear downtrends. Both VIX and VXN are near their April lows. Low volatility means low risk expectations and this is bullish for now.
- Trend-Structure: Bullish. The Nasdaq, Nasdaq 100, NY Composite, S&P 500, S&P 500 Equal Weight Index, S&P MidCap 400 and Dow hit new 52-week highs this week. Only the S&P SmallCap 600 and Russell 2000 have yet to break their February highs.
- SPY Momentum: Bullish. RSI is near the top of its bull range (40-80), the Aroon Oscillator surged back above +50 on 27-Dec and MACD(5,35,5) has been positive since 21-Dec.
- Offensive Sector Performance: Bullish. The Technology SPDR (XLK) and Consumer Discretionary SPDR (XLY) hit new 52-week highs this week, while the Finance SPDR (XLF) led the way with an 8.76% gain the last seven days.
- Nasdaq Performance: Bullish. The $COMPQ:$NYA ratio hit a new 52-week high as the Nasdaq continues to outperform the NY Composite.
- Small-cap Performance: Neutral. The $RUT:$OEX ratio peaked in early February and remains in a six week downtrend. Relative weakness in small-caps during a broad market advance is a concern.
- Breadth Charts (here) and Inter-market charts (here) have been updated.
This table is designed to offer an objective look at current market conditions. It does not aim to pick tops or bottoms. Instead, it seeks to identify noticeable shifts in buying and selling pressure. With 10 indicator groups, the medium-term evidence is unlikely to change drastically overnight.
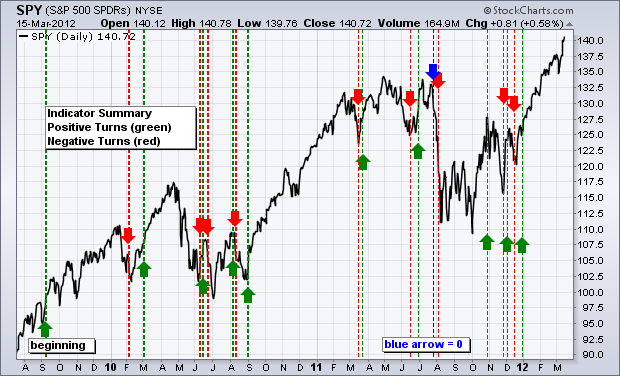
Previous turns include:
Positive on 30-December-11
Negative on 16-December-11
Positive on 3-December-11
Negative on 23-November-11
Positive on 28-October-11
Negative on 5-August-11
Neutral on 29-Jul-11
Positive on 30-Jun-11
Negative on 17-Jun-11
Positive on 25-Mar-11
Negative on 18-Mar-11
Positive on 3-Sep-10
Negative on 13-Aug-10
Positive on 6-Aug-10
Negative on 24-Jun-10
Positive on 18-Jun-10
Negative on 11-Jun-10
Positive on 5-March-10
Negative on 5-Feb-10
Positive on 11-Sept-09


