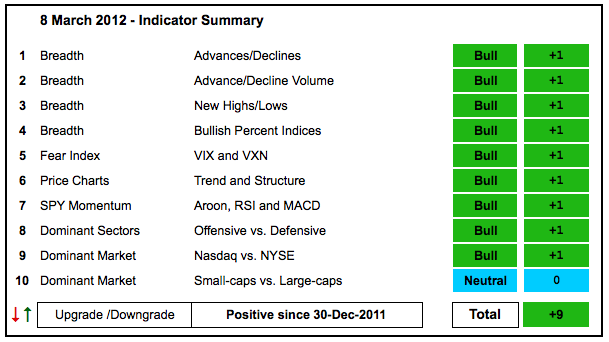
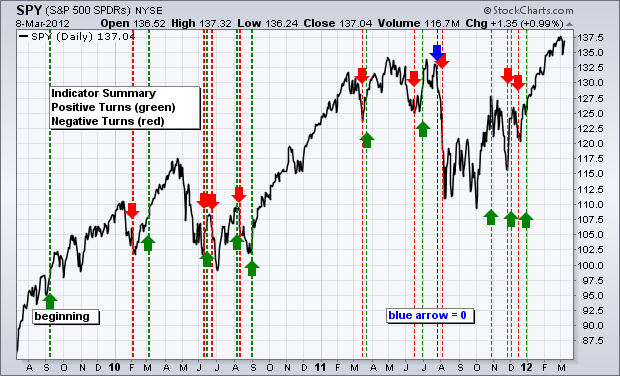
The first selling pressure in some three months hit the stock market this week, but the short 1-3 day decline is a mere blip in the bigger uptrend. Stocks were overbought and some sort of corrective period is perfectly normal. The correction already started for the Russell 2000 ETF (IWM), which peaked in early February. Also note that the Transport iShares (IYT) peaked in early February and the Semiconductor HOLDRS (SMH) peaked in mid February. There are clearly some corrective forces at work within the broader indices. The indicator summary remains unchanged. Relative weakness in small-caps is the only negative on the indicator summary right now.
- AD Lines: Bullish. The Nasdaq AD Line pulled back sharply the last few weeks, but the 125-day EMA of Net Advances remains positive. The NYSE AD Line surged back towards its 52-week high this week.
- AD Volume Lines: Bullish. The Nasdaq and NYSE AD Volume Lines broke above their 2011 highs in early February and remain above these breakouts.
- Net New Highs: Bullish. Nasdaq Net New Highs actually dipped into negative territory on Tuesday, but recovered on Wednesday and the Cumulative Net New Highs Line remains above its 10-day EMA. NYSE Net New Highs remained positive this week and the Cumulative Net New Highs Line continued higher.
- Bullish Percent Indices: Bullish. The BPIs took a hit on Tuesday, but all nine remain well above 50% and bullish overall. This indicator is based on the number of stocks with P&F buy signals and Tuesday's low now holds the key for many of these signals.
- VIX/VXN: Bullish. The CBOE Volatility Index ($VIX) and the Nasdaq 100 Volatility Index ($VXN) are at low levels overall and have been range bound since late January. Low volatility IS positive for stocks because it shows relatively low risk. Keep in mind that VIX and VXN are coincident indicators and a break above the mid February high would be bearish for stocks.
- Trend-Structure: Bullish. The major index ETFs pulled back sharply on Monday-Tuesday, but rebounded on Wednesday-Thursday. All recorded new 52-week highs in February and the bigger trend is clearly up.
- SPY Momentum: Bullish. RSI is in its bull range (40-80), the Aroon Oscillator surged back above +50 on 27-Dec and MACD(5,35,5) has been positive since 21-Dec.
- Offensive Sector Performance: Bullish. The Technology SPDR (XLK) and Consumer Discretionary SPDR (XLY) are by far the strongest sectors. The Finance SPDR (XLF) and the Industrials SPDR (XLI) have stalled somewhat, but have yet to break down and show serious selling pressure.
- Nasdaq Performance: Bullish. The $COMPQ:$NYA ratio broke above its mid December high and techs have been outperforming in 2012.
- Small-cap Performance: Neutral. The $RUT:$OEX ratio has moved sharply lower since early February and small-caps are underperforming large-caps.
- Breadth Charts (here) and Inter-market charts (here) have been updated.
This table is designed to offer an objective look at current market conditions. It does not aim to pick tops or bottoms. Instead, it seeks to identify noticeable shifts in buying and selling pressure. With 10 indicator groups, the medium-term evidence is unlikely to change drastically overnight.
Previous turns include:
Positive on 30-December-11
Negative on 16-December-11
Positive on 3-December-11
Negative on 23-November-11
Positive on 28-October-11
Negative on 5-August-11
Neutral on 29-Jul-11
Positive on 30-Jun-11
Negative on 17-Jun-11
Positive on 25-Mar-11
Negative on 18-Mar-11
Positive on 3-Sep-10
Negative on 13-Aug-10
Positive on 6-Aug-10
Negative on 24-Jun-10
Positive on 18-Jun-10
Negative on 11-Jun-10
Positive on 5-March-10
Negative on 5-Feb-10
Positive on 11-Sept-09


