Art's Charts September 30, 2013 at 06:05 AM
**This chart analysis is for educational purposes only, and should not be construed as a recommendation to buy, sell or sell-short said securities** Stock futures are trading sharply lower as the first government shut down in 17 years looms on the horizon... Read More
Art's Charts September 27, 2013 at 04:24 AM
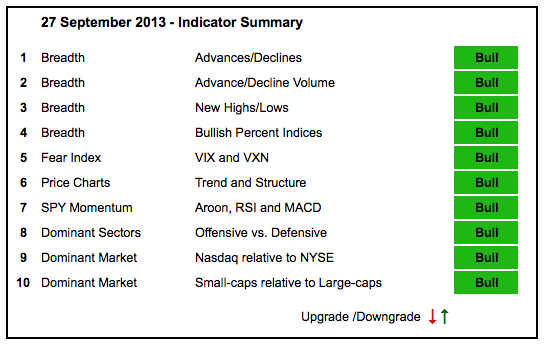
**This chart analysis is for educational purposes only, and should not be construed as a recommendation to buy, sell or sell-short said securities** There is no change in the indicator table. All indicators remain in bull mode as the market remains strong... Read More
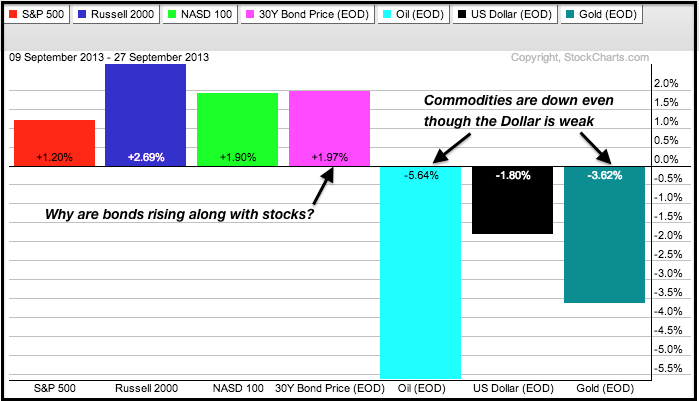
Art's Charts September 27, 2013 at 03:24 AM
**This chart analysis is for educational purposes only, and should not be construed as a recommendation to buy, sell or sell-short said securities** The major index ETFs managed to eek out another gain with the Nasdaq 100 ETF (QQQ) leading the way (+.78%)... Read More
Art's Charts September 26, 2013 at 05:57 AM
**This chart analysis is for educational purposes only, and should not be construed as a recommendation to buy, sell or sell-short said securities** Stocks edged lower with relatively mild selling pressure. The S&P 500 ETF (SPY) fell .26% and the Nasdaq 100 ETF (QQQ) lost ... Read More
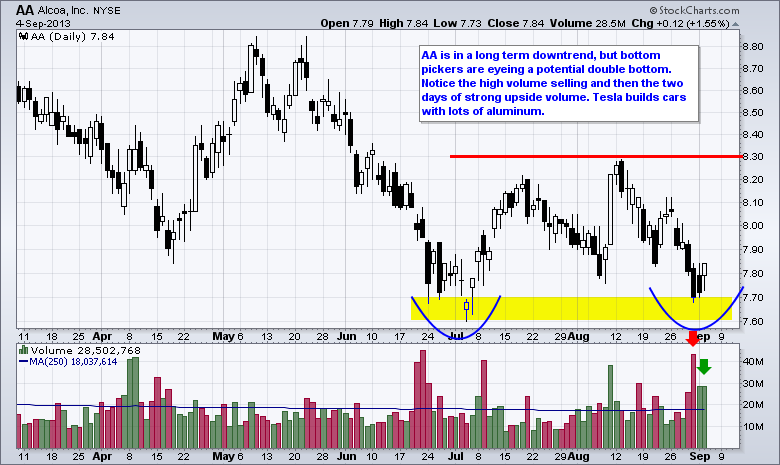
Art's Charts September 26, 2013 at 05:51 AM
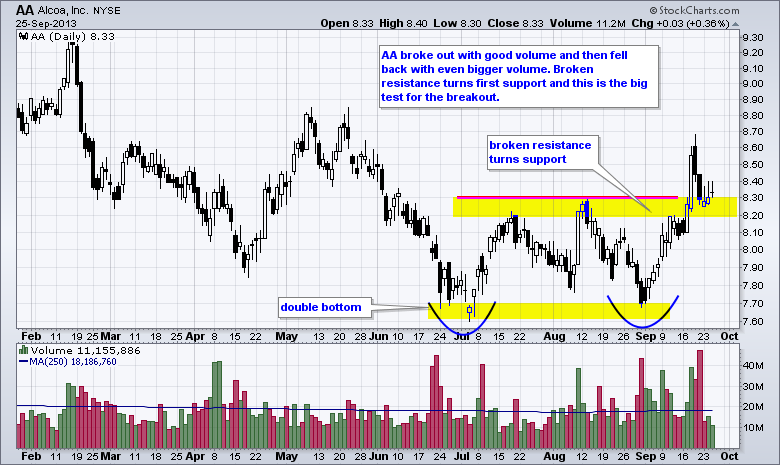
AA gets a Throwback to Broken Resistance. ATVI Underperforms in September. Plus IMMR, SCHL, SLW, SYMC Video is at top. Individual charts are below... Read More
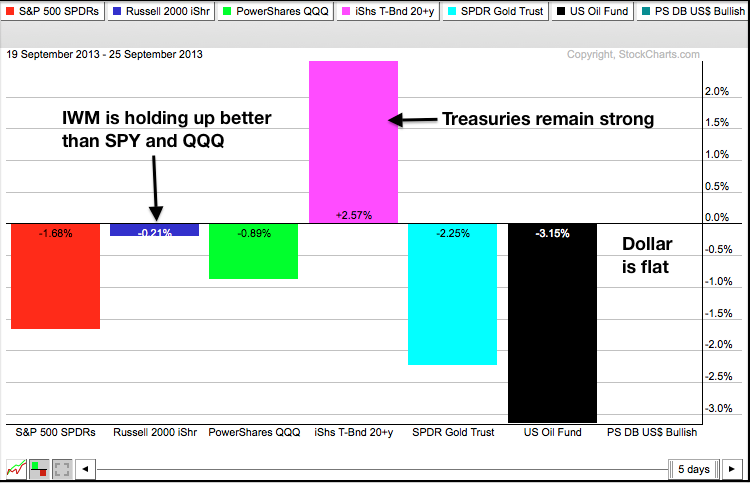
Art's Charts September 25, 2013 at 05:39 AM
Stocks were mixed on Tuesday with the Russell 2000 ETF (IWM) gaining ground, the Dow SPDR (DIA) loosing ground and the S&P 500 ETF (SPY) closing flat. Relative weakness in finance, technology and healthcare weighed on the market... Read More
Art's Charts September 24, 2013 at 07:01 AM
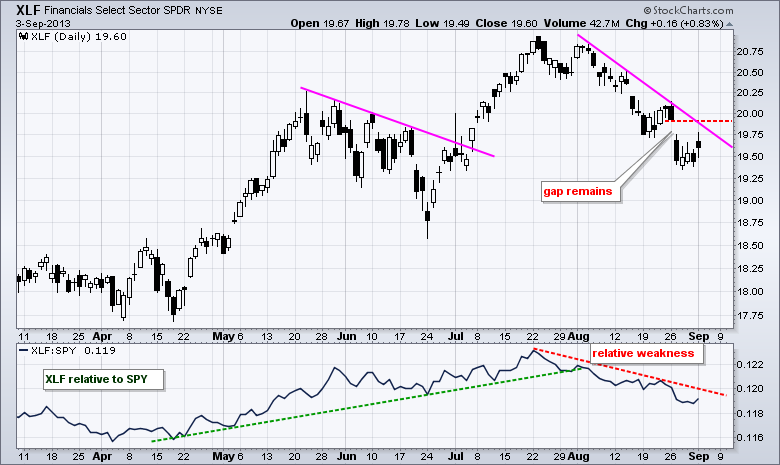
**This chart analysis is for educational purposes only, and should not be construed as a recommendation to buy, sell or sell-short said securities** Stocks were mostly lower on Monday with the finance sector weighing on the broader market. The Finance SPDR (XLF) fell 1... Read More
Art's Charts September 24, 2013 at 06:54 AM
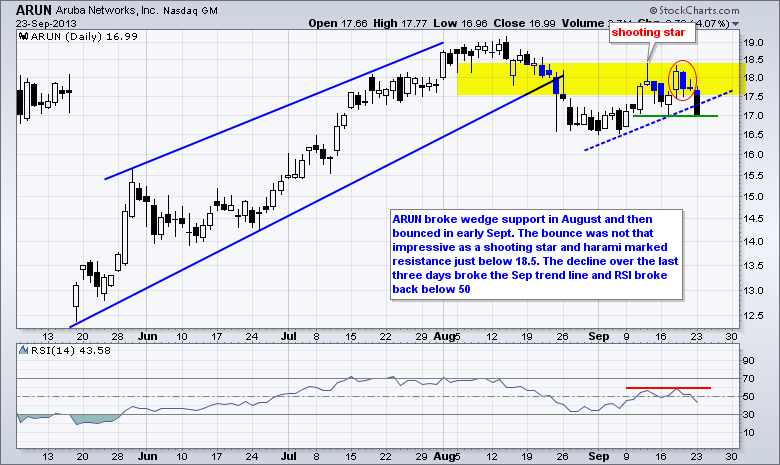
$ARUN Shows Relative Weakness with Support Break. $CLF Forms Trio of Bearish Candlestick Patterns. Plus $DE, $GLW, $NFLX Video is at top. Individual charts are below... Read More
Art's Charts September 23, 2013 at 06:06 AM
**This chart analysis is for educational purposes only, and should not be construed as a recommendation to buy, sell or sell-short said securities** The on-off-on taper talk is back on again. That didn't take long... Read More
Art's Charts September 20, 2013 at 05:08 AM
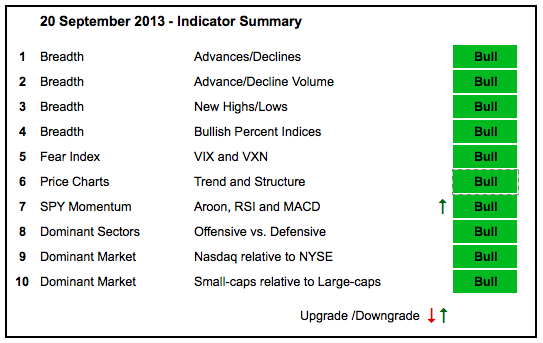
The indicator summary got another upgrade this week as SPY momentum improved. All indicators are in bull mode and the majority have been bullish since early December, which is one long run for bullish technicals... Read More
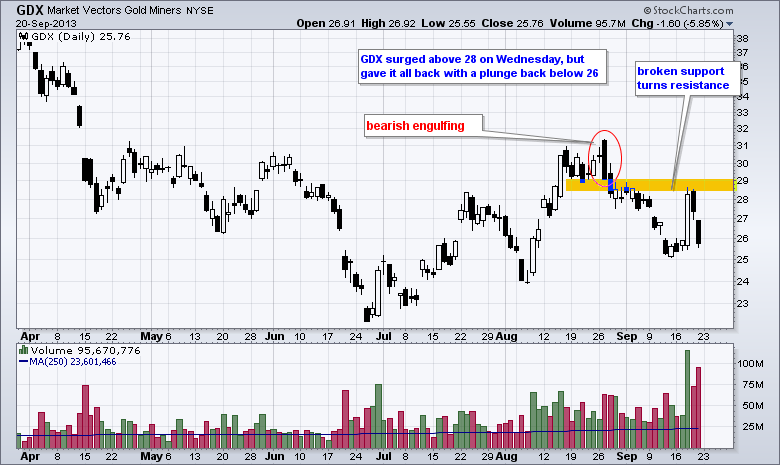
Art's Charts September 20, 2013 at 03:47 AM
**This chart analysis is for educational purposes only, and should not be construed as a recommendation to buy, sell or sell-short said securities** After big moves on Wednesdays, the markets took a breather on Thursday and traded relatively flat... Read More
Art's Charts September 19, 2013 at 07:28 AM
**This chart analysis is for educational purposes only, and should not be construed as a recommendation to buy, sell or sell-short said securities** It is amazing what a mere 10-15 billion Dollars can do. The Fed has been buying $85 billion worth of bonds for months now... Read More
Art's Charts September 19, 2013 at 07:22 AM
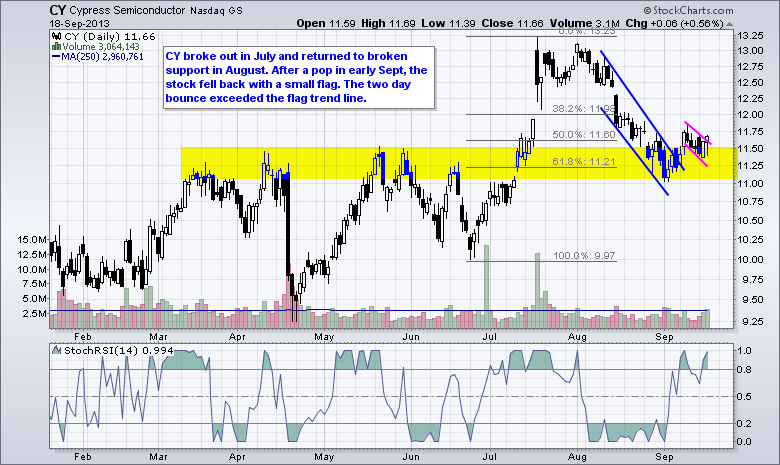
CY Bounces off Broken Support. FSLR Forms Small Inverse HS Pattern. Plus GIS, SCTY, WDC, WY Video is at top. Individual charts are below... Read More
Art's Charts September 18, 2013 at 05:20 AM
**This chart analysis is for educational purposes only, and should not be construed as a recommendation to buy, sell or sell-short said securities** Stocks continued to plow higher as the Russell 2000 ETF (IWM) advanced around 1% and the Nasdaq 100 ETF (QQQ) gained ... Read More
Art's Charts September 17, 2013 at 05:47 AM
**This chart analysis is for educational purposes only, and should not be construed as a recommendation to buy, sell or sell-short said securities** It was pop and drop for the stock market on Monday... Read More
Art's Charts September 17, 2013 at 05:29 AM
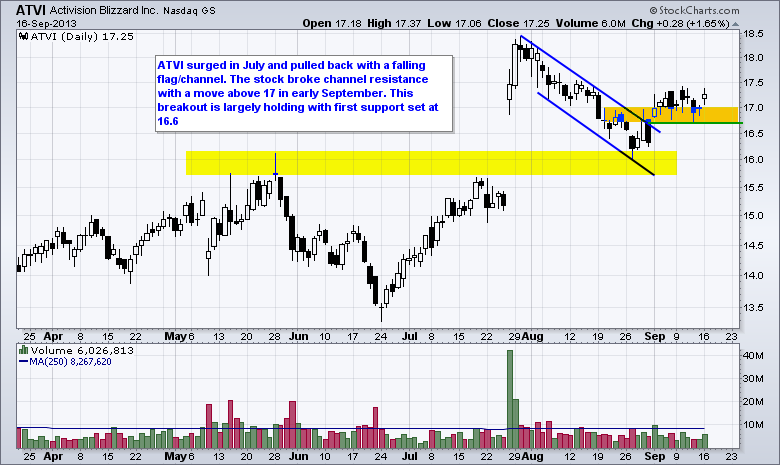
ATVI Holds Channel Breakout. EBAY Shows Relative Weakness. Plus DANG and PMCS Video is at top. Individual charts are below... Read More
Art's Charts September 16, 2013 at 03:59 AM
**This chart analysis is for educational purposes only, and should not be construed as a recommendation to buy, sell or sell-short said securities** Stocks remain strong overall and look to get stronger because S&P 500 futures are trading around 1% higher in pre-market (4AM)... Read More
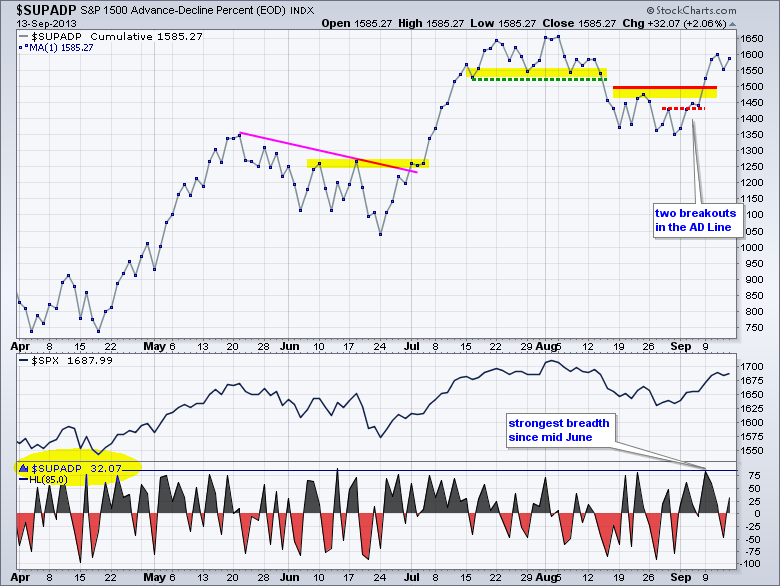
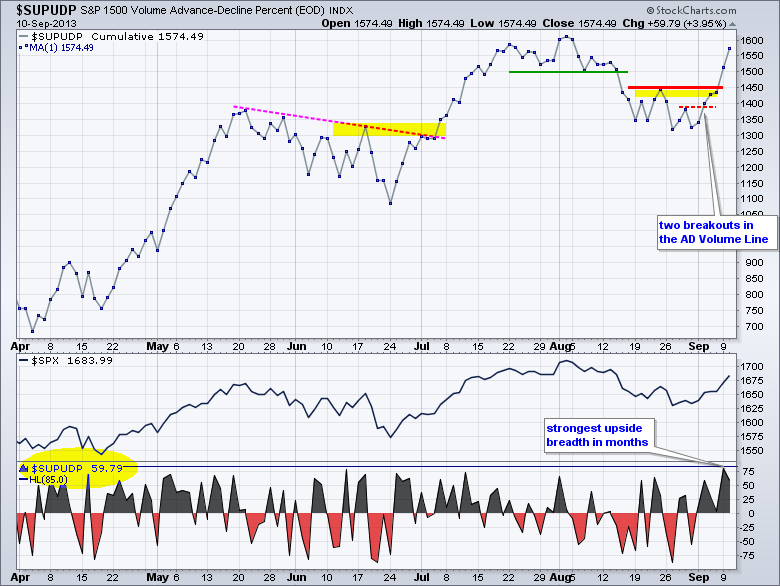
Art's Charts September 13, 2013 at 05:20 AM
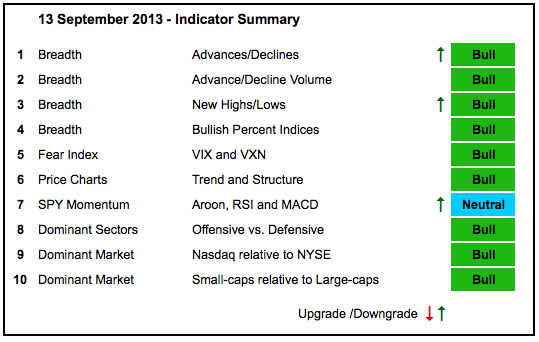
The indicator summary got a few upgrades this week. In particular, we saw an improvement in NYSE breadth. The NYSE AD Line held above its June low and surged over the last two weeks... Read More
Art's Charts September 13, 2013 at 04:10 AM
**This chart analysis is for educational purposes only, and should not be construed as a recommendation to buy, sell or sell-short said securities** Stocks took a breather on Thursday with the major index ETFs edging lower. The Russell 2000 ETF (IWM) led the way with a ... Read More
Art's Charts September 12, 2013 at 05:52 AM
**This chart analysis is for educational purposes only, and should not be construed as a recommendation to buy, sell or sell-short said securities** Stocks were mostly higher on Wednesday, but the gains were small and there were pockets of weakness in the market... Read More
Art's Charts September 12, 2013 at 05:48 AM
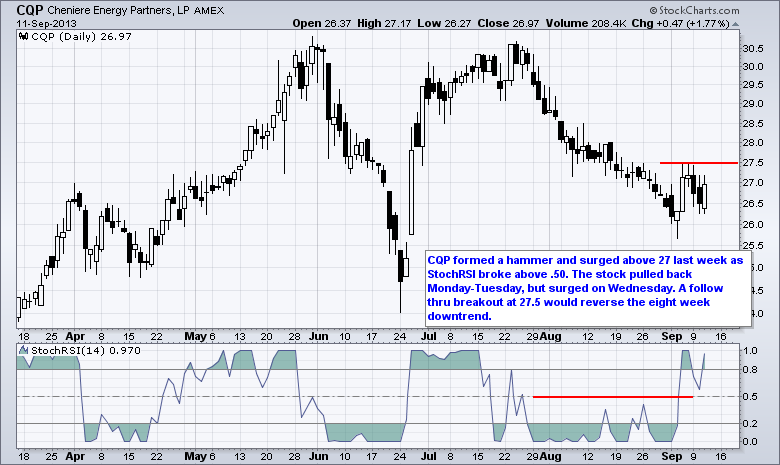
CQP Firms above Prior Low. PFE Bounces off Key Retracement. Plus PEP and SSP Video is at top. Individual charts are below... Read More
Art's Charts September 11, 2013 at 07:02 AM
**This chart analysis is for educational purposes only, and should not be construed as a recommendation to buy, sell or sell-short said securities** Stocks put in another solid performance with the Russell 2000 ETF (IWM) and the S&P MidCap 400 SPDR (MDY) gaining around 1%... Read More
Art's Charts September 10, 2013 at 09:59 AM
**This chart analysis is for educational purposes only, and should not be construed as a recommendation to buy, sell or sell-short said securities** The bulls got into gear on Monday and pushed stocks higher across the board... Read More
Art's Charts September 10, 2013 at 09:54 AM
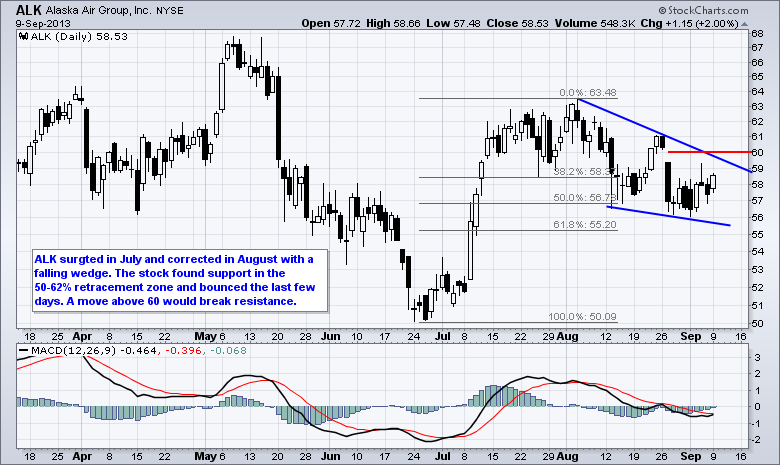
ALK Corrects with Falling Wedge. AZO Lags the Market with Flat Flag. Plus GE, MHK, SXT. Video is at top. Individual charts are below... Read More
Art's Charts September 09, 2013 at 07:34 AM
**This chart analysis is for educational purposes only, and should not be construed as a recommendation to buy, sell or sell-short said securities** Stocks started September with strength as the Nasdaq 100 ETF (QQQ) and the Russell 2000 ETF (IWM) advance around 2% in a shortened ... Read More
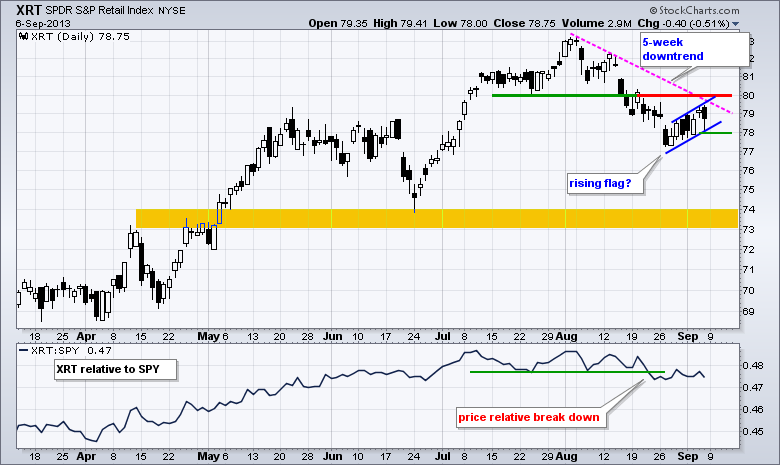
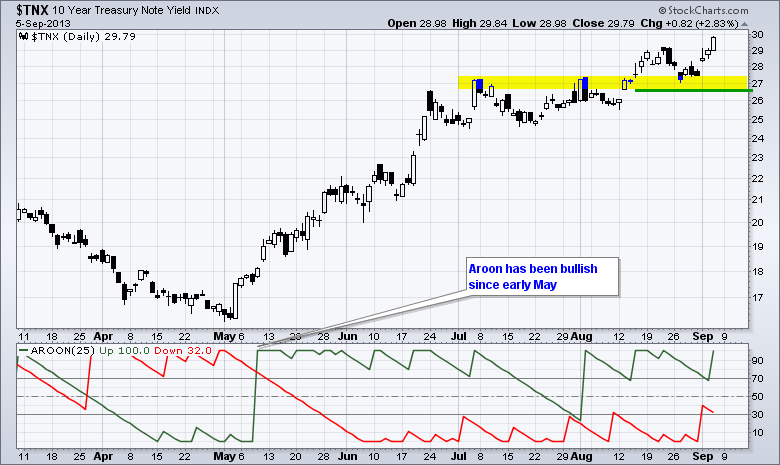
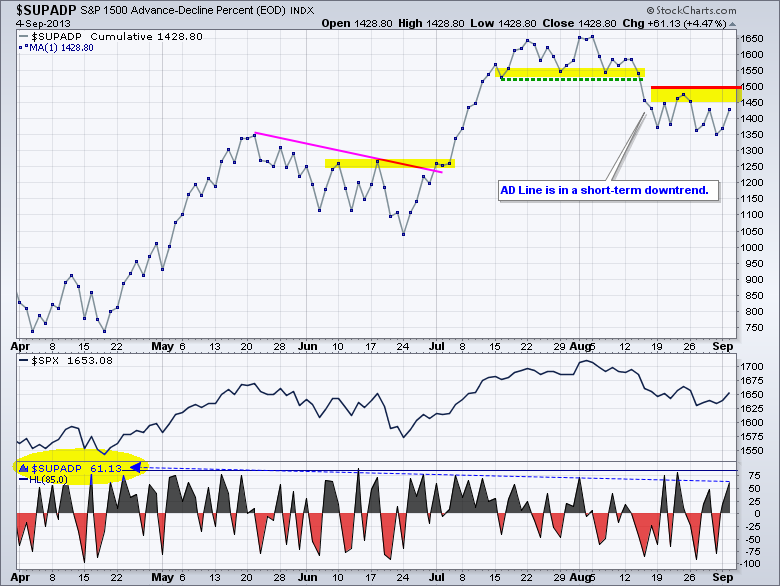
Art's Charts September 06, 2013 at 08:13 AM
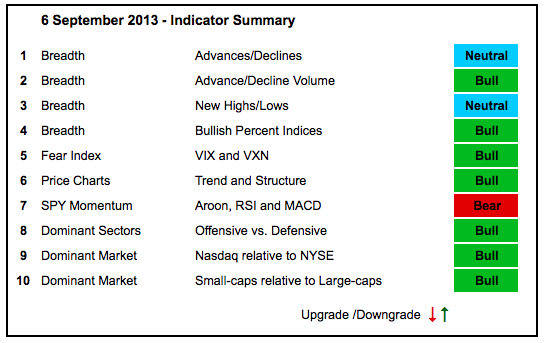
There is no change in the indicator table. Relative weakness in interest rate sensitive stocks is weighing on the NYSE as the NYSE AD Line and NYSE Net New Highs lag their Nasdaq counterparts. Stocks remain in corrective mode, but there are clear pockets of strength out there... Read More
Art's Charts September 06, 2013 at 07:16 AM
**This chart analysis is for educational purposes only, and should not be construed as a recommendation to buy, sell or sell-short said securities** Stocks edged higher with techs leading the way again. The Nasdaq 100 Equal-Weight ETF (QQEW) advanced ... Read More
Art's Charts September 05, 2013 at 08:54 AM
**This chart analysis is for educational purposes only, and should not be construed as a recommendation to buy, sell or sell-short said securities** Techs took the lead on Wednesday with semiconductor and networking stocks scoring nice gains... Read More
Art's Charts September 05, 2013 at 08:47 AM
AKAM Forms Cup-with-handle Pattern. BHI Challenges Wedge Resistance. Plus CME, EXPD, NBR, VMC Video is at top. Individual charts are below... Read More
Art's Charts September 04, 2013 at 08:12 AM
**This chart analysis is for educational purposes only, and should not be construed as a recommendation to buy, sell or sell-short said securities** Stocks got the old pop and drop on Monday. The major index ETFs opened higher on the heels of Asian and European strength... Read More
Art's Charts September 03, 2013 at 09:33 AM
**This chart analysis is for educational purposes only, and should not be construed as a recommendation to buy, sell or sell-short said securities** It is the beginning of the month and stock futures are trading sharply higher this morning. The German DAX Index ($DAX) was up 1... Read More
Art's Charts September 03, 2013 at 09:27 AM
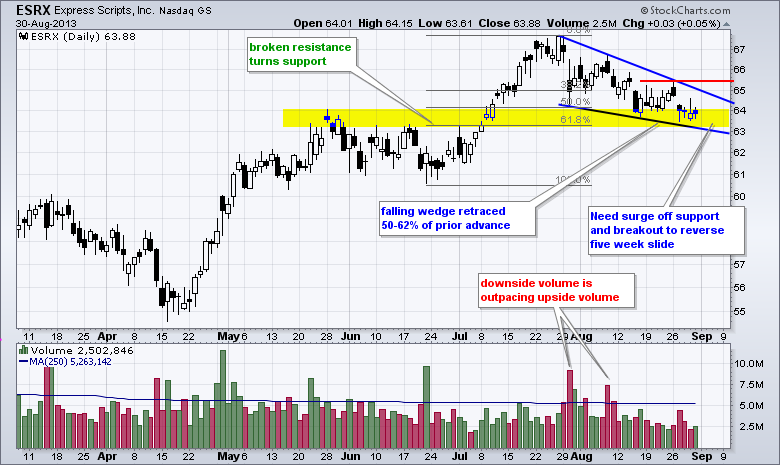
ESRX Corrects with Falling Wedge... Read More