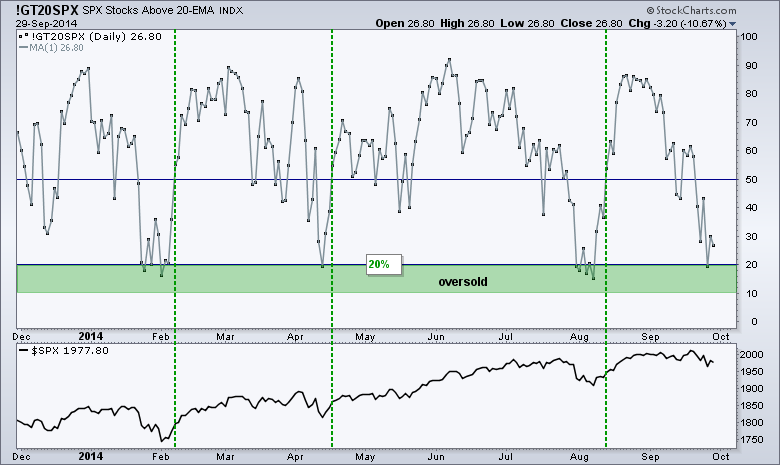
Stocks opened with selling pressure, but buyers stepped in after the first ten minutes and pushed stocks off their lows. Trading was then choppy the rest of the day. The major index ETFs finished with fractional losses. The Russell 2000 Growth iShares (IWO) actually closed with a gain and showed some leadership. Eight of the nine sector SPDRs were down. XLU was the lone gainer. Note, however, that five of the nine small-cap sector ETFs closed up on the day. The Cloud Computing ETF (SKYY), the Internet ETF (FDN) and the Biotech SPDR (XBI) were all up as well. The chart below shows the percentage of S&P 500 stocks above their 20-day EMA (!GT20SPX). This indicator dipped below 20 to become oversold last week. Subsequent surges above 50% provided three good signals this year (green dotted lines). This is something I will be watching for signs that the correction could be ending.
**This chart analysis is for educational purposes only, and should not
be construed as a recommendation to buy, sell or sell-short said securities**
**************************************************************
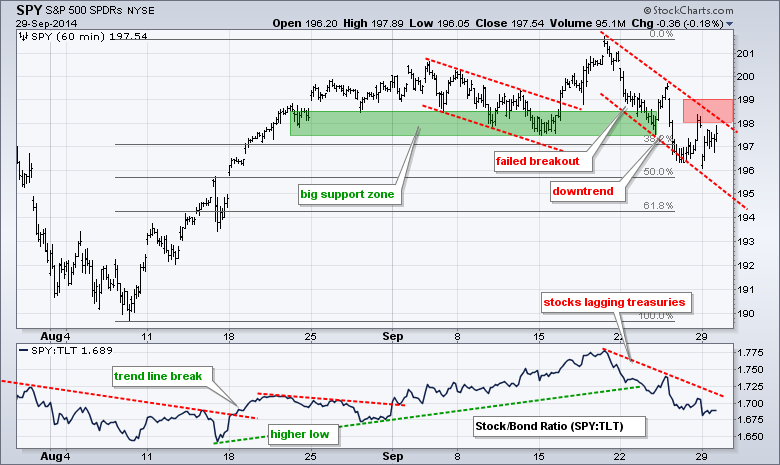
The SPY chart is pretty simple. The long-term trend is up and the short-term trend is down (since last week). The decline looks like a falling flag with resistance marked at 199. A breakout here would reverse the slide and signal a continuation of the bigger uptrend. SPY has underperformed TLT the last two weeks as the SPY:TLT ratio fell. A breakout at 1.725 would reverse the two week decline and signal a return to relative strength in SPY.
**************************************************************
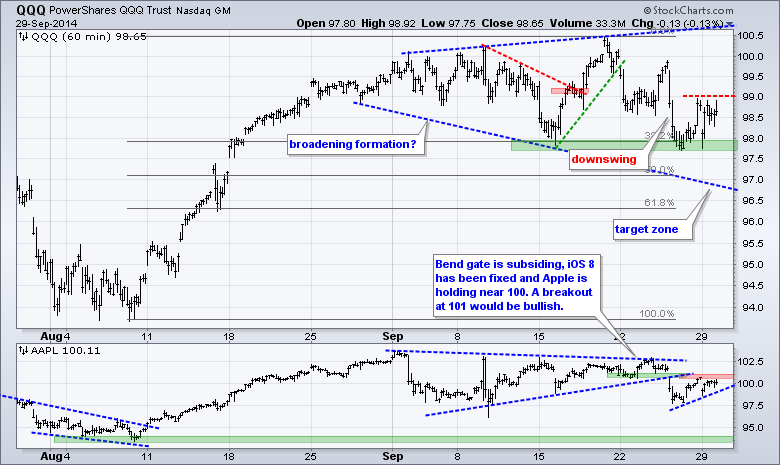
The downswing remains in place since last week, but QQQ got a bounce off support from the mid September low last week and successfully tested this area on Monday. Notice how QQQ opened weak and closed above 98.5. Follow through above 99 would be quite positive. Note that QQQ shows relative strength because it held its mid September low. In contrast, SPY, MDY, IWM, IJR and RSP did not.
**************************************************************
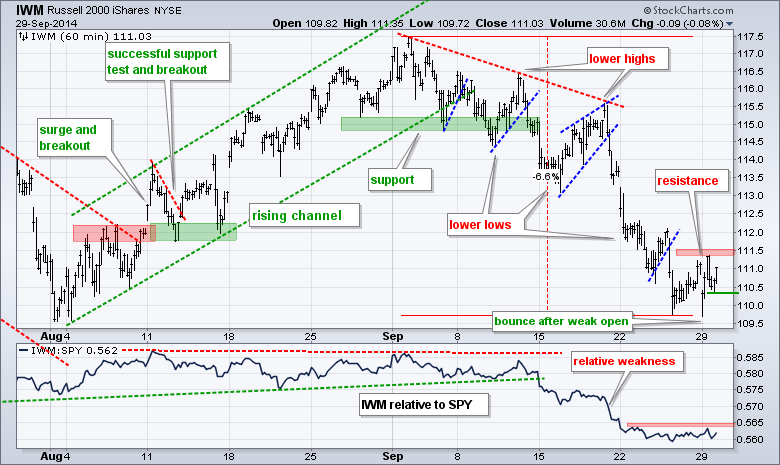
IWM is near the early August low and showing some signs of firmness. The ETF bounced late last week, opened weak on Monday and immediately bounced above 111. The ETF was also quite oversold after a 6.6% decline in less than four weeks. I am lowering resistance to 111.5. A breakout here would provide the first sign of strength. I would, however, keep support tight (110.3) because a strong breakout should hold and never look back.
**************************************************************
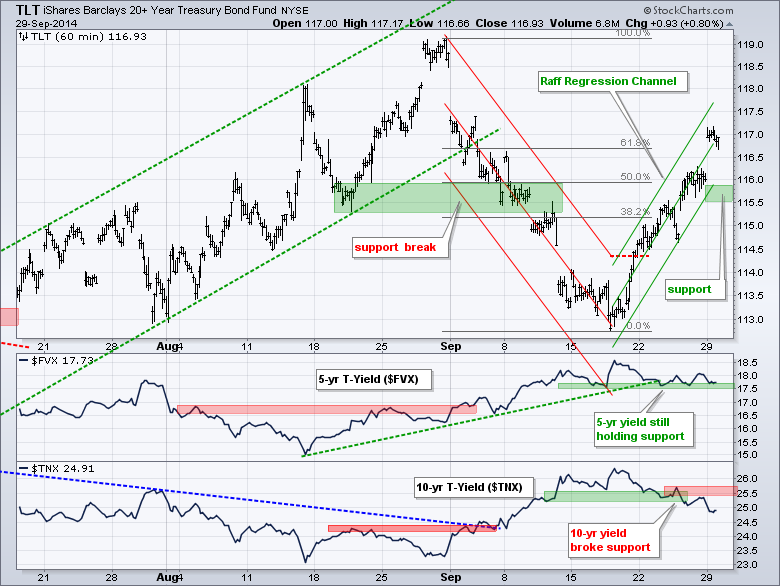
TLT remains in an upswing and this move exceeded the 62% retracement on Monday. Geopolitics got the blame. Hong Kong is all over the news, the Middle East is ongoing and Russia-Ukraine is heating up again. Geopolitics are certainly important, but this week's economic reports will likely be the real drivers and I expect most of them to be positive. At present, a Raff Regression Channel defines the current upswing. Adding a little buffer, I am marking key support at 115.5. The 10-YR Treasury Yield ($TNX) is trending lower and I am marking resistance at 2.565% (25.65 on the chart).
**************************************************************
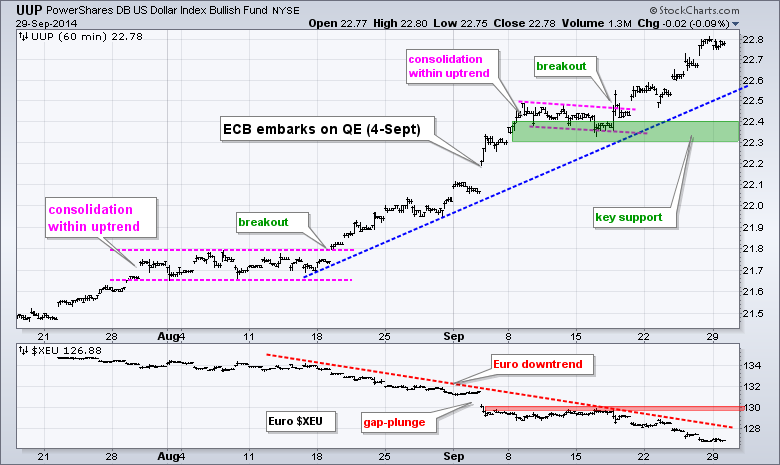
No change. UUP hit new highs for the move last week and remains in a strong uptrend. The mid September lows mark key support in the 22.3-22.4 area. The Euro Index ($XEU) is in a strong downtrend, which accelerated on 4-Sep when the European Central Bank (ECB) embarked on quantitative easing. The mid September highs mark resistance at 130.
**************************************************************
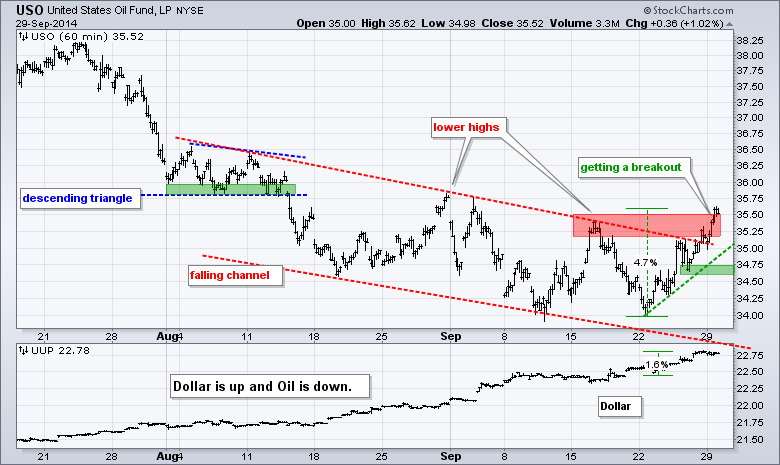
USO is making a breakout bid with a move above 35.50. Notice that oil is up over 4% the past week and the Dollar is also up. It seems that oil is ignoring the Dollar for now. Perhaps geopolitics are playing a role. Even though this breakout is bullish, I am going to keep support fairly tight and a move below Thursday low (34.6) would negate the breakout.
**************************************************************
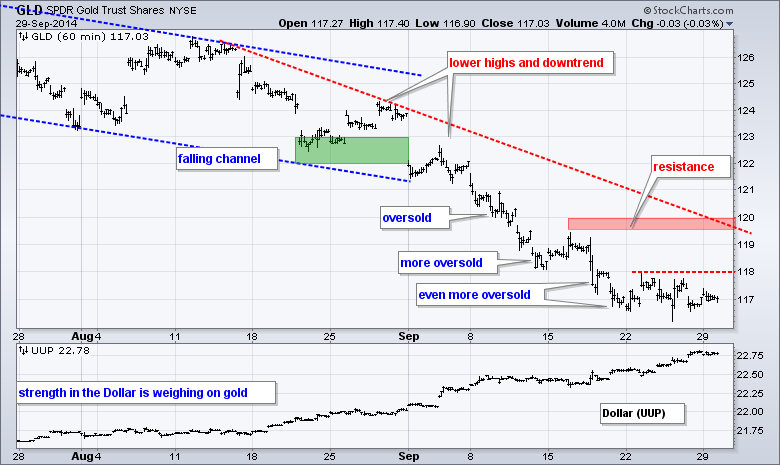
No change. GLD became even more oversold with the move below 117 on 19-Sep and then stalled. Last week's highs mark first resistance at 118 and a break out here would provide the first signal for an oversold bounce. I would not turn short-term bullish because an oversold bounce can be expected at some point. The mid August trend line, mid September high and a buffer mark resistance at 120.
***************************************************************
Key Reports and Events (all times Eastern):
Tue - Sep 30 - 09:00 - Case-Shiller Housing Index
Tue - Sep 30 - 09:45 - Chicago PMI
Tue - Sep 30 - 10:00 - Consumer Confidence
Wed - Oct 01 - 07:00 - MBA Mortgage Index
Wed - Oct 01 - 08:15 - ADP Employment
Wed - Oct 01 - 10:00 - ISM Manufacturing Index
Wed - Oct 01 - 10:00 - Construction Spending
Wed - Oct 01 - 10:30 - Crude Inventories
Wed - Oct 01 - 14:00 - Auto Sales/Truck Sales
Thu - Oct 02 - 07:30 - Challenger Job Report
Thu - Oct 02 - 08:30 - Initial Jobless Claims
Thu - Oct 02 - 10:00 - Factory Orders
Thu - Oct 02 - 10:30 - Natural Gas Inventories
Fri - Oct 03 - 08:30 - Employment Report
Fri - Oct 03 - 10:00 - ISM Services Index
Chart Setups on Tuesday and Thursday.
This commentary and charts-of-interest are designed to stimulate thinking. This analysis is not a recommendation to buy, sell, hold or sell short any security (stock ETF or otherwise). We all need to think for ourselves when it comes to trading our own accounts. First, it is the only way to really learn. Second, we are the only ones responsible for our decisions. Think of these charts as food for further analysis. Before making a trade, it is important to have a plan. Plan the trade and trade the plan. Among other things, this includes setting a trigger level, a target area and a stop-loss level. It is also important to plan for three possible price movements: advance, decline or sideways. Have a plan for all three scenarios BEFORE making the trade. Consider possible holding times. And finally, look at overall market conditions and sector/industry performance.


