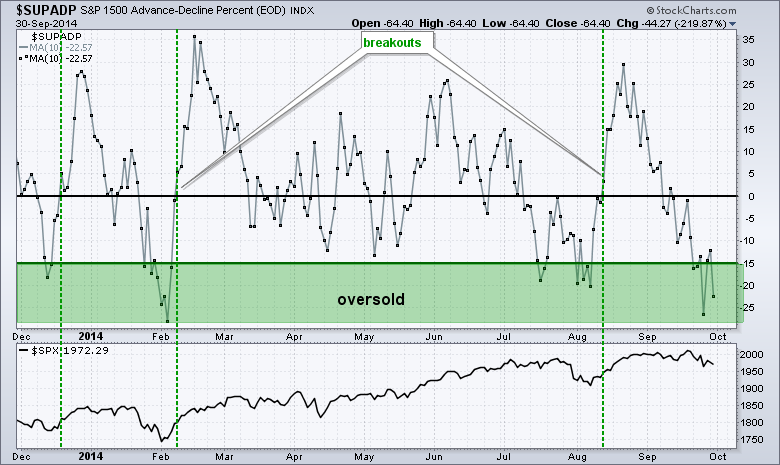
The song remains the same. Market performance deteriorated as we moved down in market cap on Tuesday. The S&P 500 SPDR (SPY) declined .26%, the S&P MidCap SPDR (MDY) fell .89% and the Russell 2000 iShares (IWM) lost 1.51%. Large-caps are the only bastion of strength in the market right now. Six of the nine sector SPDRs were down with materials and energy leading the way lower. The Home Construction iShares (ITB) and the Retail SPDR (XRT) weighed on the consumer discretionary sector. Mining and oil stocks got hammered as gold, platinum, silver and oil fell. I have been showing some breadth indicators to get an idea of a bottom, but they remain oversold and short-term bearish right now. The chart below shows the 10-day SMA for AD Percent for the S&P 1500. This is a broad breadth oscillator that becomes oversold with a move below -15%. A bull signal triggers with a subsequent move above zero. The last bullish signals were December, February and August. The indicator is now below -20% and the most oversold since February.
**This chart analysis is for educational purposes only, and should not
be construed as a recommendation to buy, sell or sell-short said securities**
**************************************************************
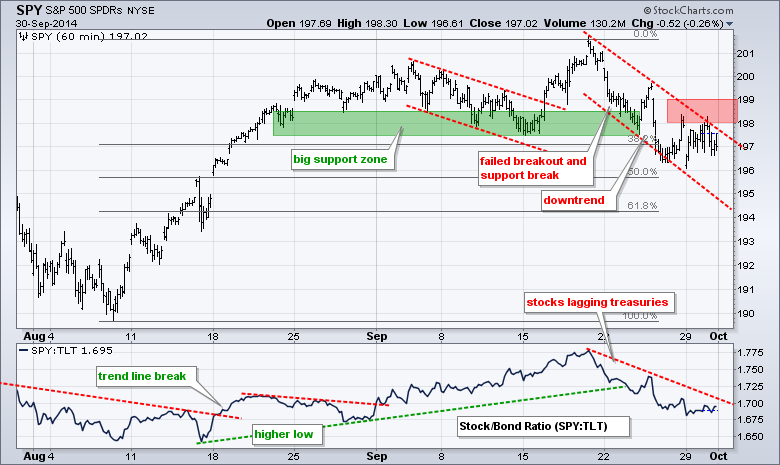
No change. The SPY chart is pretty simple. The long-term trend is up and the short-term trend is down (since last week). The decline looks like a falling flag with resistance marked at 199. A breakout here would reverse the slide and signal a continuation of the bigger uptrend. SPY has underperformed TLT the last two weeks as the SPY:TLT ratio fell. A breakout at 1.725 would reverse the two week decline and signal a return to relative strength in SPY.
**************************************************************
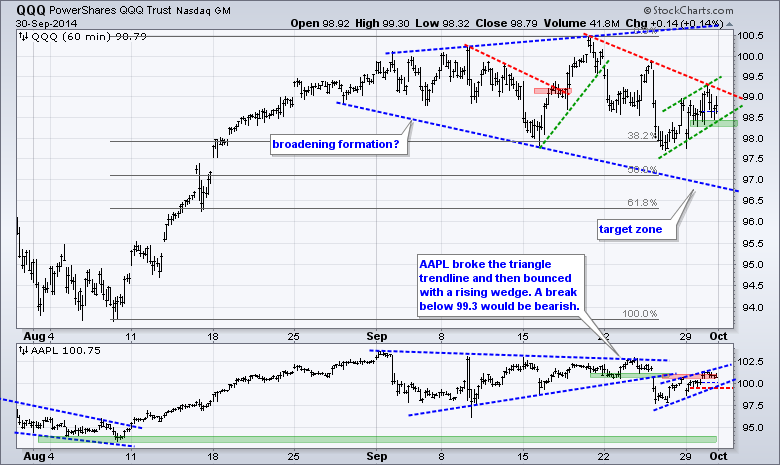
QQQ moved above 99 in late August and has moved above/below this level a dozen times. It is a big consolidation that looks like a broadening formation. This simply means the swings are widening. The ETF bounced the last few days, but it seems as if the swing since mid September is down. The green trend lines mark a rising flag of sorts and a break below 98.3 would be bearish.
**************************************************************
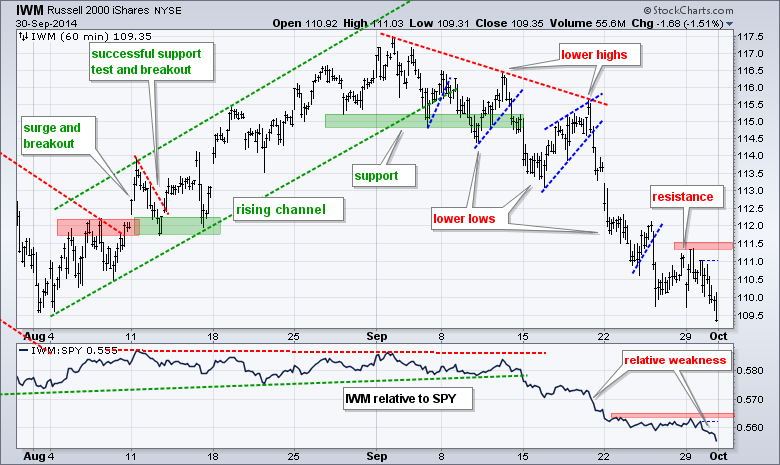
IWM tried to firm and failed yet again. The ETF failed to break resistance at 111.5 and broke to new lows for the move on Tuesday. This affirms the downtrend and key resistance at 111.5. The price relative also broke to new lows as IWM continued to underperform SPY.
**************************************************************
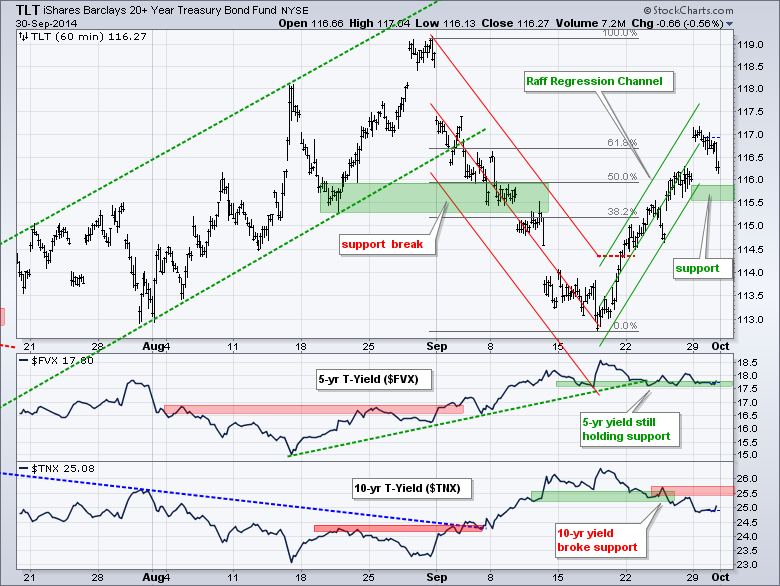
No change. TLT remains in an upswing and this move exceeded the 62% retracement on Monday. Geopolitics gets part of the blame. Hong Kong is all over the news, the Middle East is ongoing and Russia-Ukraine is heating up again. Geopolitics are certainly important, but this week's economic reports will likely be the real drivers and I expect most of them to be positive. At present, a Raff Regression Channel defines the current upswing. Adding a little buffer, I am marking key support at 115.5. The 10-YR Treasury Yield ($TNX) is trending lower and I am marking resistance at 2.565% (25.65 on the chart).
**************************************************************
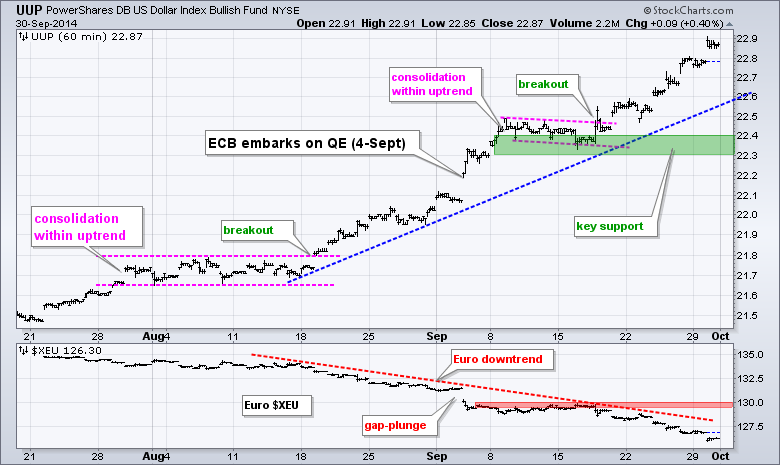
No change. UUP hit new highs for the move last week and remains in a strong uptrend. The mid September lows mark key support in the 22.3-22.4 area. The Euro Index ($XEU) is in a strong downtrend, which accelerated on 4-Sep when the European Central Bank (ECB) embarked on quantitative easing. The mid September highs mark resistance at 130.
**************************************************************
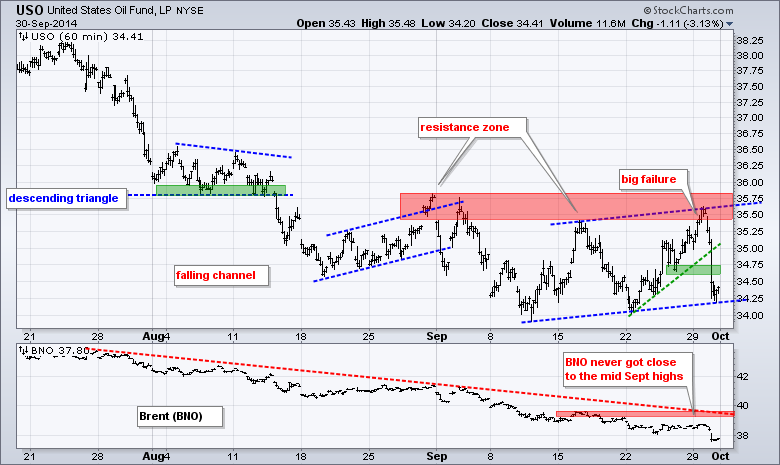
USO poked its head above the mid September high and then promptly reversed course with a 3+ percent decline. Supply concerns got the blame. Higher output from Saudi Arabia and Libya pushed supply to 31 million barrels, versus OPEC's demand estimate of 29.2 million. The math is clear: supply > demand. USO broke upswing support to affirm the downtrend. The indicator window shows the US Brent Oil ETF (BNO) never making it to its mid September high and moving below 38. Oil is global and weakness in $BRENT was a warning that the bounce in USO would not hold. Yes, this is hindsight, but we can use this information in the future.
**************************************************************
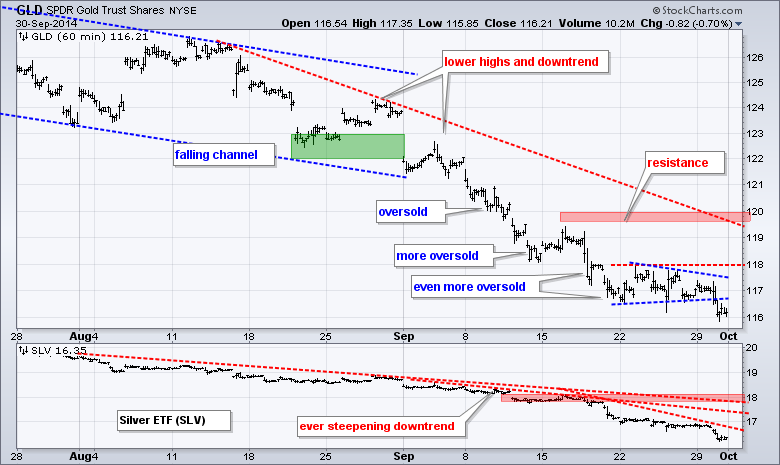
GLD cannot hold a bid to save its life. The ETF became oversold in mid September, stalled for a week and then broke consolidation support this week. Chartists can mark first resistance at 118. I will leave key resistance at 120. The indicator window shows the Silver ETF (SLV) within an accelerating downtrend. Notice how the red trend lines get steeper and steeper. First resistance is set at 17 and key resistance is set at 18.2.
***************************************************************
Key Reports and Events (all times Eastern):
Wed - Oct 01 - 07:00 - MBA Mortgage Index
Wed - Oct 01 - 08:15 - ADP Employment
Wed - Oct 01 - 10:00 - ISM Manufacturing Index
Wed - Oct 01 - 10:00 - Construction Spending
Wed - Oct 01 - 10:30 - Crude Inventories
Wed - Oct 01 - 14:00 - Auto Sales/Truck Sales
Thu - Oct 02 - 07:30 - Challenger Job Report
Thu - Oct 02 - 08:30 - Initial Jobless Claims
Thu - Oct 02 - 10:00 - Factory Orders
Thu - Oct 02 - 10:30 - Natural Gas Inventories
Fri - Oct 03 - 08:30 - Employment Report
Fri - Oct 03 - 10:00 - ISM Services Index
Chart Setups on Tuesday and Thursday.
This commentary and charts-of-interest are designed to stimulate thinking. This analysis is not a recommendation to buy, sell, hold or sell short any security (stock ETF or otherwise). We all need to think for ourselves when it comes to trading our own accounts. First, it is the only way to really learn. Second, we are the only ones responsible for our decisions. Think of these charts as food for further analysis. Before making a trade, it is important to have a plan. Plan the trade and trade the plan. Among other things, this includes setting a trigger level, a target area and a stop-loss level. It is also important to plan for three possible price movements: advance, decline or sideways. Have a plan for all three scenarios BEFORE making the trade. Consider possible holding times. And finally, look at overall market conditions and sector/industry performance.


