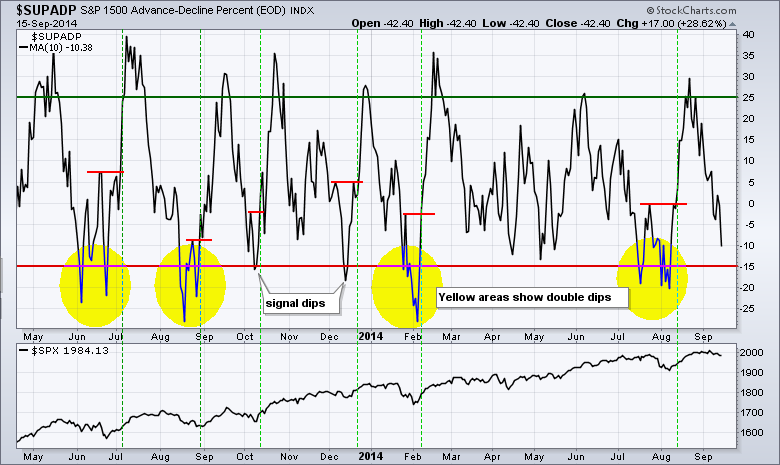
Stocks started the day weak and finished weak, except for some large-caps. The Russell 2000 iShares and Nasdaq 100 ETF led the market lower with 1% declines. The Dow Diamonds and S&P 100 ETF bucked the selling pressure to finish with fractional gains. The sector SPDRs were mixed with five down and four up. Energy got an oversold bounce, while utilities and consumer staples benefitted from a flight to safety. In an interesting twist, the Home Construction iShares bucked the selling pressure and closed slightly higher. The bulk of the selling pressure hit the momentum names as investors made adjustments for a less accommodative Fed. In addition to small-caps, internet, solar, semiconductor, telecom and biotech stocks were sharply lower. The selling pressure was pretty intense and this correction may have further room to run. The chart below shows the 10-day SMA of AD Percent for the S&P 1500. Dips below -15% signal oversold conditions that could lead to a bottom. Three things are required for a bullish signal. First, a dip below -15% to create a short-term oversold condition. Second, a prior high or bounce that produces a peak. Third, a break above that peak to signal improving breadth. Over the last 18 months, we have seen four double dips signals and two single dip signals. The indicator remains above -15% and this suggest we could have further room to correct.
**This chart analysis is for educational purposes only, and should not
be construed as a recommendation to buy, sell or sell-short said securities**
**************************************************************
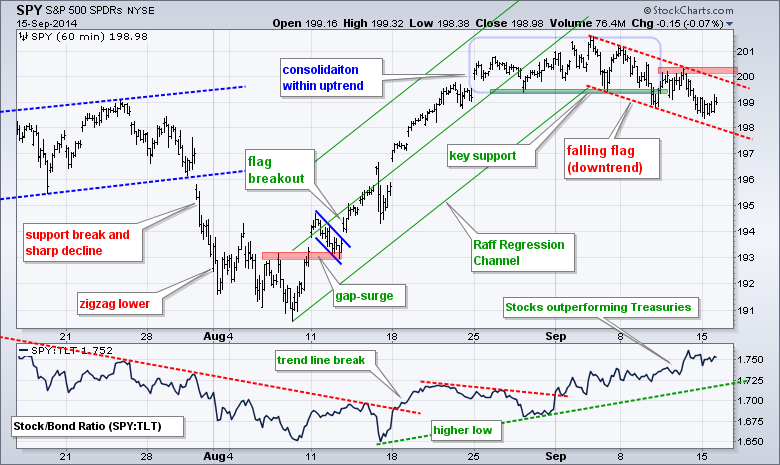
No change. SPY peaked above 201 in early September and worked its way lower with a move to the 199 area. The downswing looks like a falling flag, which is a bullish continuation pattern. The upper trend line, Thursday's peak and a small buffer mark resistance at 200.50. A breakout here would signal an end to the correction and a resumption of the uptrend. The indicator window shows SPY outperforming TLT since mid August. This is positive for stocks.
**************************************************************
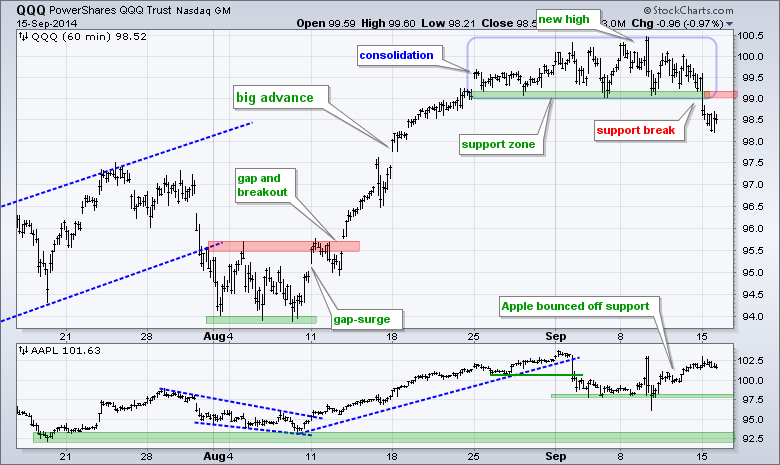
Apple remains lofty, but a few of the other 99 stocks in the Nasdaq 100 ETF (QQQ) weighed as the ETF broke support at 99. This break is short-term bearish and it puts QQQ in line with the downtrends in SPY and IWM. Even though I consider it a correction within a bigger uptrend, I will respect the immediate downtrends until proven otherwise. Broken support turns first resistance in the 99 area.
**************************************************************
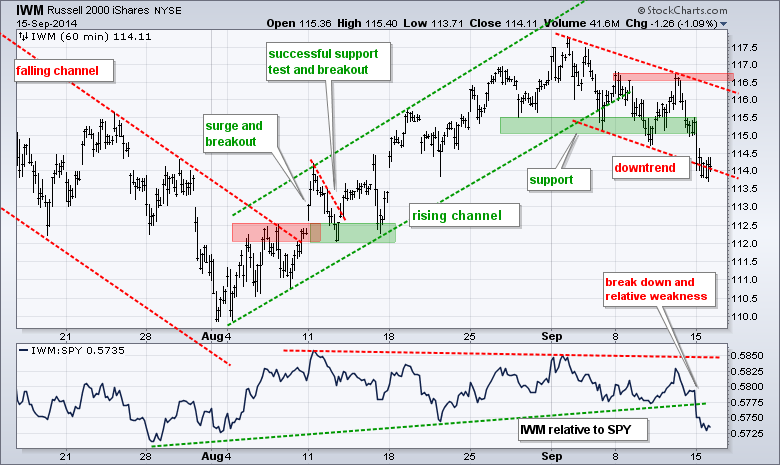
IWM led the market lower on Monday with a 1.09% decline. The ETF opened weak with a move to the lower trend line of the falling flag and remained weak. Further weakness would negate the falling flag, but extend the overall downtrend. Key resistance remains in the 116.5-116.7 area. The indicator window shows the price relative (IWM:SPY ratio) breaking down.
**************************************************************
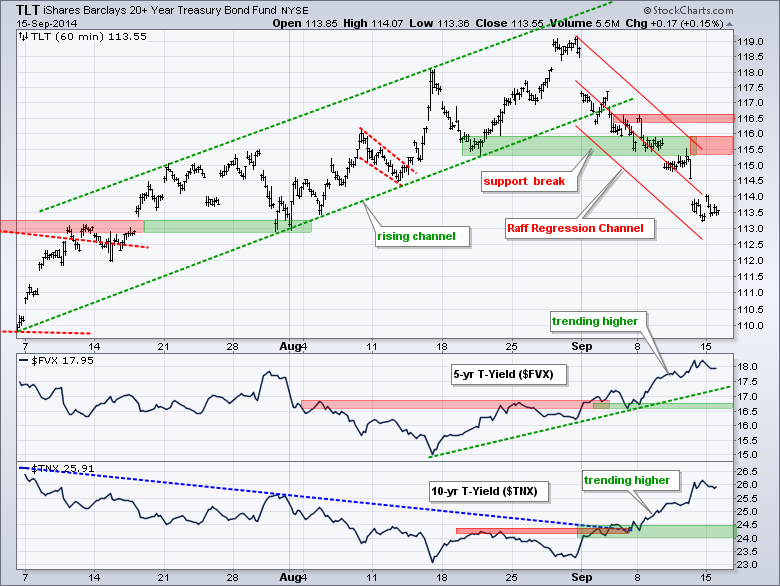
No change. TLT broke support with a sharp decline this month. Even though the ETF is short-term oversold after a 4+ percent decline, the short-term trend is down and I am marking key resistance in the 116.5 area. Further down, we could see an oversold bounce back to broken support in the 115.5 area. The indicator windows show the 5-year Treasury Yield ($FVX) moving above its July high and the 10-YR Treasury Yield ($TNX) moving above 2.6%.
**************************************************************
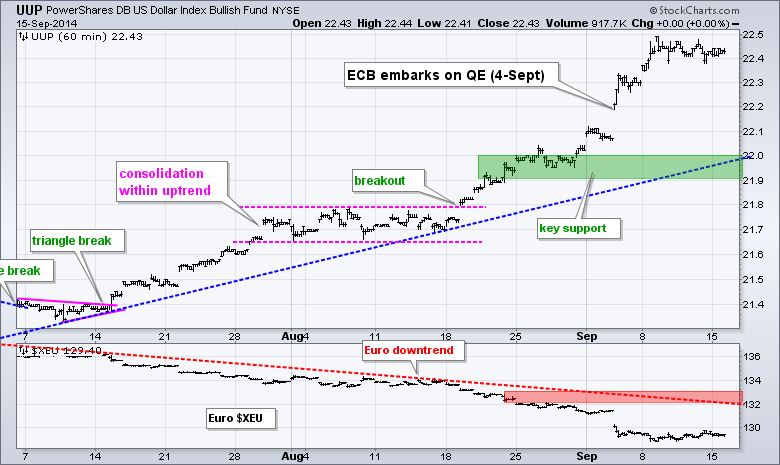
No change. Mark that date. On September 5th, 2014, the European Central Bank (ECB) embarked on quantitative easing. We have seen what happened to the Dollar during QE and it is not the Euro's turn (and the Yen). The US is winding down QE, while the other two are ramping up. The Euro Index ($XEU) plunged over 1% and hit a fresh 52-week low. Key support is set at 21.90.
**************************************************************
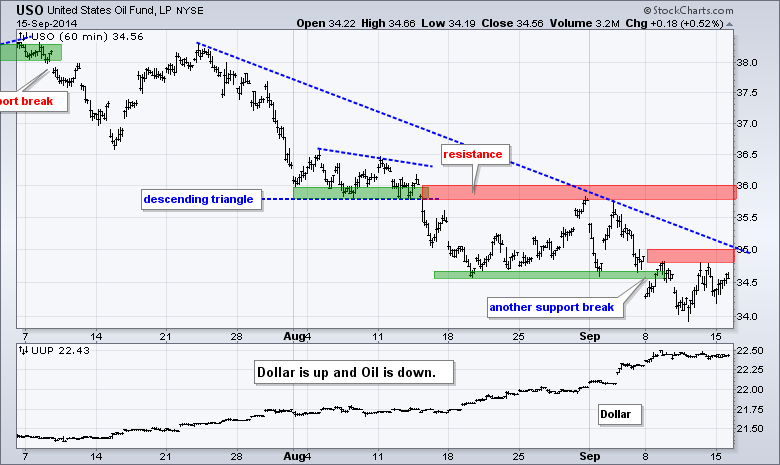
No change. The USO Oil Fund (USO) broke yet another support level and hit a new low for the move. Last week's highs mark first resistance in the 35 area. A quick move above this level would suggest a bear trap, but it would not be enough to reverse the overall downtrend. I am keeping key resistance at 36. Strength in the Dollar is contributing to weakness in oil.
**************************************************************
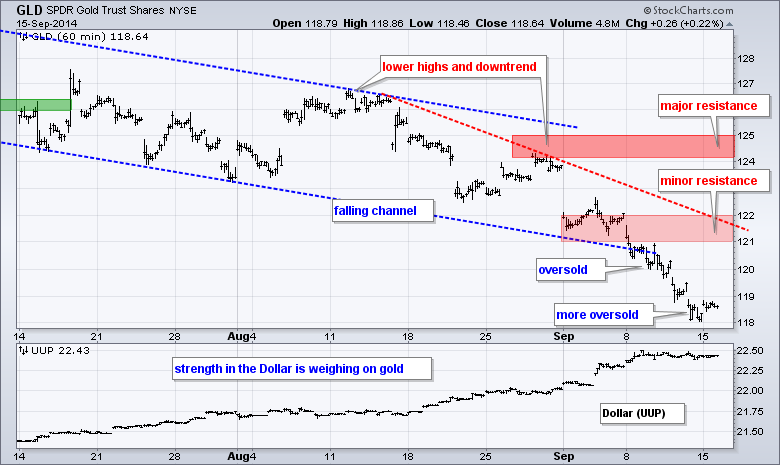
No change. The Gold SPDR (GLD) started the week oversold and near the lower trend line of the falling channel. GLD ended the week even more oversold and well below the channel trend line. This is a classic case of becoming oversold and remaining oversold. If having to pick first resistance, I would user the early September lows and the mid August trend line to mark it in the 121-122 area. I will mark key resistance at 125.
***************************************************************
Key Reports and Events (all times Eastern):
Mon - Sep 15 - 09:15 - Industrial Production
Tue - Sep 16 - 08:30 - Producer Price Index (PPI)
Wed - Sep 17 - 07:00 - MBA Mortgage Index
Wed - Sep 17 - 08:30 - Consumer Price Index (CPI)
Wed - Sep 17 - 08:30 - Current Account Balance
Wed - Sep 17 - 10:00 - NAHB Housing Market Index
Wed - Sep 17 - 10:30 - Crude Oil Inventories
Wed - Sep 17 - 14:00 - FOMC Policy Statement
Thu - Sep 18 - 08:30 - Initial Jobless Claims
Thu - Sep 18 - 08:30 - Housing Starts/Building Permits
Thu - Sep 18 - 10:00 - Philadelphia Fed
Thu - Sep 18 - 10:30 - Natural Gas Inventories
Thu - Sep 18 - 09:00 - Scottish Referendum
Fri - Sep 19 - 10:00 - Leading Economic Indicators
Chart Setups on Tuesday and Thursday.

This commentary and charts-of-interest are designed to stimulate thinking. This analysis is not a recommendation to buy, sell, hold or sell short any security (stock ETF or otherwise). We all need to think for ourselves when it comes to trading our own accounts. First, it is the only way to really learn. Second, we are the only ones responsible for our decisions. Think of these charts as food for further analysis. Before making a trade, it is important to have a plan. Plan the trade and trade the plan. Among other things, this includes setting a trigger level, a target area and a stop-loss level. It is also important to plan for three possible price movements: advance, decline or sideways. Have a plan for all three scenarios BEFORE making the trade. Consider possible holding times. And finally, look at overall market conditions and sector/industry performance.


