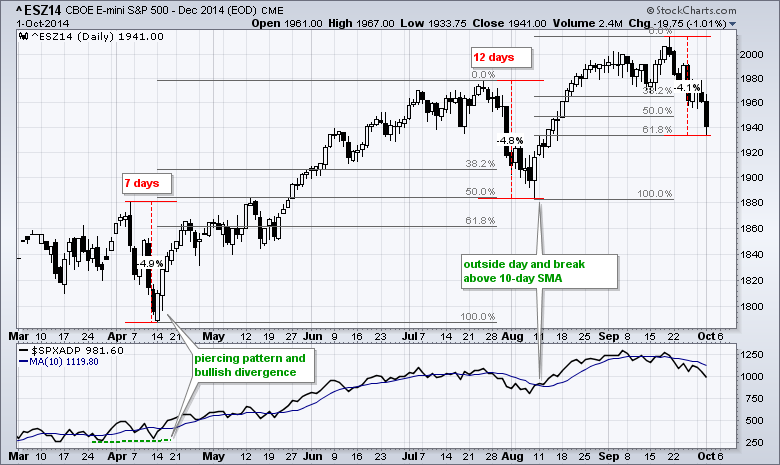
Stocks moved sharply lower on Wednesday with the major index ETFs falling over 1%. The Russell MicroCap iShares (IWC) led the way lower with a 1.71% decline. The materials and energy sectors led the way lower. The utilities provided the only gain. Most industry group ETFs were down. The Gold Miners ETF (GDX) managed a gain, as did the Medical Devices ETF (IHI). Robert Doll of Nuveen recently suggested that republican control of Congress could lead to a repeal of the tax on medical devices. Turning back to the broader market, most momentum oscillators and short-term indicators are oversold. However, as we have seen with gold and the Russell 2000 iShares, securities can become oversold and remain oversold in strong downtrends. That is why I will wait for some sort of selling climax or upside breakout in the short-term indicators. The chart below shows the e-mini with a 4.1% decline from high to low over the last eight days. This is the third 4+ percent decline since April. The April decline reversed with a piercing pattern and bullish divergence in the AD Line. The August decline reversed with an outside day and moving average crossover in the AD Line. We are still in corrective mode, but this will give you and idea of what to watch for going forward.
**This chart analysis is for educational purposes only, and should not
be construed as a recommendation to buy, sell or sell-short said securities**
**************************************************************
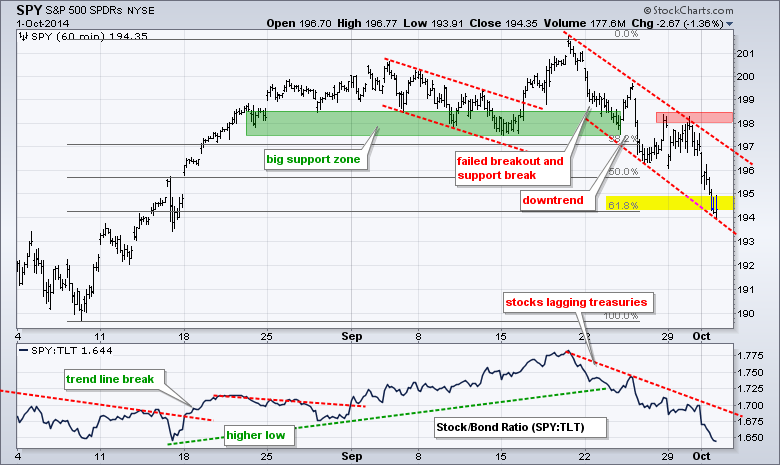
SPY extended its short-term downtrend and is now near the 62% retracement. The red trend line defines the falling channel over the last two weeks. The late September highs mark resistance in the 198-198.50 area. The indicator window shows SPY underperforming TLT as money moves into Treasuries.
**************************************************************
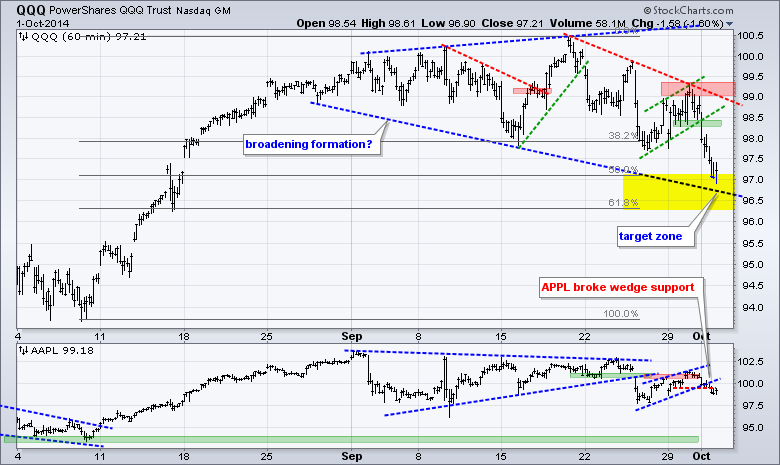
QQQ broke the rising flag support level and moved sharply lower on Tuesday. This move affirms resistance in the 99-99.3 area. The ETF is nearing the lower trend line of the broadening formation and the 50-62% retracement zone. This area could be a reversal zone, but note that IWM overshot its potential reversal zones and simply moved lower. There is no guarantee this zone will hold and stocks are under serious pressure right now. The indicator window shows AAPL breaking the wedge trend line and weighing on QQQ.
**************************************************************
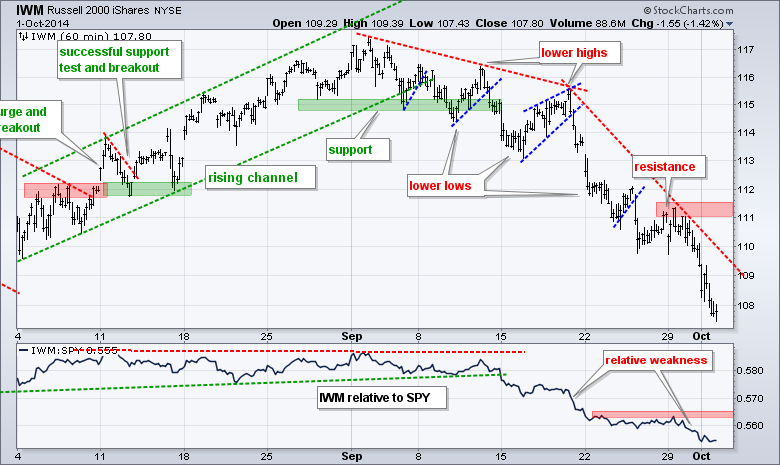
No change. IWM tried to firm and failed yet again. The ETF failed to break resistance at 111.5 and broke to new lows for the autumn move. This affirms the downtrend and key resistance at 111.5. The price relative also broke to new lows as IWM continued to underperform SPY.
**************************************************************
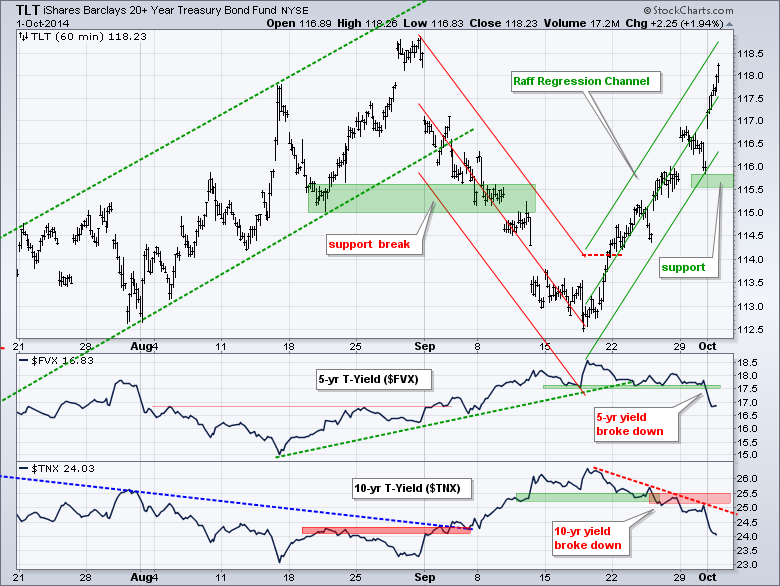
TLT surged as commodities continued to plunge. The sharp decline in commodities puts a huge damper on inflation and this is bullish for Treasuries. I am extending the Raff Regression Channel and marking key support at 115.50 for now. The indicator window shows the 5-year Treasury Yield ($FVX) breaking down on Wednesday. The 10-YR Treasury Yield ($TNX) broke down last week. Yields are moving lower and Treasuries are moving higher.
**************************************************************
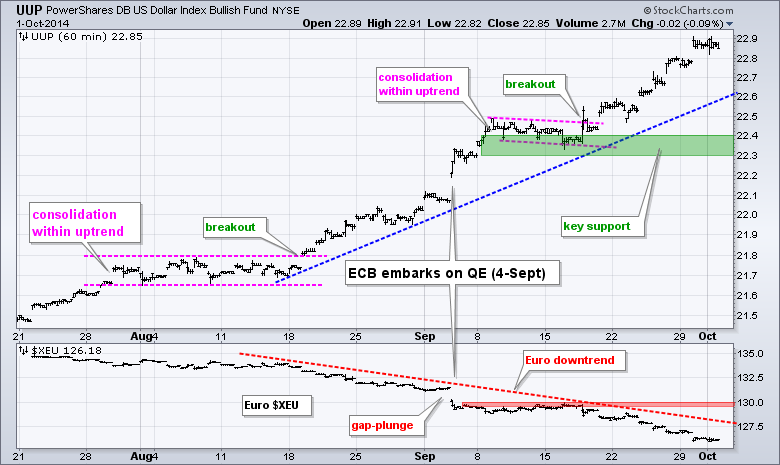
No change. UUP hit new highs for the move last week and remains in a strong uptrend. The mid September lows mark key support in the 22.3-22.4 area. The Euro Index ($XEU) is in a strong downtrend, which accelerated on 4-Sep when the European Central Bank (ECB) embarked on quantitative easing. The mid September highs mark resistance at 130.
**************************************************************
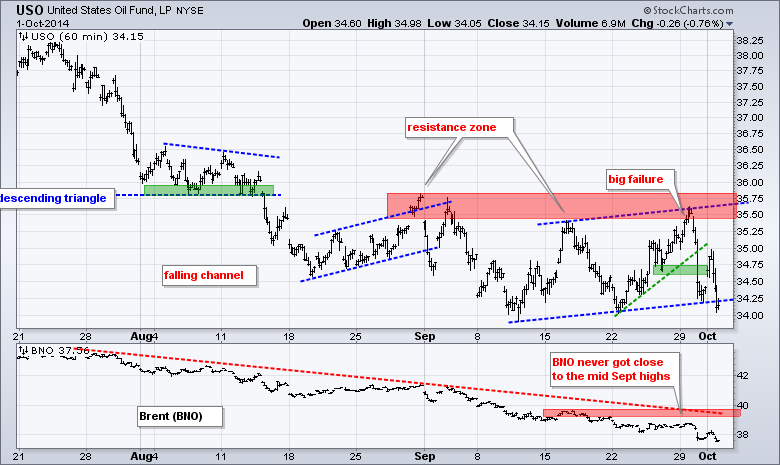
No change. USO poked its head above the mid September high and then promptly reversed course with a 3+ percent decline. Supply concerns got the blame. Higher output from Saudi Arabia and Libya pushed supply to 31 million barrels, versus OPEC's demand estimate of 29.2 million. The math is clear: supply > demand. USO broke upswing support to affirm the downtrend. The indicator window shows the US Brent Oil ETF (BNO) never making it to its mid September high and moving below 38. Oil is global and weakness in $BRENT was a warning that the bounce in USO would not hold. Yes, this is hindsight, but we can use this information in the future.
**************************************************************
No change. GLD cannot hold a bid to save its life. The ETF became oversold in mid September, stalled for a week and then broke consolidation support this week. Chartists can mark first resistance at 118. I will leave key resistance at 120. The indicator window shows the Silver ETF (SLV) within an accelerating downtrend. Notice how the red trend lines get steeper and steeper. First resistance is set at 17 and key resistance is set at 18.2.

***************************************************************
Key Reports and Events (all times Eastern):
Thu - Oct 02 - 07:30 - Challenger Job Report
Thu - Oct 02 - 08:30 - Initial Jobless Claims
Thu - Oct 02 - 10:00 - Factory Orders
Thu - Oct 02 - 10:30 - Natural Gas Inventories
Fri - Oct 03 - 08:30 - Employment Report
Fri - Oct 03 - 10:00 - ISM Services Index
Chart Setups on Tuesday and Thursday.
http://stockcharts.com/h-sc/ui?s=ALXN&p=D&yr=0&mn=6&dy=0&id=p23401431436&a=369927671
http://stockcharts.com/h-sc/ui?s=KKD&p=D&yr=0&mn=6&dy=0&id=p99407737284&a=369927670
http://stockcharts.com/h-sc/ui?s=MXIM&p=D&yr=0&mn=6&dy=0&id=p99407737284&a=369927674
http://stockcharts.com/h-sc/ui?s=SYK&p=D&yr=0&mn=6&dy=0&id=p99407737284&a=369927675
This commentary and charts-of-interest are designed to stimulate thinking. This analysis is not a recommendation to buy, sell, hold or sell short any security (stock ETF or otherwise). We all need to think for ourselves when it comes to trading our own accounts. First, it is the only way to really learn. Second, we are the only ones responsible for our decisions. Think of these charts as food for further analysis. Before making a trade, it is important to have a plan. Plan the trade and trade the plan. Among other things, this includes setting a trigger level, a target area and a stop-loss level. It is also important to plan for three possible price movements: advance, decline or sideways. Have a plan for all three scenarios BEFORE making the trade. Consider possible holding times. And finally, look at overall market conditions and sector/industry performance.


