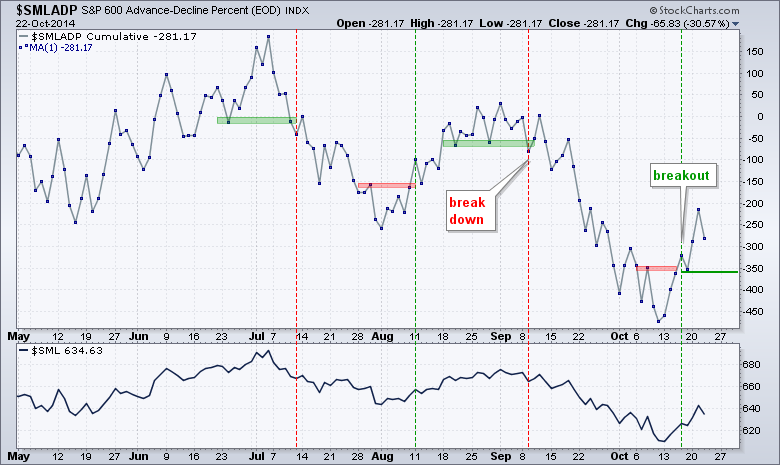
Stocks came under selling pressure on Wednesday with small-caps and micro-caps leading the way lower. These two led the rebound, but this upside leadership faded over the last five days. Seven of the nine sector SPDRs were down with industrials and energy leading the way. Oil fell over 1% and its oversold bounce proved short-lived. The consumer staples and utilities sectors gained as money moved into the defensive sectors. Metals and mining stocks were hit as copper and precious metals fell. Overall, the short-term trends for QQQ, IWM and SPY are up. A pullback after a strong surge is normal, but I will be watching short-term support levels closely. A break below these levels could foreshadow a test of the October lows. The chart below shows the AD Line for the S&P Small-Cap 600. This breadth indicator broke above the prior peak with a surge on Thursday and it is important that this breakout holds. A move back below Friday's low (green line) would negate the breakout and be short-term bearish for small-caps.
**This chart analysis is for educational purposes only, and should not
be construed as a recommendation to buy, sell or sell-short said securities**
**************************************************************
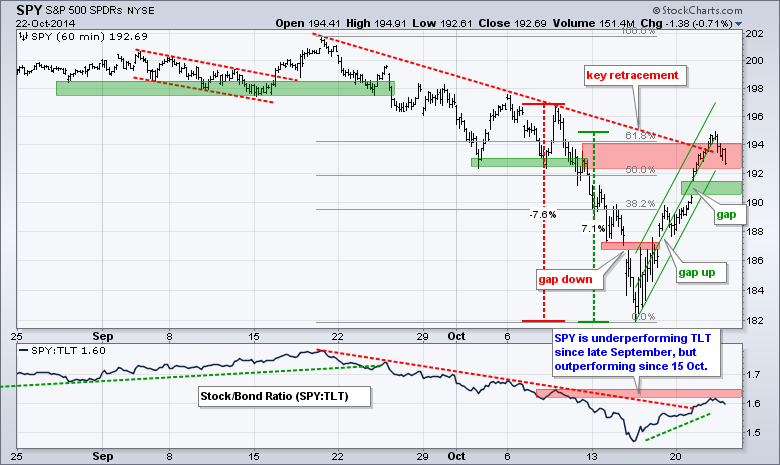
SPY is running into resistance from broken support, the September trend line and the 62% retracement. The ETF was also short-term overbought after a 7 percent advance. I will use the Raff Regression Channel and the gap to mark support. A move below 190.2 would fill the gap and break the channel. This would reverse the upswing.
**************************************************************
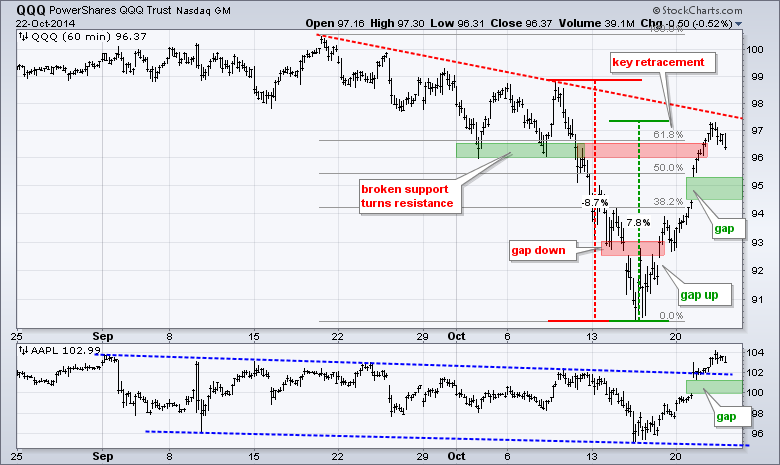
QQQ surged over 7% and hit some resistance near three technical levels: the 62% retracement, the September trend line and broken support. The ETF was, and still is, overbought, and could correct more. I did not draw a Raff Regression Channel because the advance is too steep. Instead, I will just watch the gaps in QQQ and Apple for clues. A move below the gap would negate the last surge and this would be short-term bearish.
**************************************************************
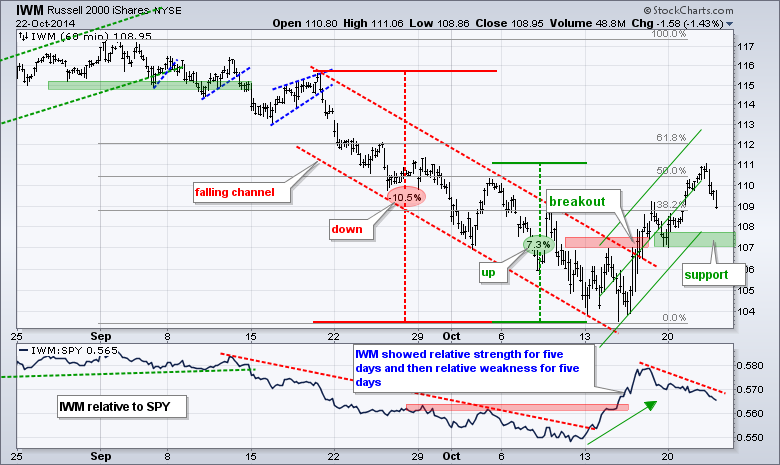
IWM remains in a short-term uptrend after the breakout, but the ETF has gone back to its lagging ways over the last five days. After a 7.3% surge, the ETF turned back near the 50% retracement and fell over 1% on Wednesday. The swing is still up though. I am using the Raff Regression Channel, broken resistance and Friday's low to mark key support at 107.
**************************************************************
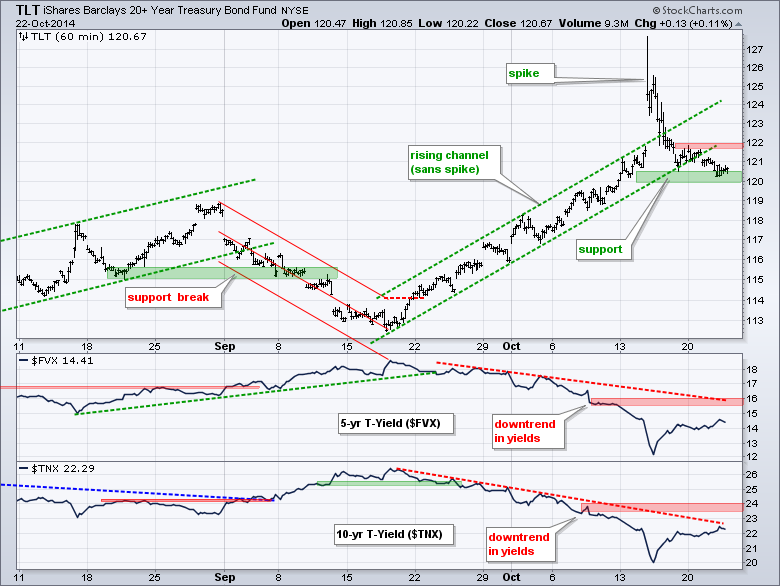
No change. Given the surge in stocks, I would have expected a bigger decline in Treasury bonds and a bigger advance in yields. I guess the bond market is waiting for next week's Fed meeting. TLT broke the lower trend line of a rising channel. The ETF, however, has not broken down because support in the 120 area remains. Watch for a break above 122 to signal a resumption of the uptrend.
**************************************************************
The US Dollar ETF (UUP) is breaking out and the Euro Index ($XEU) is breaking down. These breakouts provide the first sign that the bigger trends are resuming. UUP broke the wedge trend line and the mid October highs mark the next challenge. XEU broke the flag trend line and is testing the mid October low. Note that the European Central Bank (ECB) will release the results of its stress test for EU banks on Sunday. It is mostly theater, but could affect the Euro on Friday-Monday.

**************************************************************
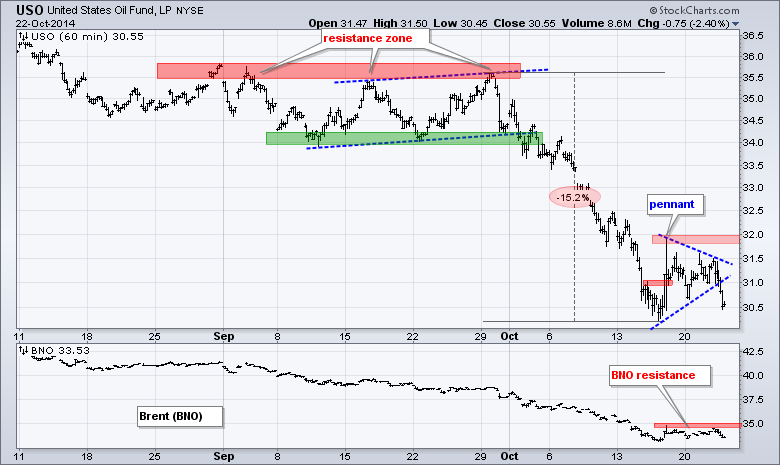
That bounce did not last long. The USO Oil Fund (USO) got a little break above 31 last week, stalled for a few days and move lower on Wednesday. Overall, it looks like a pennant within a downtrend. Pennants are continuation patterns and this break signals a continuation lower. Chartists can mark resistance in the 31.5-32 area. The indicator window shows the US Brent Oil ETF (BNO) with resistance at 35.
**************************************************************
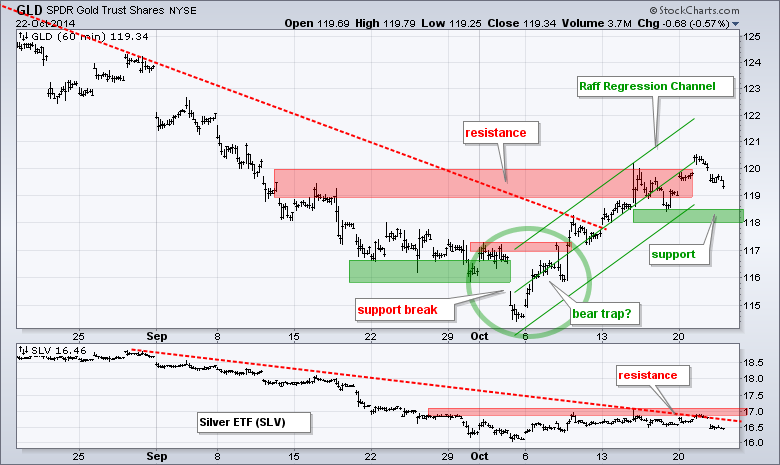
No change. The Gold SPDR (GLD) is at its moment-of-truth as it stalls at resistance. I replaced the trend lines with a Raff Regression Channel and will mark support at 118. The swing here is up as long as 118 holds. A break would argue for a continuation of the bigger downtrend and a test of the early October lows. Chartists should watch the Dollar for clues because this bounce in gold coincides with a correction in the Dollar. Note that the Gold Miners ETF (GDX) formed an inside day and continues to consolidate. A breakout at 22 would be bullish.
***************************************************************
Key Reports and Events (all times Eastern):
Thu - Oct 23 - 08:30 - Initial Jobless Claims
Thu - Oct 23 - 09:00 - FHFA Housing Price Index
Thu - Oct 23 - 10:00 - Leading Economic Indicators
Thu - Oct 23 - 10:30 - Natural Gas Inventories
Fri - Oct 24 - 10:00 - New Home Sales
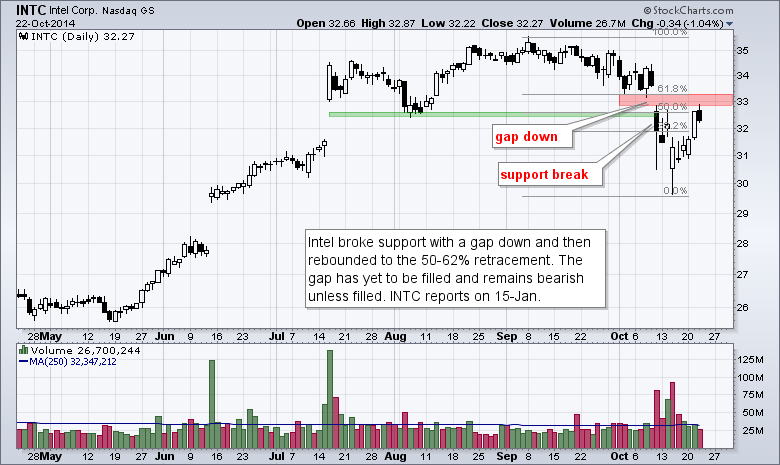
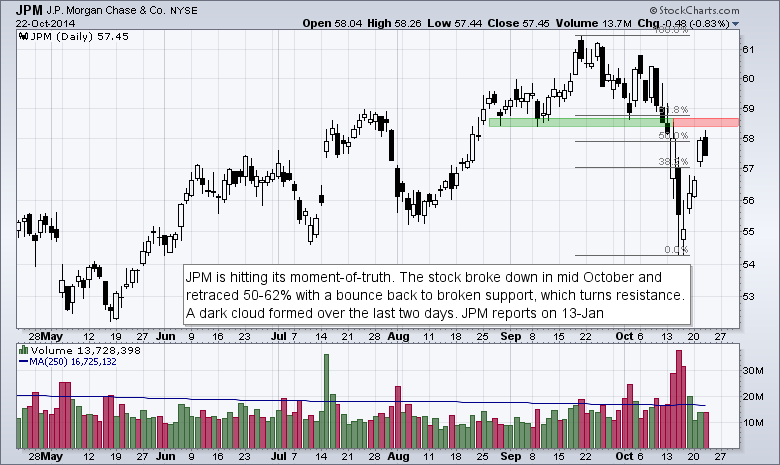
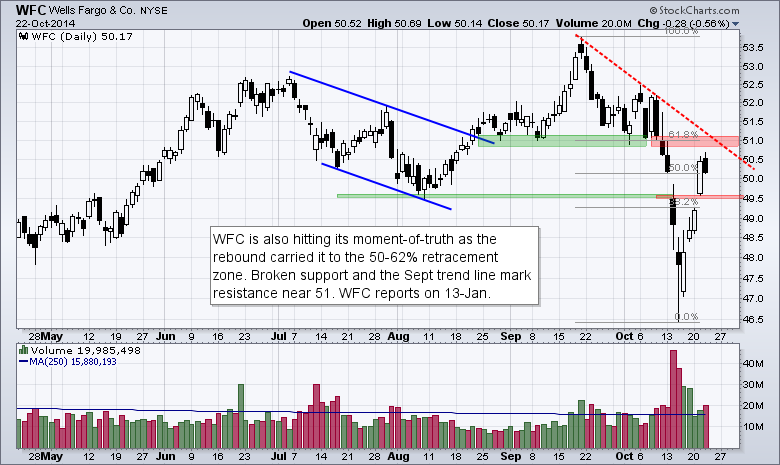
INTC, JPM and WFC have already reported and do not report earnings again until January. These three show similar chart patterns: a break down, a retracement and broken support turning resistance.
This commentary and charts-of-interest are designed to stimulate thinking. This analysis is not a recommendation to buy, sell, hold or sell short any security (stock ETF or otherwise). We all need to think for ourselves when it comes to trading our own accounts. First, it is the only way to really learn. Second, we are the only ones responsible for our decisions. Think of these charts as food for further analysis. Before making a trade, it is important to have a plan. Plan the trade and trade the plan. Among other things, this includes setting a trigger level, a target area and a stop-loss level. It is also important to plan for three possible price movements: advance, decline or sideways. Have a plan for all three scenarios BEFORE making the trade. Consider possible holding times. And finally, look at overall market conditions and sector/industry performance.


