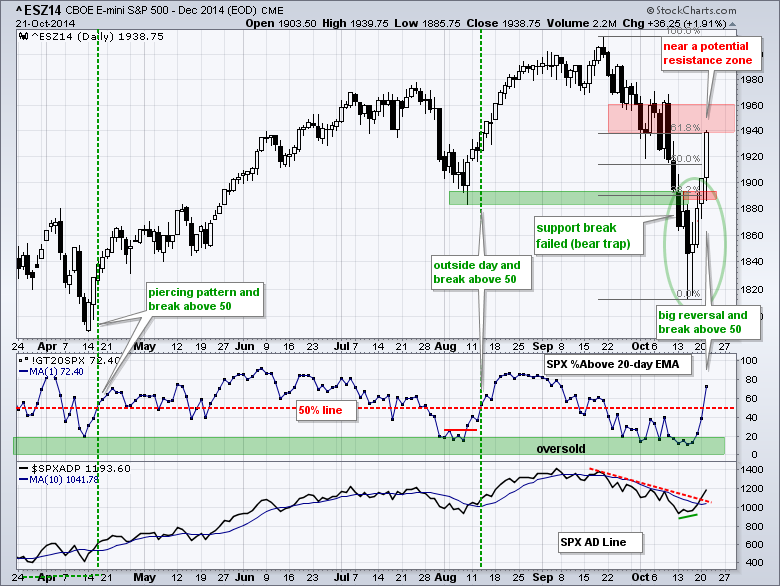
Stocks surged with broad strength that lifted all boats (except gold miners). Several of the major index ETFs surged over 2%. All nine sector SPDRs were higher, all nine equal-weight sector ETFs were up on the day and all nine small-cap sector ETFs were up. The energy sector led the way with a 3+ percent surge in all three categories. Energy may be getting and oversold bounce, but even a 50% retracement would be a nice move. The chart below shows the e-mini surging back to its early October levels. It is as if the mid October plunge never occurred. At this point, I think the strength of the surge is enough to negate the support break and the move below the 200-day moving average in the S&P 500. Stocks are already short-term overbought and the e-mini is near potential resistance zone now. This means we may see some backing and filling as the market stabilizes. The indicator window shows the S&P 500 %Above 20-day EMA (!GT20SPX) surging above 50% and hitting its highest level since the first week of September.
**This chart analysis is for educational purposes only, and should not
be construed as a recommendation to buy, sell or sell-short said securities**
**************************************************************
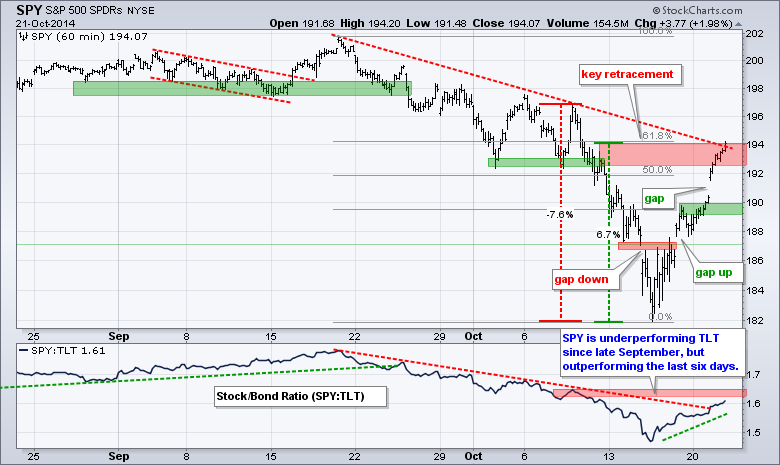
SPY fell 7.6% with a move to 182 and then surged 6.6% with a move to 194. It is basically 4-5 days down and 4-5 days up. SPY is now short-term overbought and at its first resistance zone (192-194). As far as the current upswing is concerned, the gap and a buffer mark support in the 189-190 area.
**************************************************************
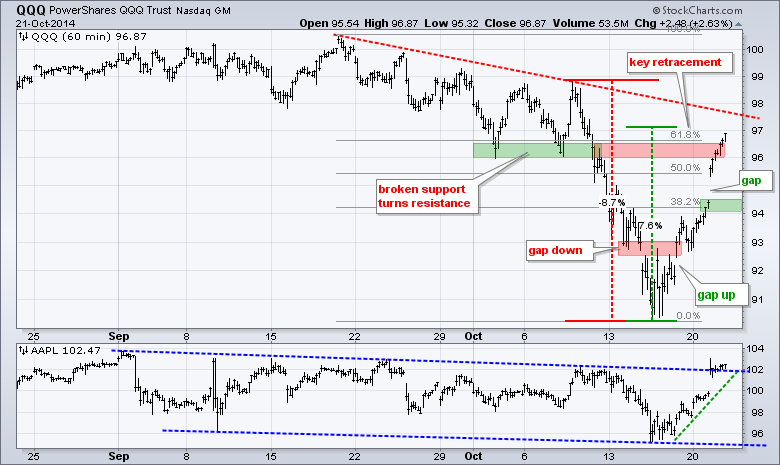
QQQ did what it does best: outperform when the broader market moves higher. The ETF gapped up and surged to 96.87 with a 2+ percent advance. The gap zone and a buffer mark first support in the 94 area. QQQ is also getting short-term overbought after a 7.6% advance in less than five days. There is also the potential for resistance from the 62% retracement, broken support and the mid September trend line. The indicator window shows Apple leading the charge with a gap and close above the falling channel trend line.
**************************************************************
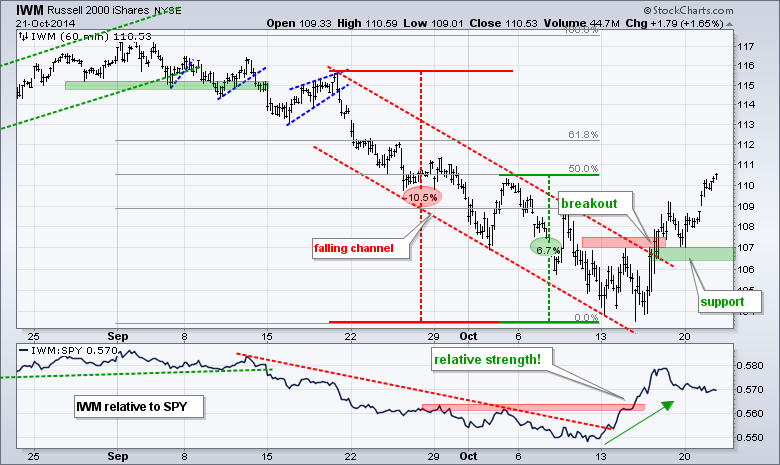
No change. IWM broke channel resistance with a surge above 107 and then fell back a little on Friday. The breakout is still holding and I will mark support at 106 for now. A move below this level would negate the breakout and could lead to a test of the early October low. The indicator window shows IWM outperforming SPY as the price relative surged above its early October high.
**************************************************************
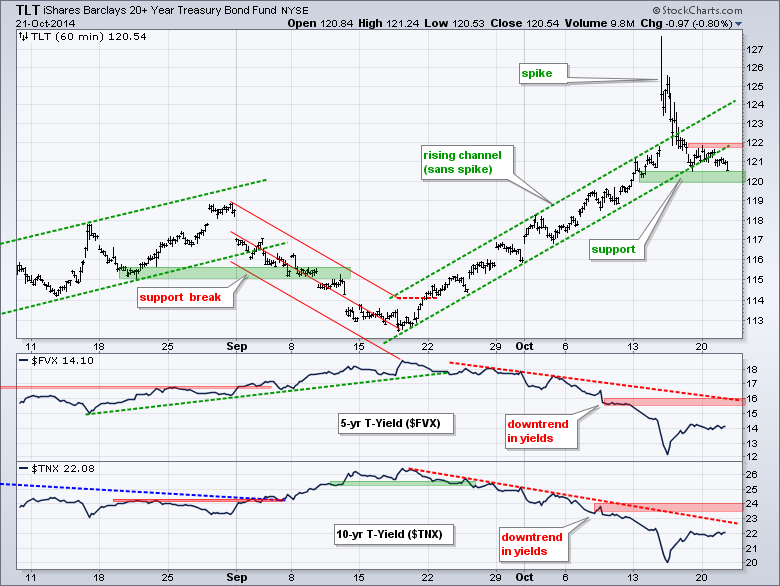
Given the surge in stocks, I would have expected a bigger decline in Treasury bonds and a bigger advance in yields. I guess the bond market is waiting for next week's Fed meeting. TLT broke the lower trend line of a rising channel. The ETF, however, has not broken down because support in the 120 area remains. Watch for a break above 122 to signal a resumption of the uptrend.
**************************************************************
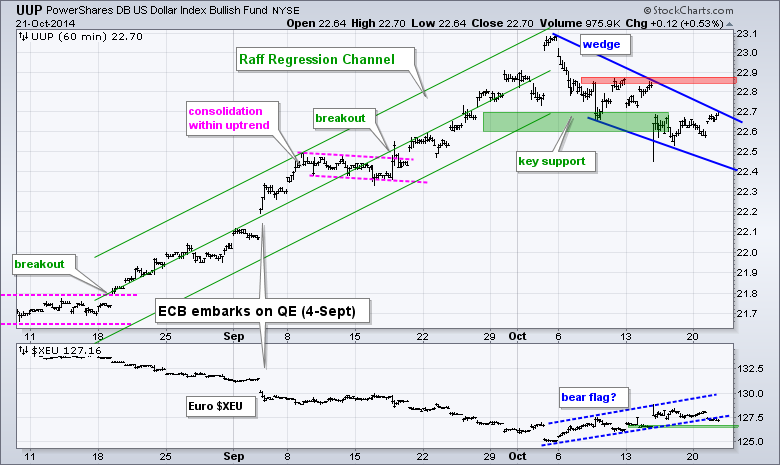
No change. The Dollar corrected over the last few weeks and the Euro got an oversold bounce. UUP formed a falling wedge and broke below the early October lows last week. This is still viewed as a pullback within a bigger uptrend and I will mark resistance at 22.9. A breakout here would signal an end to the correction and resumption of the uptrend. The Euro Index ($XEU) has support at 127.
**************************************************************
No change. The USO Oil Fund (USO) got an oversold bounce with the break above 31 last week. This break is largely holding and oil is showing signs that this oversold bounce may continue. I am marking first resistance in the 32-32.50 area. The US Brent Oil ETF (BNO) has resistance at 35.

**************************************************************
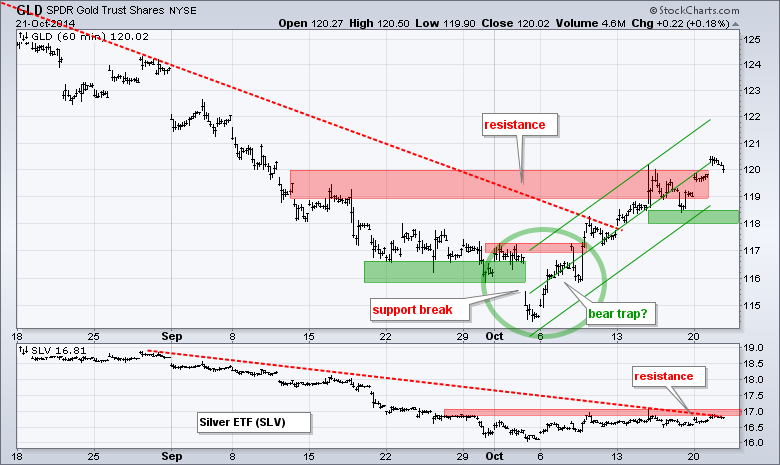
No change. The Gold SPDR (GLD) is at its moment-of-truth as it stalls at resistance. I replaced the trend lines with a Raff Regression Channel and will mark support at 118. The swing here is up as long as 118 holds. A break would argue for a continuation of the bigger downtrend and a test of the early October lows. Chartists should watch the Dollar for clues because this bounce in gold coincides with a correction in the Dollar. Note that the Gold Miners ETF (GDX) formed an inside day and continues to consolidate. A breakout at 22 would be bullish.
***************************************************************
Key Reports and Events (all times Eastern):
Wed - Oct 22 - 07:00 - MBA Mortgage Index
Wed - Oct 22 - 08:30 - Consumer Price Index (CPI)
Wed - Oct 22 - 10:30 - Crude Oil Inventories
Thu - Oct 23 - 08:30 - Initial Jobless Claims
Thu - Oct 23 - 09:00 - FHFA Housing Price Index
Thu - Oct 23 - 10:00 - Leading Economic Indicators
Thu - Oct 23 - 10:30 - Natural Gas Inventories
Fri - Oct 24 - 10:00 - New Home Sales
Chart setups are on Tuesday and Thursday.
This commentary and charts-of-interest are designed to stimulate thinking. This analysis is not a recommendation to buy, sell, hold or sell short any security (stock ETF or otherwise). We all need to think for ourselves when it comes to trading our own accounts. First, it is the only way to really learn. Second, we are the only ones responsible for our decisions. Think of these charts as food for further analysis. Before making a trade, it is important to have a plan. Plan the trade and trade the plan. Among other things, this includes setting a trigger level, a target area and a stop-loss level. It is also important to plan for three possible price movements: advance, decline or sideways. Have a plan for all three scenarios BEFORE making the trade. Consider possible holding times. And finally, look at overall market conditions and sector/industry performance.


