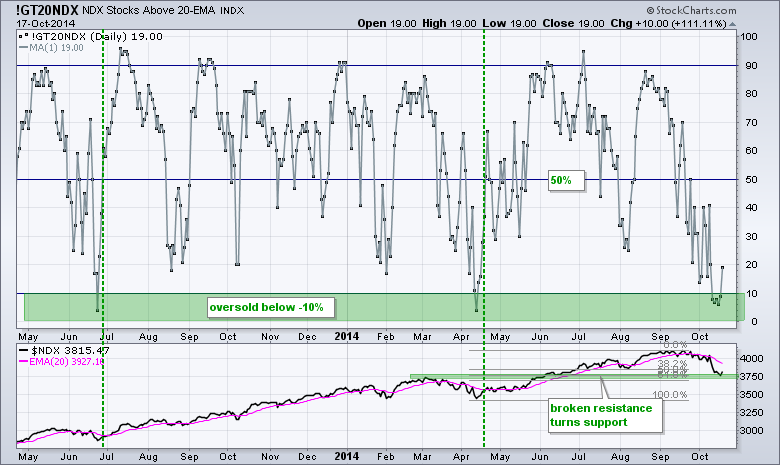
Stocks followed up on Thursday's reversal day with a gap up on Friday. Afternoon selling pressure pushed small-caps and micro-caps into negative territory by the close, but the rest of the major index ETFs closed positive. All nine sector SPDRs closed higher with the Industrials SPDR leading the way. Industrials also led the equal-weight sectors. The small-cap sectors finished mixed. The Home Construction iShares stood out on Friday with a 3+ percent gain on big volume. In fact, upside volume has been strong the last four days in ITB. It is still a tricky time for stocks because we are in the middle of earnings season, Ebola fears (unfounded or not) are running high and the midterm elections are just around the corner. Earnings season and the midterm elections will certainly pass, and Ebola fears will likely subside. The chart below shows the Nasdaq 100 %Above 20-day EMA (!GT20NDX) dipping below 10% for the third time in eighteen months. The green lines show subsequent moves above 50% to turn this indicator bullish again.
**This chart analysis is for educational purposes only, and should not
be construed as a recommendation to buy, sell or sell-short said securities**
**************************************************************
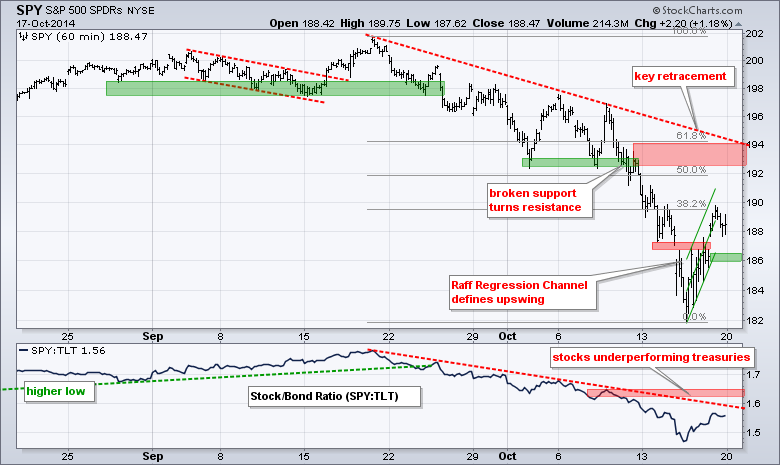
SPY filled the gap with a surge above 188 and forged a short-term reversal of sorts. I am using the Raff Regression Channel to define this upswing and will mark support at 186. A move below this level would also fill Friday's gap. As far as upside resistance, broken support, the 50-62% retracement zone and the mid September trend line mark resistance in the 192-194 area.
**************************************************************
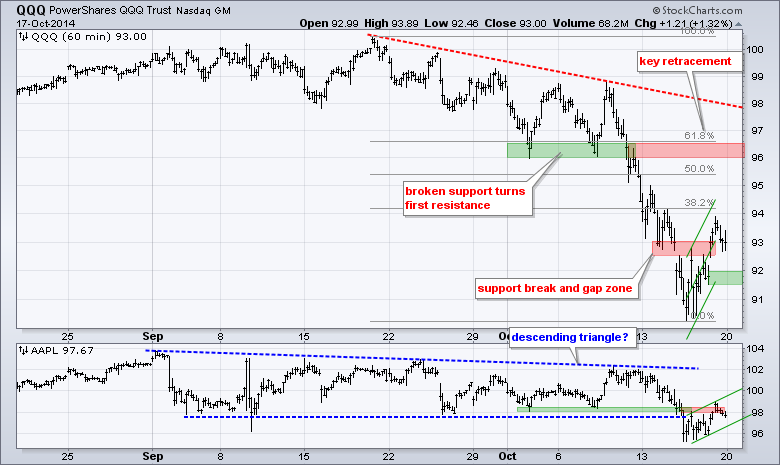
QQQ gapped down on Wednesday, stalled and then gapped up on Friday. This sequence forges a short-term reversal from oversold levels. The Raff Regression Channel defines the two day upswing with support marked at 91.5. The indicator window shows APPL trying to recoup its support break. A rising flag of sorts could be forming and a break below 97 would be negative.
**************************************************************
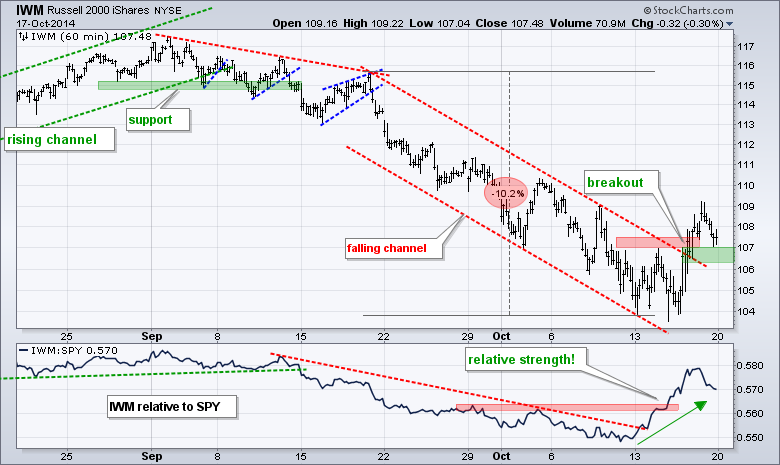
IWM broke channel resistance with a surge above 107 and then fell back a little on Friday. The breakout is still holding and I will mark support at 106 for now. A move below this level would negate the breakout and could lead to a test of the early October low. The indicator window shows IWM outperforming SPY as the price relative surged above its early October high.
**************************************************************
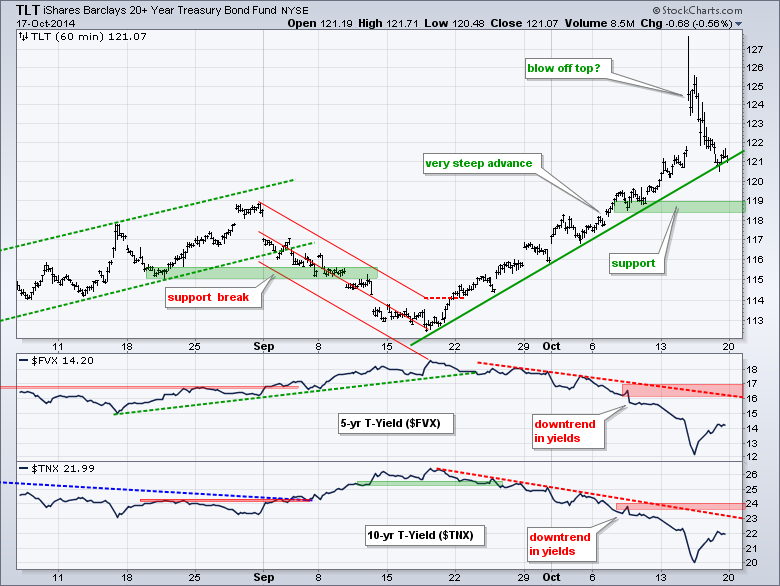
The 20+ YR T-Bond ETF (TLT) surged above 127 and then fell back to the 121 area. This looks like a blow-off top, but the short-term trend is still up. Notice that TLT is right at the mid September trend line. I will leave key support in the 118-119 area for now. The indicator windows show Treasury yields trending lower.
**************************************************************
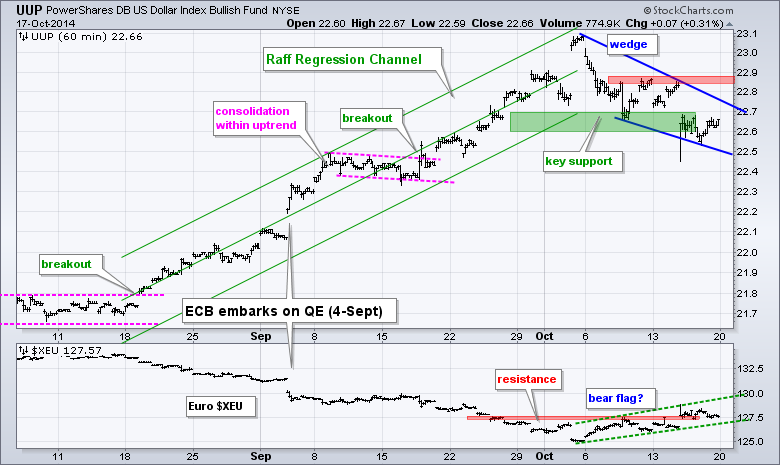
No change. The US Dollar ETF (UUP) fell back with a falling wedge as the Euro Index ($XEU) bounced with a rising flag. The falling wedge is typically a bullish continuation pattern, while the rising flag is a bearish continuation pattern. A break above 22.9 would be Dollar bullish, while a break below 126.2 would be Euro bearish.
**************************************************************
The USO Oil Fund (USO) got an oversold bounce with the break above 31. This break is also holding, which is the first positive in a long time. Even though this oversold bounce could extend, the bigger trend remains down and I am marking first resistance in the 32.32.50 area.

**************************************************************
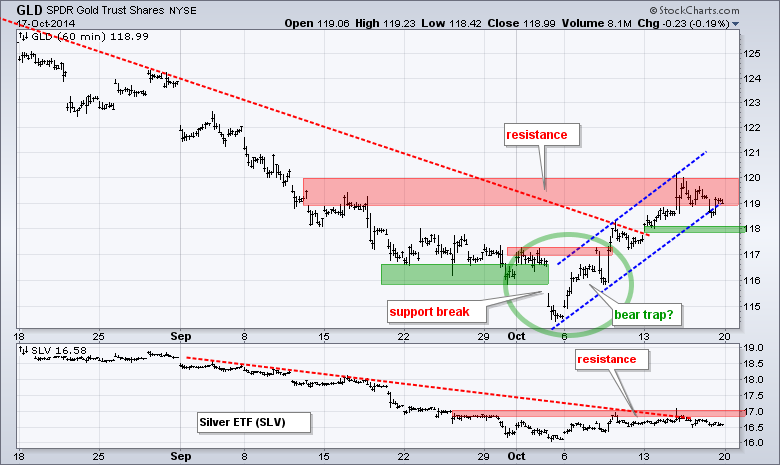
No change. The Gold SPDR (GLD) is at an interesting juncture: resistance in a long-term downtrend. Even though the ETF sprung a bear trap with the surge back above 117, the advance still looks like a counter trend move because a rising flag formed. A move below the lower trend line and support at 117.8 would reverse the rising flag and signal a continuation of the long-term downtrend.
***************************************************************
Key Reports and Events (all times Eastern):
Tue - Oct 21 - 10:00 - Existing Home Sales
Wed - Oct 22 - 07:00 - MBA Mortgage Index
Wed - Oct 22 - 08:30 - Consumer Price Index (CPI)
Wed - Oct 22 - 10:30 - Crude Oil Inventories
Thu - Oct 23 - 08:30 - Initial Jobless Claims
Thu - Oct 23 - 09:00 - FHFA Housing Price Index
Thu - Oct 23 - 10:00 - Leading Economic Indicators
Thu - Oct 23 - 10:30 - Natural Gas Inventories
Fri - Oct 24 - 10:00 - New Home Sales
Chart setups are on Tuesday and Thursday.
This commentary and charts-of-interest are designed to stimulate thinking. This analysis is not a recommendation to buy, sell, hold or sell short any security (stock ETF or otherwise). We all need to think for ourselves when it comes to trading our own accounts. First, it is the only way to really learn. Second, we are the only ones responsible for our decisions. Think of these charts as food for further analysis. Before making a trade, it is important to have a plan. Plan the trade and trade the plan. Among other things, this includes setting a trigger level, a target area and a stop-loss level. It is also important to plan for three possible price movements: advance, decline or sideways. Have a plan for all three scenarios BEFORE making the trade. Consider possible holding times. And finally, look at overall market conditions and sector/industry performance.


