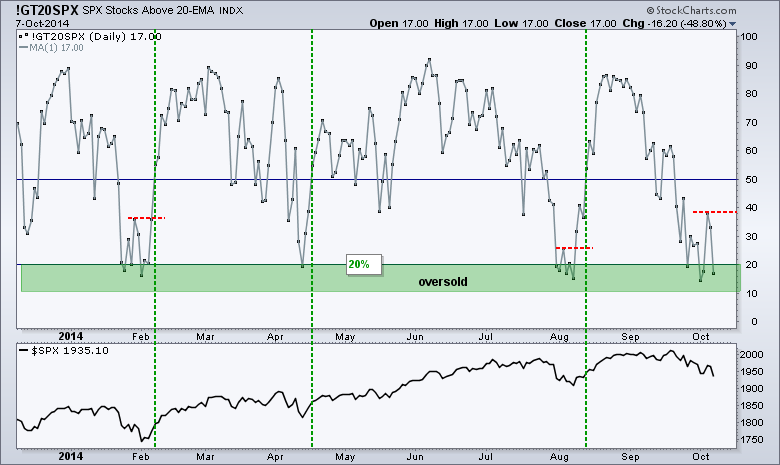
Stocks were hit with broad-based selling pressure on Tuesday. The major index ETFs lost around 1.5% each. All nine sectors were down with the Industrials SPDR (XLI) leading the way (-2.43%). The consumer staples and utilities sectors held up the best (smallest losses). Overall, the markets remain in a risk-off environment for the following reasons: small-caps show relative weakness; treasuries are outperforming stocks; defensive sectors are outperforming the offensive sectors; October is a volatile month in general; earnings season begins with Alcoa today; and finally, the mid-term elections are less than four weeks away. Tis enough to make a bull hibernate for a few weeks. The chart below shows the percent of S&P 500 stocks above their 20-day EMA. This indicator moved back below 20% for the third time in three weeks. It is a classic case of becoming oversold and remaining oversold. A surge above 50% would provide a bullish signal similar to the ones seen in early February, mid April and mid August. Chartists looking for a quicker jump can watch Friday's peak (call it 40%). A breakout here would show the strongest upside breadth since September 23rd. Programming note: I will be at the IFTA conference in London the rest of the week and Art's charts will be on hiatus Thursday-Friday. I will post a Market Message on Friday.
**This chart analysis is for educational purposes only, and should not
be construed as a recommendation to buy, sell or sell-short said securities**
**************************************************************
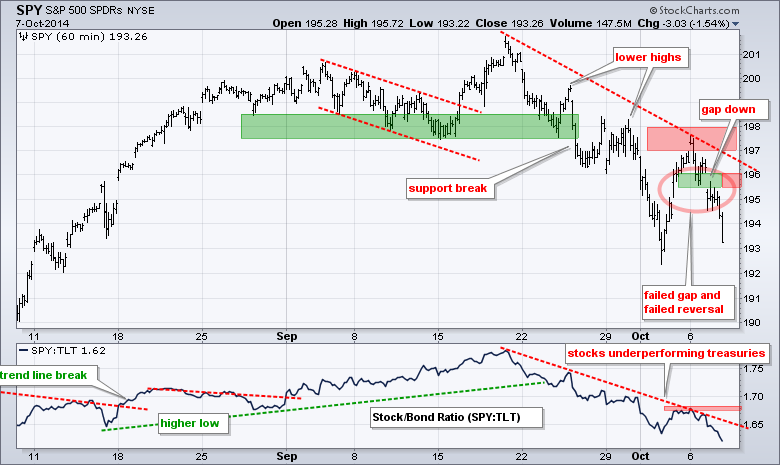
SPY gapped down on Tuesday and broke first support to negate last week's reversal. With a peak around 197.5, SPY formed a lower high and extended its three week downtrend. Tuesday's gap zone marks first resistance at 196. Key resistance is set at 198 for now. The indicator window shows the TLT:SPY ratio moving to a new low for the move. Stocks are underperforming Treasuries and this favors a risk-off environment.
**************************************************************
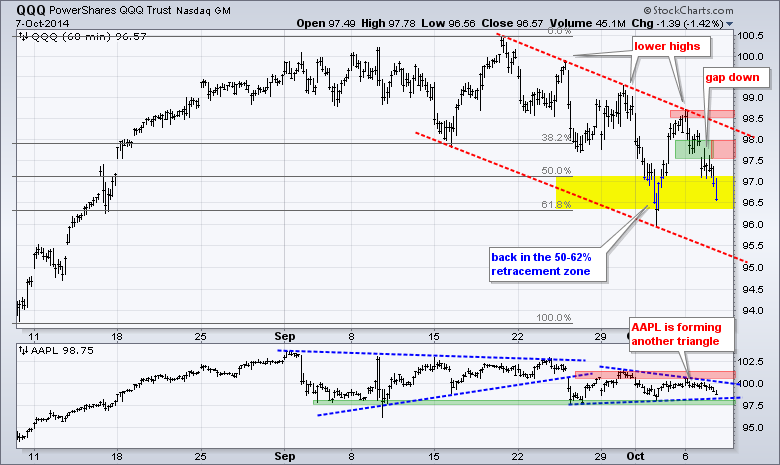
QQQ gapped down and formed a lower high to extend the downtrend. The red trend lines show a potential falling channel over the last four weeks with the lower trend line extending to the 95 area early next week. The gap zone marks first resistance at 98 and the early October high marks key resistance at 98.70 for now. The indicator window shows Apple testing the lower trend line of the triangle.
**************************************************************
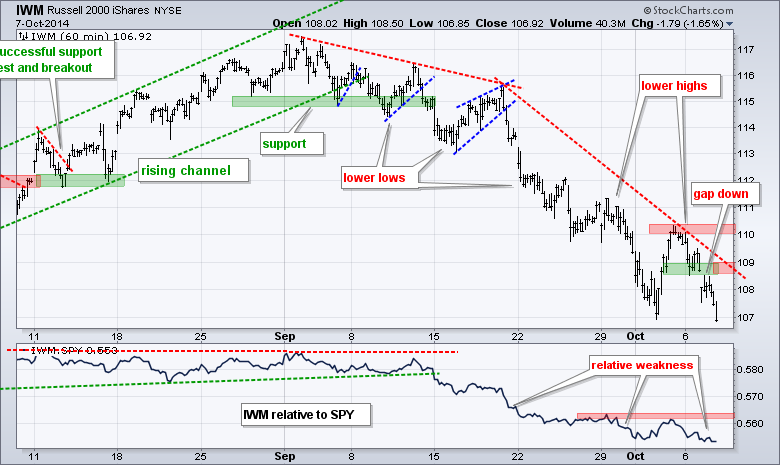
IWM totally failed to hold its reversal-surge from last week. The ETF gapped below first support and moved back to the early October low. The mid September trend line and gap zone mark first resistance at 109. The early October high marks key resistance at 110.4 for now. The indicator window shows the IWM:SPY ratio falling to a new low for the move. Relative weakness in small-caps is another sign of risk-aversion in the stock market right now.
**************************************************************
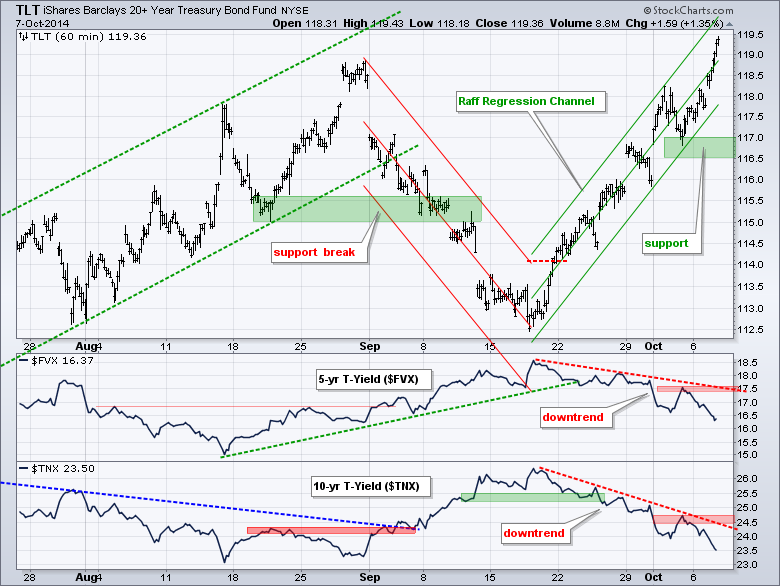
The 20+ YR T-Bond ETF (TLT) extended its uptrend with a surge above its late August high. The Raff Regression Channel has been extended to this high. I am, however, going to mark support in the 116.5-117 area because this channel is quite steep. The indicator windows show the 10-YR Treasury Yield ($TNX) moving to its lowest level since late August and the 5-year Treasury Yield ($FVX) hitting a five week low. Strength in Treasuries is another sign that the market is in risk off mode right now.
**************************************************************
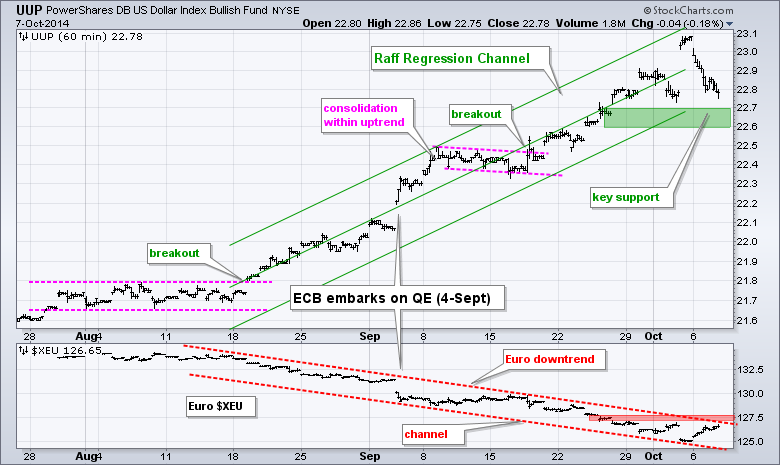
The US Dollar ETF (UUP) fell back as the Euro bounced this week. The overall trends remain in place though. UUP is within a clear uptrend. The Raff Regression Channel and a buffer mark key support in the 22.6-22.7 area. The Euro Index ($XEU) is in a clear downtrend with key resistance marked at 128 for now. The Dollar is the safe-haven currency and this strong uptrend favors a risk-off environment.
**************************************************************
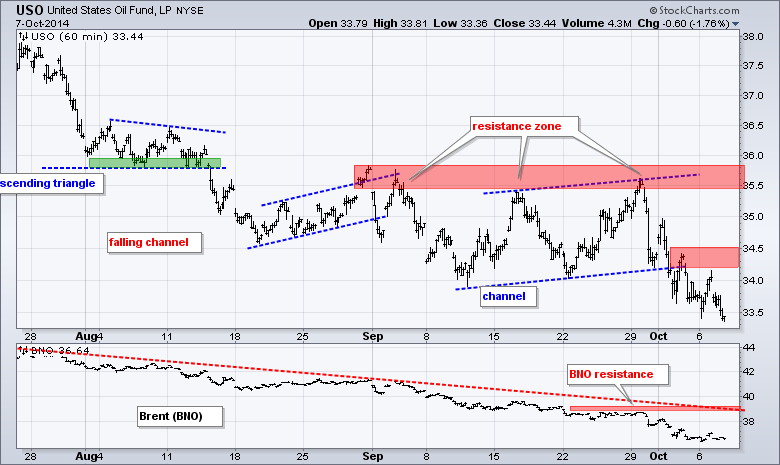
No change. A strong Dollar, increasing support and weakening demand are weighing on oil. The USO Oil Fund (USO) broke channel support last week to signal a continuation lower. The broken support levels mark first resistance in the 34.5 area. I am leaving key resistance at 35.8 though. The US Brent Oil ETF (BNO) also sank to new lows and key resistance is set at 40
**************************************************************
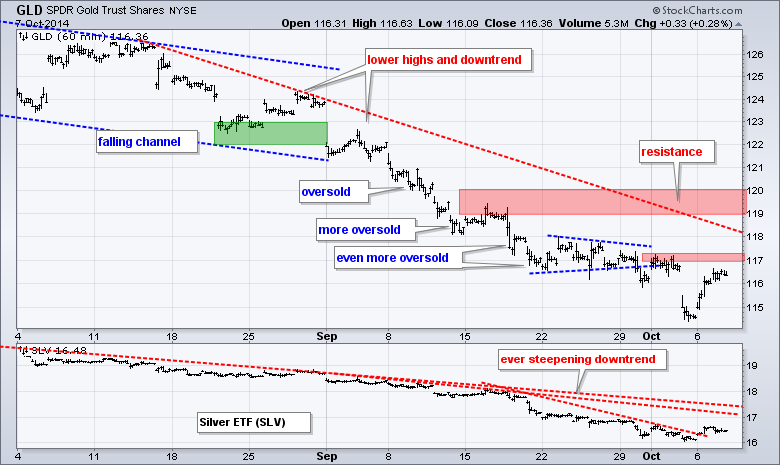
No change. Strength in the Dollar is also taking its toll on gold, which sank to a new low for the year. The Gold SPDR (GLD) plunged below 115 as the Dollar surged on Friday. Last week's highs mark first resistance in the 117.2 area. The August trend line and mid September highs mark key resistance in the 119-120 area.
***************************************************************
Key Reports and Events (all times Eastern):
Wed - Oct 08 - 07:00 - MBA Mortgage Index
Wed - Oct 08 - 10:30 - Crude Inventories
Wed - Oct 08 - 14:00 - FOMC Minutes
Thu - Oct 09 - 08:30 - Continuing Claims
Thu - Oct 09 - 10:30 - Natural Gas Inventories
Tue - Nov 04 - 09:00 - Midterm Elections
Chart Setups on Tuesday and Thursday.
I am travelling the rest of the week and there will not be any chart setups on Thursday.
This commentary and charts-of-interest are designed to stimulate thinking. This analysis is not a recommendation to buy, sell, hold or sell short any security (stock ETF or otherwise). We all need to think for ourselves when it comes to trading our own accounts. First, it is the only way to really learn. Second, we are the only ones responsible for our decisions. Think of these charts as food for further analysis. Before making a trade, it is important to have a plan. Plan the trade and trade the plan. Among other things, this includes setting a trigger level, a target area and a stop-loss level. It is also important to plan for three possible price movements: advance, decline or sideways. Have a plan for all three scenarios BEFORE making the trade. Consider possible holding times. And finally, look at overall market conditions and sector/industry performance.


