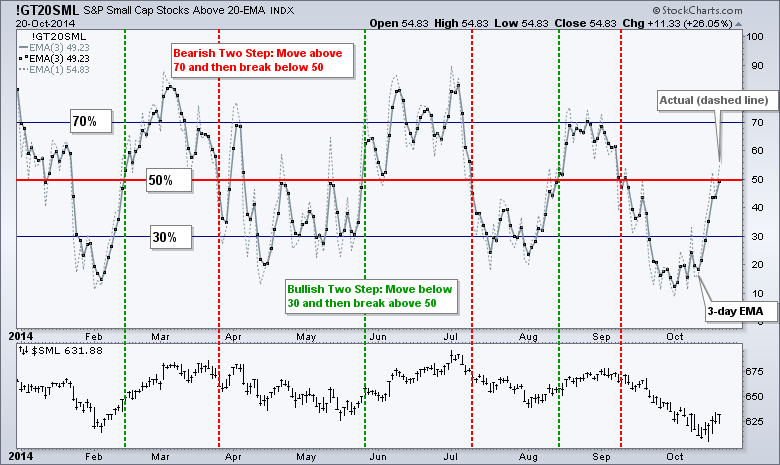
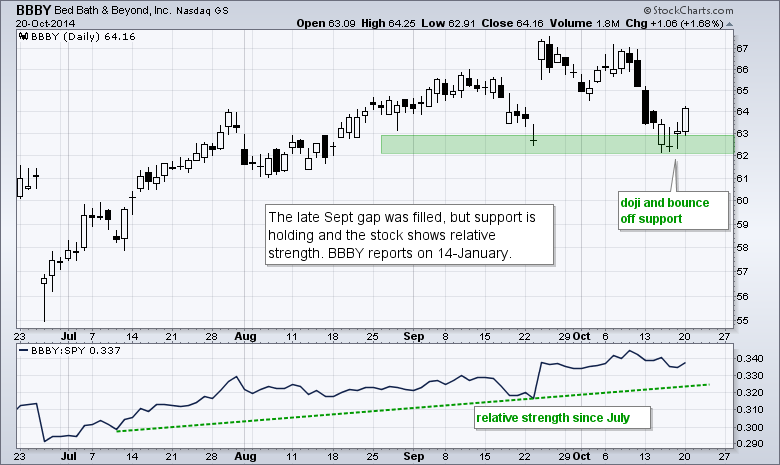
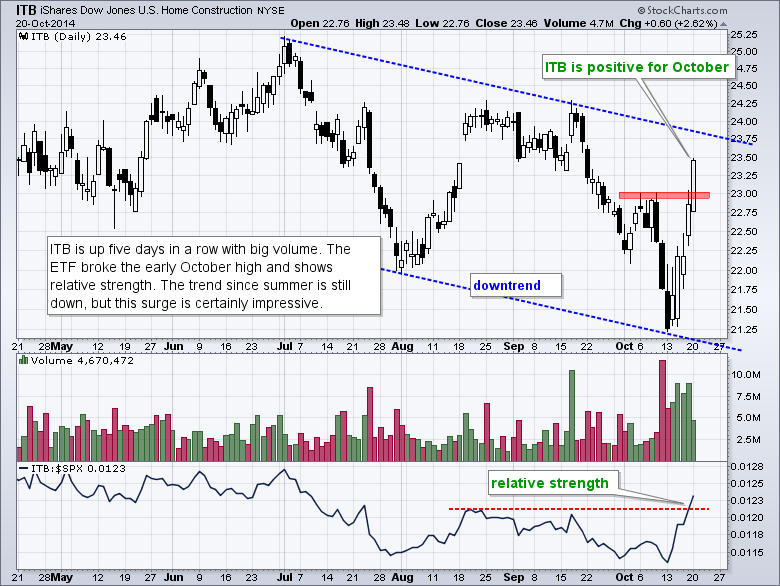
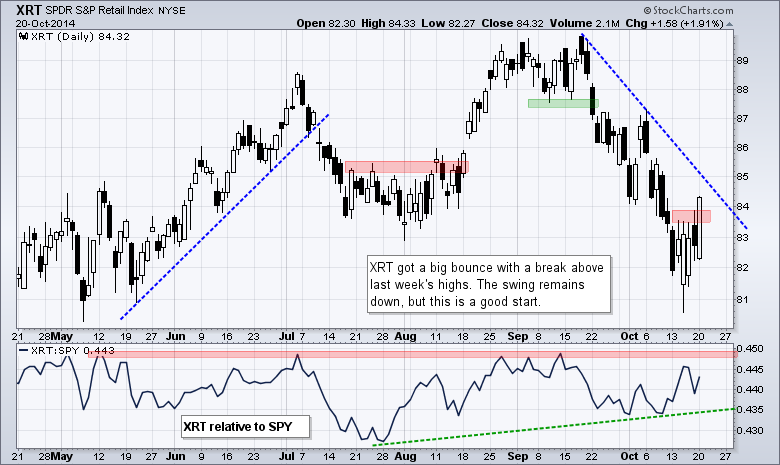
Given the IBM miss, I was pretty impressed with market action on Monday. The Dow Diamonds (DIA) had every reason to fill its gap after a weak open, but immediately firmed and closed near the high of the day (and positive for the day). The major index ETFs are holding Friday's gaps and these gaps are short-term bullish until proven otherwise (filled). Also note that the Home Construction iShares (ITB) surged the last five days and the Retail SPDR (XRT) led the market on Monday. The chart below shows the Small-Cap %Above 20-day EMA (!GT20SML) moving above 50% for the second time in three days. In contrast, the MidCap %Above 20-day EMA (!GT20MID) is at 46% and the S&P 500 %Above 20-day EMA (!GT20SPX) is at 39%. Small and mid-caps are leading this oversold bounce right now and this is positive overall. I use the 3-day EMA to smooth this volatile data series and trigger signals. A move above 50% would be short-term bullish. The 3-day is currently at 49.23 so this is the make-or-break day. The signal is not fool proof and stocks are already a few percent off their lows.
**This chart analysis is for educational purposes only, and should not
be construed as a recommendation to buy, sell or sell-short said securities**
**************************************************************
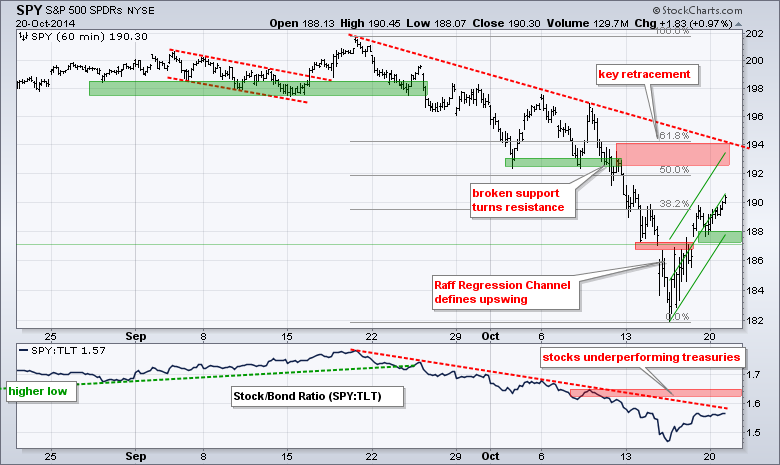
SPY extended its upswing within a short-term downtrend. As such, I extended the Raff Regression Channel to Monday's close and raised key support to 187. A move below this level would break the lower trend line and reverse this upswing. Such a break would then argue for a test of the prior low (182).
**************************************************************
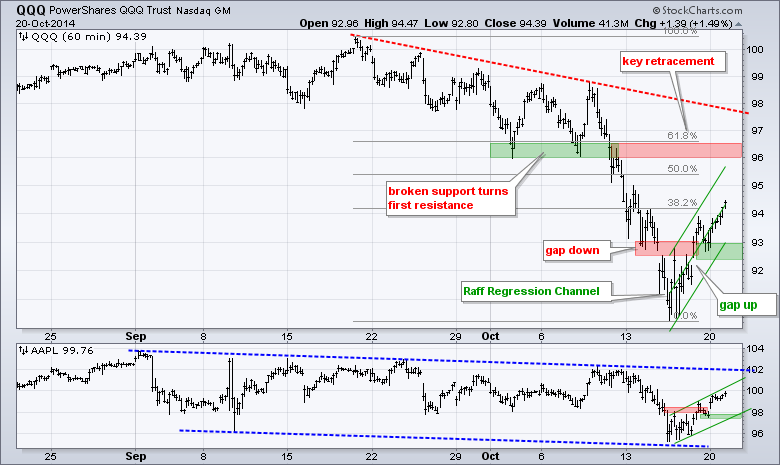
QQQ extended its advance with a move above 94. The Raff Regression Channel and Friday's low combine to mark upswing support in the 92.4-93 area. A break below 92.4 would reverse this upswing and call for a test of the mid October low. The indicator window shows Apple working its way lower since September. The stock bounced over the last few days with a rising flag. A move below 97.45 would break flag support.
**************************************************************
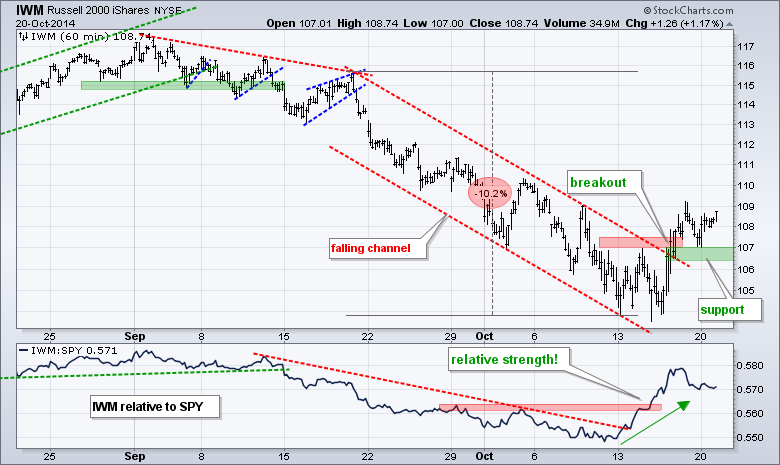
No change. IWM broke channel resistance with a surge above 107 and then fell back a little on Friday. The breakout is still holding and I will mark support at 106 for now. A move below this level would negate the breakout and could lead to a test of the early October low. The indicator window shows IWM outperforming SPY as the price relative surged above its early October high.
**************************************************************
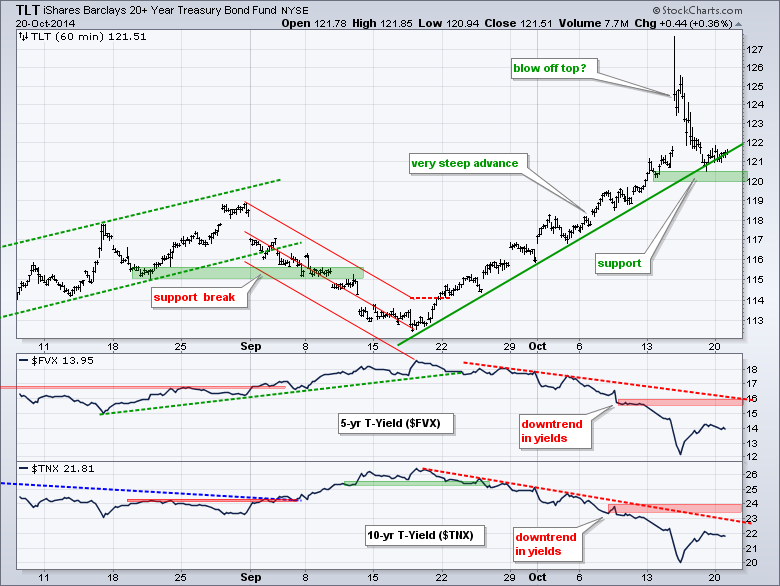
A move out of Treasuries is likely needed for the stock market to continue its rally and the 20+ YR T-Bond ETF (TLT) is near support. Overall, TLT remains in an uptrend since late September. Ignoring the spike above 127, this uptrend is pretty consistent and TLT is near the mid September trend line. I will raise support to 120. Before turning bearish on TLT, I would look for confirmation breakouts in the 5-year yield and the 10-yr yields.
**************************************************************
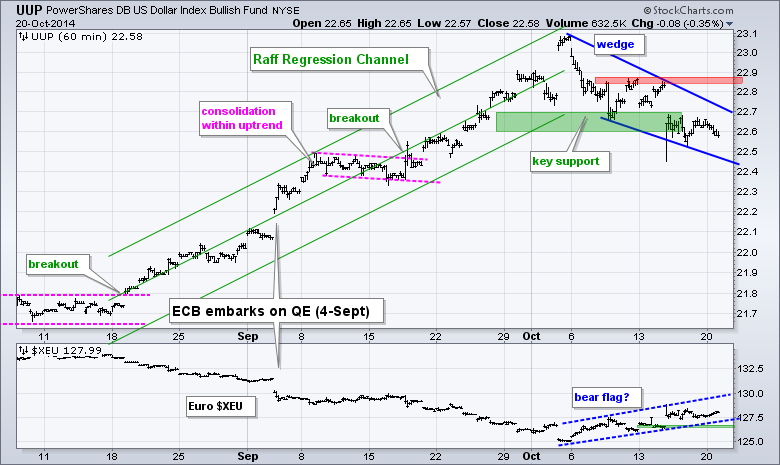
The Dollar corrected over the last few weeks and the Euro got an oversold bounce. UUP formed a falling wedge and broke below the early October lows last week. This is still viewed as a pullback within a bigger uptrend and I will mark resistance at 22.9. A breakout here would signal an end to the correction and resumption of the uptrend. The Euro Index ($XEU) has support at 127.
**************************************************************
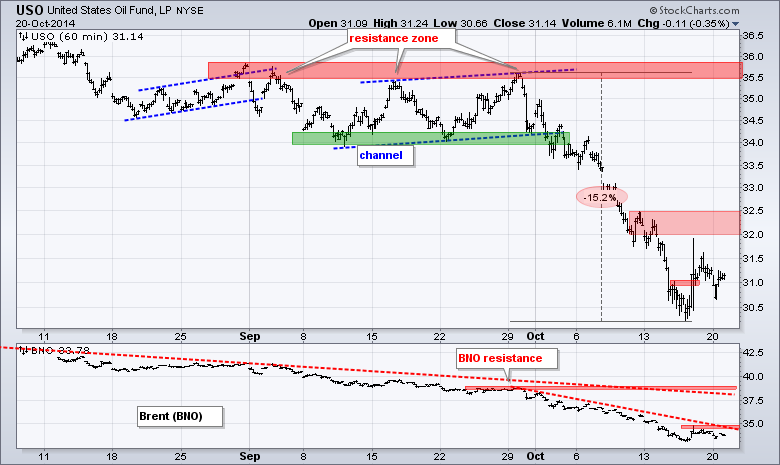
The USO Oil Fund (USO) got an oversold bounce with the break above 31 last week. This break is largely holding and oil is showing signs that this oversold bounce may continue. I am marking first resistance in the 32-32.50 area. The US Brent Oil ETF (BNO) has resistance at 35.
**************************************************************
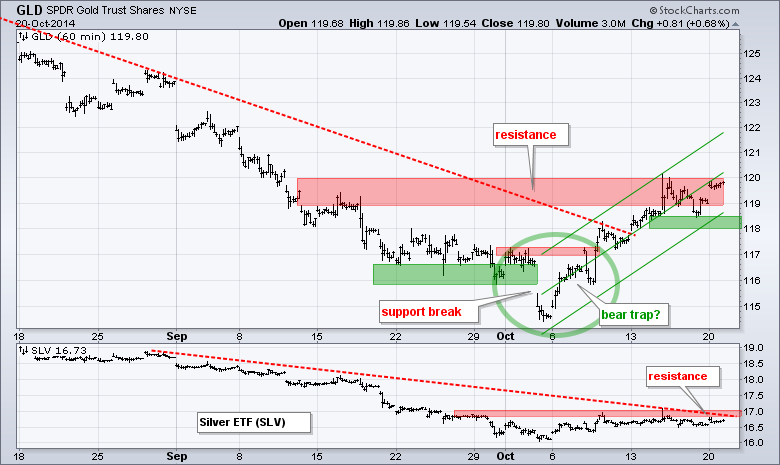
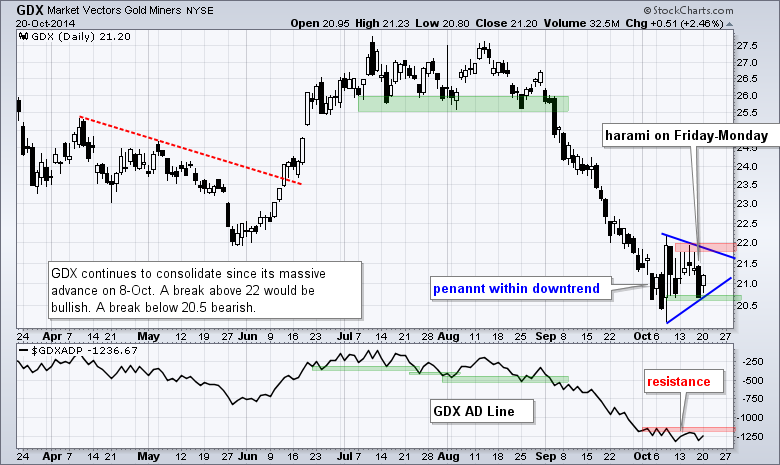
The Gold SPDR (GLD) is at its moment-of-truth as it stalls at resistance. I replaced the trend lines with a Raff Regression Channel and will mark support at 118. The swing here is up as long as 118 holds. A break would argue for a continuation of the bigger downtrend and a test of the early October lows. Chartists should watch the Dollar for clues because this bounce in gold coincides with a correction in the Dollar. Note that the Gold Miners ETF (GDX) formed an inside day and continues to consolidate. A breakout at 22 would be bullish.
***************************************************************
Key Reports and Events (all times Eastern):
Tue - Oct 21 - 10:00 - Existing Home Sales
Wed - Oct 22 - 07:00 - MBA Mortgage Index
Wed - Oct 22 - 08:30 - Consumer Price Index (CPI)
Wed - Oct 22 - 10:30 - Crude Oil Inventories
Thu - Oct 23 - 08:30 - Initial Jobless Claims
Thu - Oct 23 - 09:00 - FHFA Housing Price Index
Thu - Oct 23 - 10:00 - Leading Economic Indicators
Thu - Oct 23 - 10:30 - Natural Gas Inventories
Fri - Oct 24 - 10:00 - New Home Sales
Chart setups are on Tuesday and Thursday.
This commentary and charts-of-interest are designed to stimulate thinking. This analysis is not a recommendation to buy, sell, hold or sell short any security (stock ETF or otherwise). We all need to think for ourselves when it comes to trading our own accounts. First, it is the only way to really learn. Second, we are the only ones responsible for our decisions. Think of these charts as food for further analysis. Before making a trade, it is important to have a plan. Plan the trade and trade the plan. Among other things, this includes setting a trigger level, a target area and a stop-loss level. It is also important to plan for three possible price movements: advance, decline or sideways. Have a plan for all three scenarios BEFORE making the trade. Consider possible holding times. And finally, look at overall market conditions and sector/industry performance.
