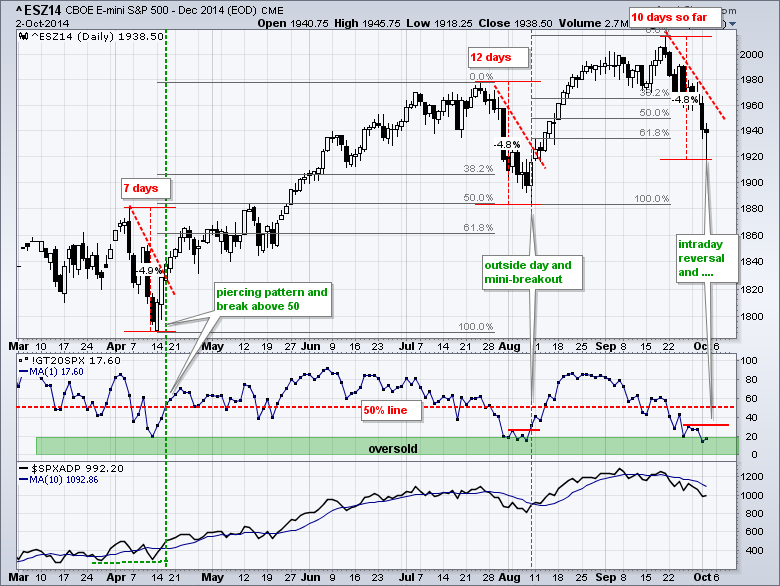
Stocks were hit with selling pressure in early trading, firmed at midday and then rallied in the afternoon. Small-caps and micro-caps led the way with the Russell 2000 iShares gaining 1% and the Russell MicroCap iShares surging 1.43%. Six of the nine sector SPDRs closed lower, but eight of the nine small-cap sector ETFs closed higher. Energy was the only small-cap sector to close lower. Here is a list of the small-cap sectors: pscd, pscf, psct, psci, psch, pscc, pscu, pscm, psce. Also note that the Retail SPDR (XRT) gained 1.30% and the Home Construction iShares (ITB) advanced .90% on the day. Yesterday's intraday reversal is the first sign of a near-term low, but bottom picking is a high-risk venture, especially with the employment report on deck. A positive reaction to the employment report and ISM Services would trigger a strong open and skew the reward-to-risk ratio for fresh longs. The chart below shows the emini forging its intraday reversal at the 62% retracement. The current decline is 4.8% from high to low and extends for ten days. A follow through close above 1970 would complete a short-term reversal. The indicator window shows the percent of S&P 500 stocks above their 20-day EMA. It was oversold on Wednesday and there are two levels to watch. A move above 32% would break the mini-resistance level and a move above 50% would trigger a bullish signal.
**This chart analysis is for educational purposes only, and should not
be construed as a recommendation to buy, sell or sell-short said securities**
**************************************************************
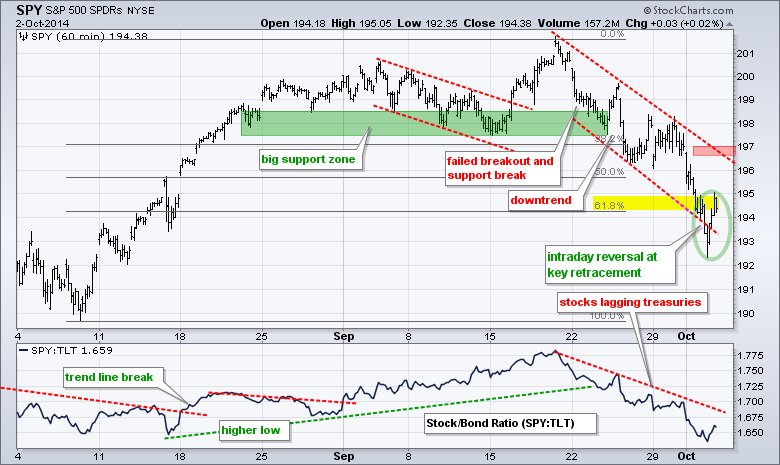
SPY broke below the lower trend line of the falling channel and then rebounded with a surge back above 194. This intraday reversal occurred near the 62% retracement and could set up a bounce. I am using the upper trend line of the falling channel to mark key resistance at 197.
**************************************************************
QQQ fell into the target zone and forged an intraday reversal on Thursday. The ETF dipped below 96 in the morning and closed above 97. This is the first sign that a near-term bottom is in. Unfortunately, the next resistance zone is quite far: 99-99.3. Waiting for a break above this level could skew the reward-to-risk ratio for new longs. It is probably best to wait for a pullback after a breakout.

**************************************************************
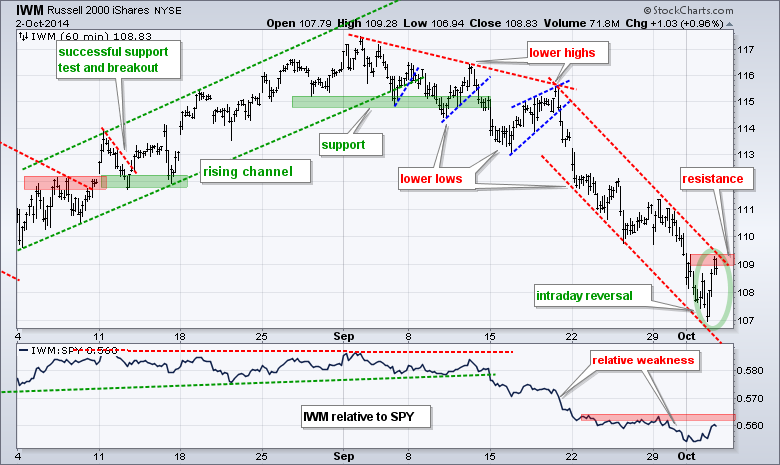
IWM also forged an intraday reversal and closed up around 1% on the day. Small-caps led the market for day as well. On the price chart, IWM closed near resistance from the September trend line. A follow thru break above 109 would be short-term bullish. I am, however, concerned that we could see some volatility in the coming days. This means it might be best to wait for a pullback after a breakout.
**************************************************************
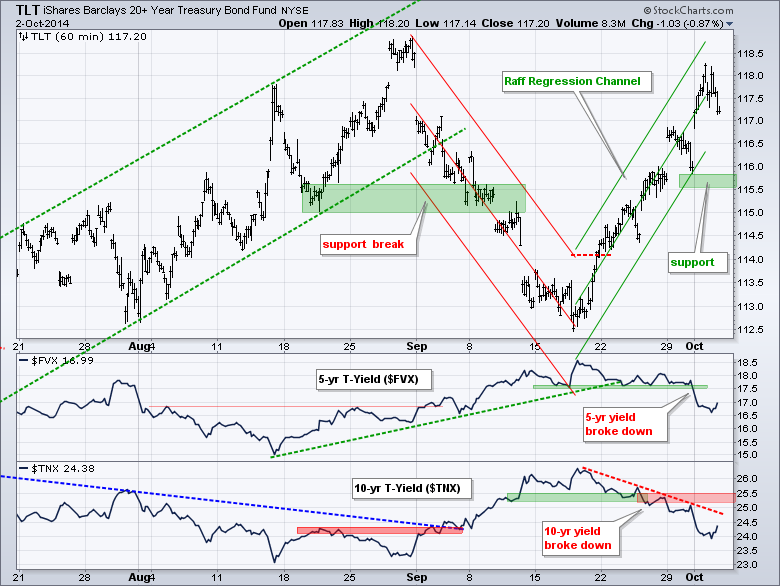
TLT remains in a steep uptrend that is defined by the Raff Regression Channel. I am marking key support at 115.50 for now. The indicator window shows the 5-year Treasury Yield ($FVX) breaking down on Wednesday. The 10-YR Treasury Yield ($TNX) broke down last week. Yields are moving lower and Treasuries are moving higher.
**************************************************************
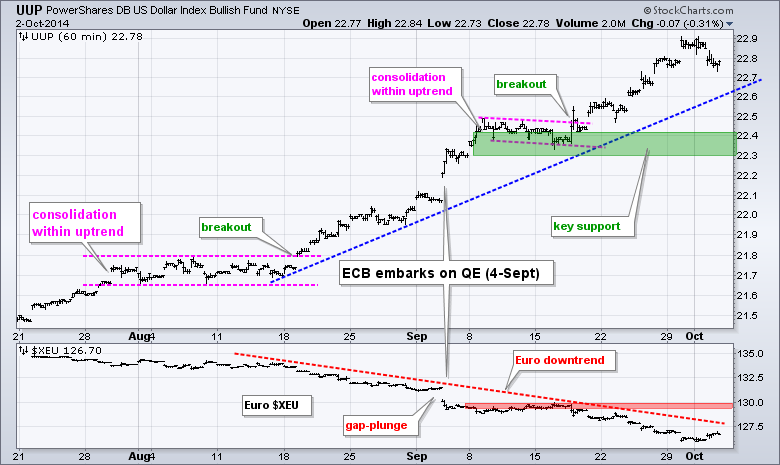
No change. UUP hit new highs for the move last week and remains in a strong uptrend. The mid September lows mark key support in the 22.3-22.4 area. The Euro Index ($XEU) is in a strong downtrend, which accelerated on 4-Sep when the European Central Bank (ECB) embarked on quantitative easing. The mid September highs mark resistance at 130.
**************************************************************
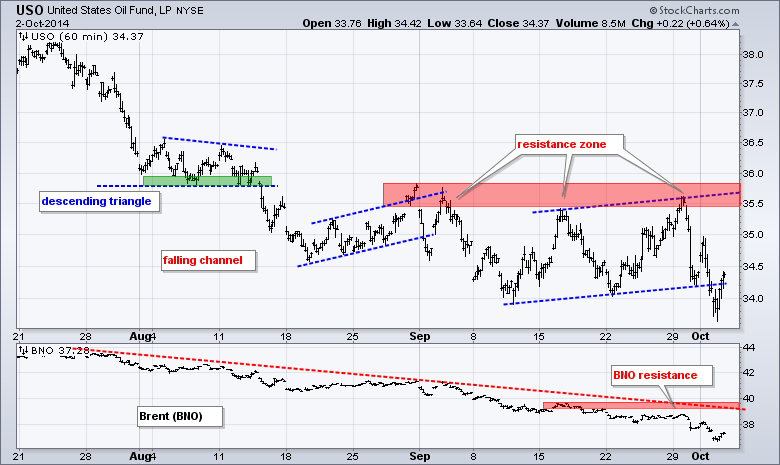
No change. USO poked its head above the mid September high and then promptly reversed course with a 3+ percent decline. Supply concerns got the blame. Higher output from Saudi Arabia and Libya pushed supply to 31 million barrels, versus OPEC's demand estimate of 29.2 million. The math is clear: supply > demand. USO broke upswing support to affirm the downtrend. The indicator window shows the US Brent Oil ETF (BNO) never making it to its mid September high and moving below 38. Oil is global and weakness in $BRENT was a warning that the bounce in USO would not hold. Yes, this is hindsight, but we can use this information in the future.
**************************************************************
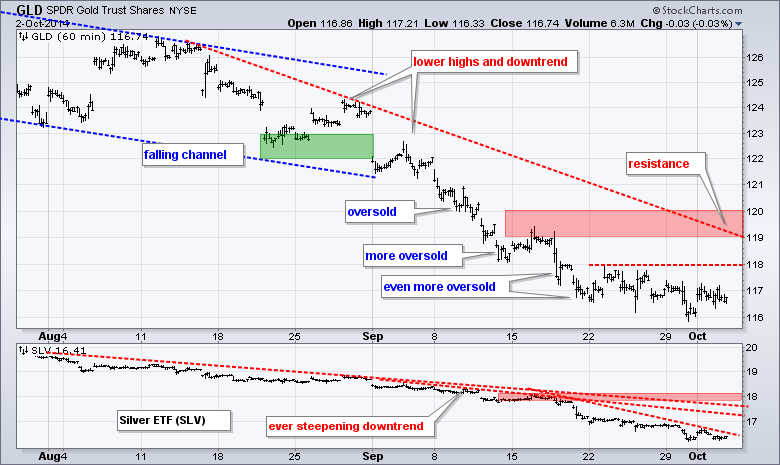
No change. GLD cannot hold a bid to save its life. The ETF became oversold in mid September, stalled for a week and then broke consolidation support this week. Chartists can mark first resistance at 118. I will leave key resistance at 120. The indicator window shows the Silver ETF (SLV) within an accelerating downtrend. Notice how the red trend lines get steeper and steeper. First resistance is set at 17 and key resistance is set at 18.2.
***************************************************************
Key Reports and Events (all times Eastern):
Fri - Oct 03 - 08:30 - Employment Report
Fri - Oct 03 - 10:00 - ISM Services Index
Chart Setups on Tuesday and Thursday.
This commentary and charts-of-interest are designed to stimulate thinking. This analysis is not a recommendation to buy, sell, hold or sell short any security (stock ETF or otherwise). We all need to think for ourselves when it comes to trading our own accounts. First, it is the only way to really learn. Second, we are the only ones responsible for our decisions. Think of these charts as food for further analysis. Before making a trade, it is important to have a plan. Plan the trade and trade the plan. Among other things, this includes setting a trigger level, a target area and a stop-loss level. It is also important to plan for three possible price movements: advance, decline or sideways. Have a plan for all three scenarios BEFORE making the trade. Consider possible holding times. And finally, look at overall market conditions and sector/industry performance.


