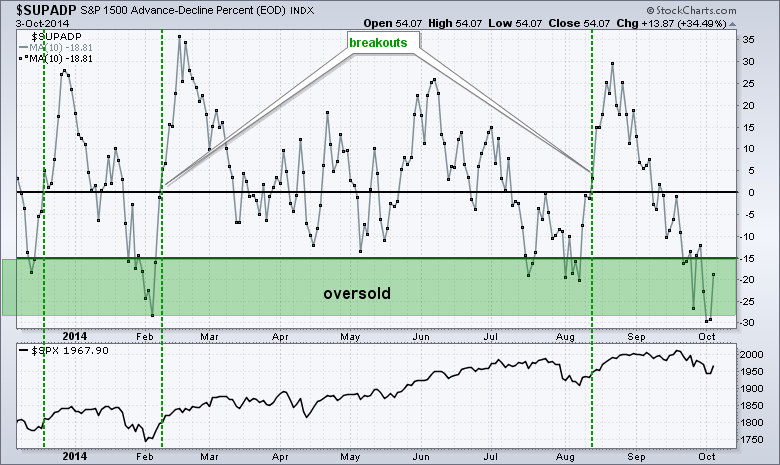
Stocks reversed course intraday on Thursday and followed this reversal with a gap-surge on Friday. The gains for the day were modest as the S&P 500 SPDR added 1.10% and the Russell 2000 iShares gained .75% on the day. Eight of the nine sector SPDRs were higher with healthcare, consumer discretionary, finance, industrials and consumer staples leading. The Home Construction iShares and the Retail SPDR led the consumer discretionary sector higher. Steel, precious metals, mining, coal and energy stocks were weak. The Thursday-Friday reversals in the major index ETFs are still in the early stages, similar to a rocket blasting off. The first stage is the oversold bounce, the second stage would be breadth breakouts and the third stage would be challenges to prior highs. The chart below shows the percentage of S&P 1500 stocks above their 20-day EMA. This indicator got a bounce, but remains in oversold territory (below -15%). A surge into positive territory would trigger a bullish signal similar to the ones we saw in early February and August. A little help from small-caps and mid-caps will be needed to get this broad-based breadth indicator moving higher.
**This chart analysis is for educational purposes only, and should not
be construed as a recommendation to buy, sell or sell-short said securities**
**************************************************************
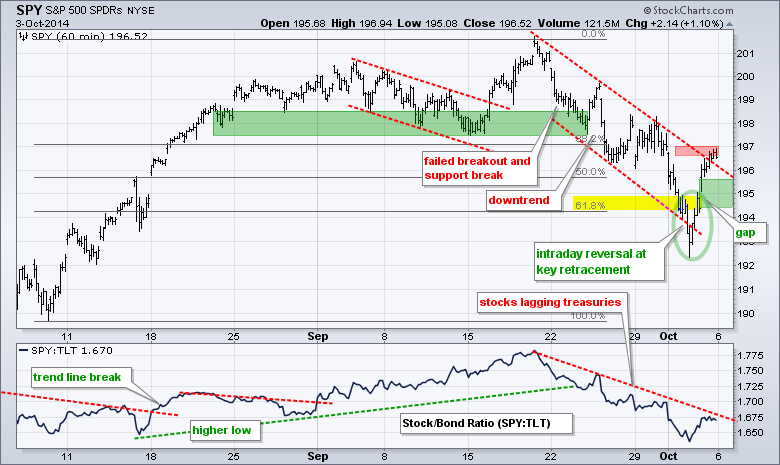
SPY forged an intraday reversal on Thursday and followed thru with a gap-surge on Friday. This short-term bullish reversal is dependent on the gap-surge for its validity. I am, therefore, marking a support zone in the 194.5-195.5 area. A move below this support zone would negate the gap-surge and warrant a reassessment.
**************************************************************
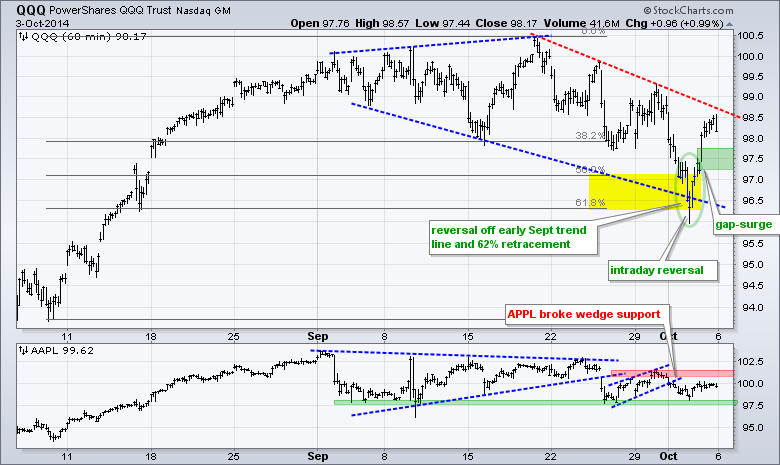
QQQ reversed near the 62% retracement and the early September trend line (blue) with a surge above 98. Even though the ETF has yet to break falling the mid September trend line (red), I will treat the Thursday-Friday reversal as bullish as long as it holds. The gap-surge marks first support in the 97.5 area and a move below 97.2 would negate the breakout.
**************************************************************
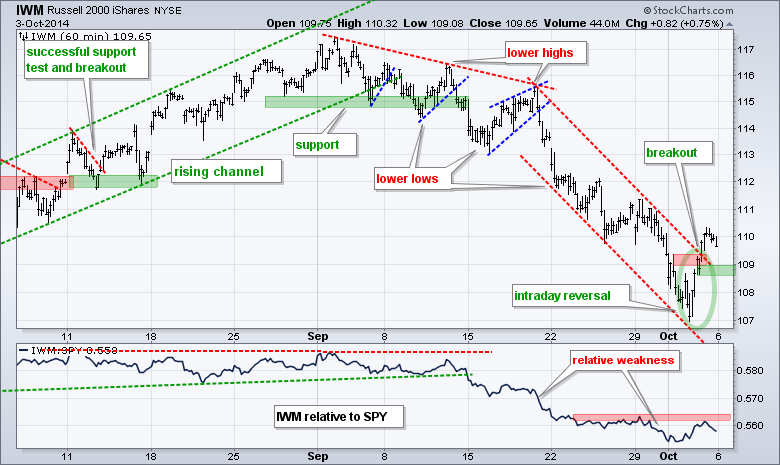
IWM forged an intraday reversal on Thursday and broke out on Friday with follow through above 109.5. The trend line break and gap mark support in the 108.5-109 area. A move below 108.5 would show cold feet and I would then reassess this breakout. The indicator window shows IWM underperforming SPY the entire month of September. A break above the red resistance zone is needed to show relative strength again.
**************************************************************
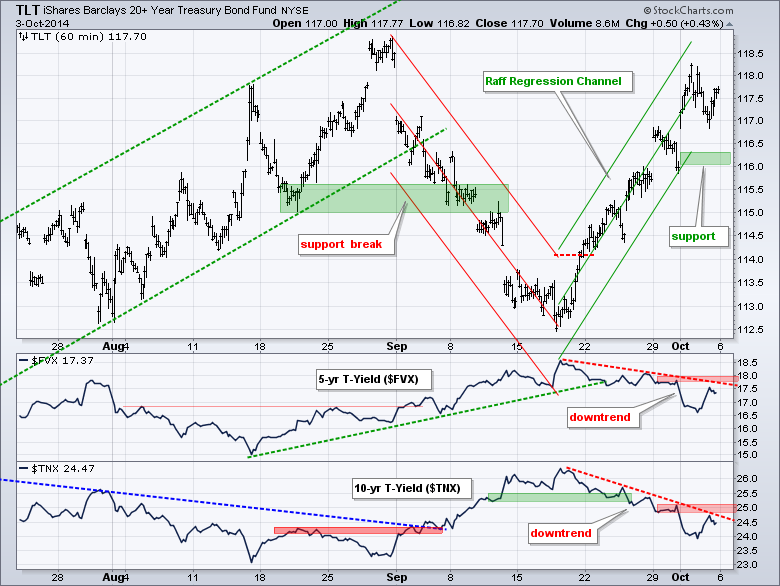
The 20+ YR T-Bond ETF (TLT) remains in a steep uptrend and I am using the Raff Regression Channel to define this advance. The lower trend line and a buffer mark support at 116. I will remain short-term bullish on Treasuries as long as the 5-year Treasury Yield ($FVX) and the 10-YR Treasury Yield ($TNX) remain in downtrends. The indicator windows show both with resistance levels marked in red.
**************************************************************
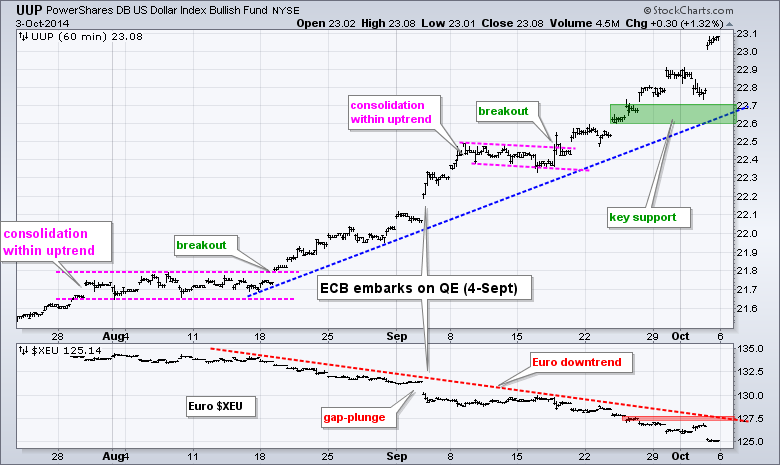
UUP is in the midst of a moonshot as the Euro continues to plunge. The quantitative easing announcement by the ECB on 4-Sept was a true watershed event. Even so, both the Dollar and the Euro are getting extended. I am marking UUP support in the 22.69-22.7 area and Euro resistance in the 127.5 area.
**************************************************************
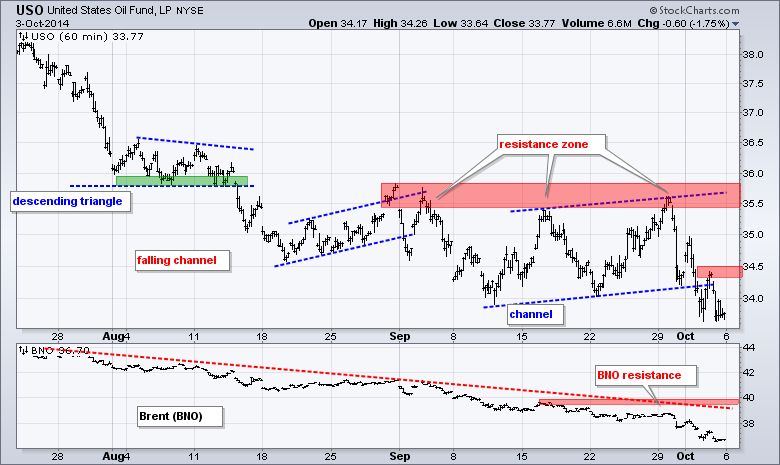
A strong Dollar, increasing support and weakening demand are weighing on oil. The USO Oil Fund (USO) broke channel support last week to signal a continuation lower. The broken support levels mark first resistance in the 34.5 area. I am leaving key resistance at 35.8 though. The US Brent Oil ETF (BNO) also sank to new lows and key resistance is set at 40
**************************************************************
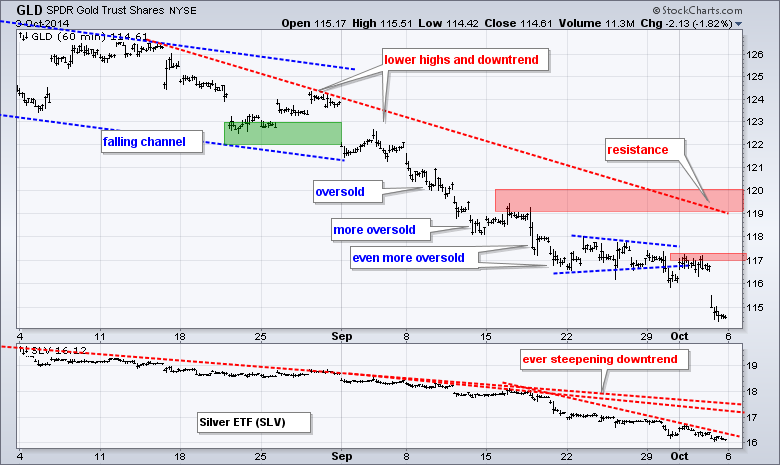
Strength in the Dollar is also taking its toll on gold, which sank to a new low for the year. The Gold SPDR (GLD) plunged below 115 as the Dollar surged on Friday. Last week's highs mark first resistance in the 117.2 area. The August trend line and mid September highs mark key resistance in the 119-120 area.
***************************************************************
Key Reports and Events (all times Eastern):
Tue - Oct 07 - 10:00 - JOLTS - Job Openings
Tue - Oct 07 - 15:00 - Consumer Credit
Wed - Oct 08 - 07:00 - MBA Mortgage Index
Wed - Oct 08 - 10:30 - Crude Inventories
Wed - Oct 08 - 14:00 - FOMC Minutes
Thu - Oct 09 - 08:30 - Continuing Claims
Thu - Oct 09 - 10:30 - Natural Gas Inventories
Chart Setups on Tuesday and Thursday.
This commentary and charts-of-interest are designed to stimulate thinking. This analysis is not a recommendation to buy, sell, hold or sell short any security (stock ETF or otherwise). We all need to think for ourselves when it comes to trading our own accounts. First, it is the only way to really learn. Second, we are the only ones responsible for our decisions. Think of these charts as food for further analysis. Before making a trade, it is important to have a plan. Plan the trade and trade the plan. Among other things, this includes setting a trigger level, a target area and a stop-loss level. It is also important to plan for three possible price movements: advance, decline or sideways. Have a plan for all three scenarios BEFORE making the trade. Consider possible holding times. And finally, look at overall market conditions and sector/industry performance.


