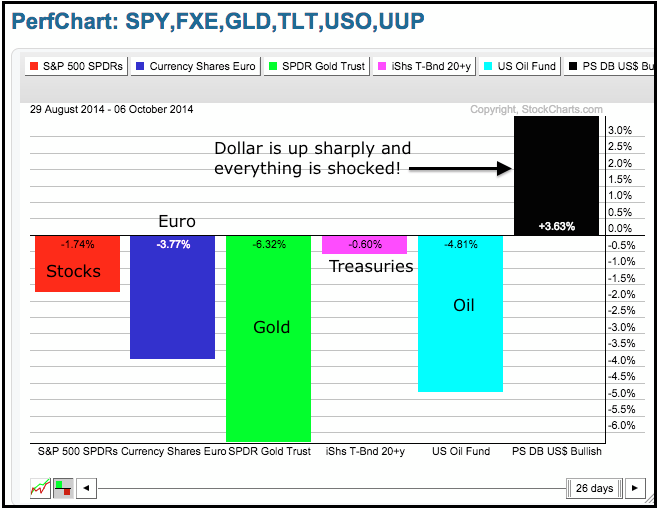
Stocks face several headwinds over the next few weeks and this could make for choppy trading, or even further weakness. First, midterm elections are four weeks away and this could create uncertainty. Second, earnings season kicks off with Alcoa on October 8th and runs until the end of the month. Third, as noted in the Market Message on Monday, the Russell 2000 has underperformed the S&P 500 65% of the time in October over the last twenty years. Fourth, the market is still trying to figure out how a strong Dollar will impact stocks. It is not so much the strong Dollar that is at issue here. Instead, it is the steepness and sharpness of the recent surge. The chart below shows the Performance for the inter-market ETFs (SPY,FXE,GLD,TLT,USO,UUP). The US Dollar ETF (UUP) is up 3.63% since the beginning of September and everything else is down. Even the 20+ YR T-Bond ETF (TLT) is down .60% over the last 26 trading days. Talk about a Dollar shock!
**This chart analysis is for educational purposes only, and should not
be construed as a recommendation to buy, sell or sell-short said securities**
**************************************************************
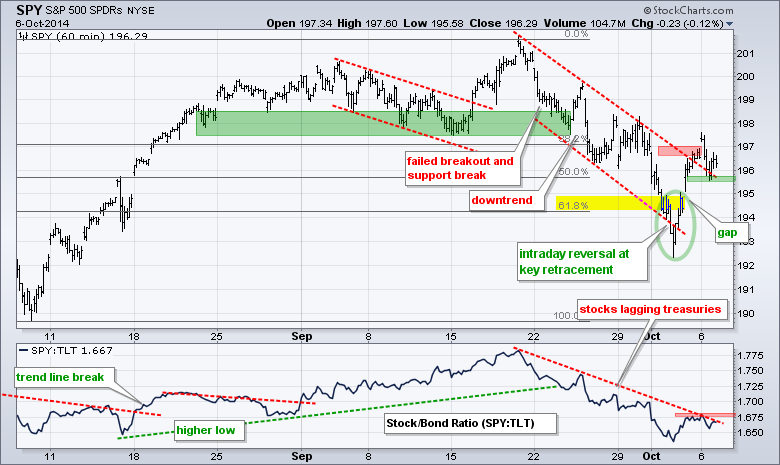
SPY opened above 197 and then fell back immediately after the open. The ETF is holding most of the Thursday-Friday gains and the cup is still half full. I am, however, concerned that this reversal-breakout will fail and would mark support quite tight. A move below 195.4 would provide the first sign that the breakout is failing. The indicator window shows SPY underperforming TLT since mid September. A breakout here is needed to show more confidence in stocks.
**************************************************************
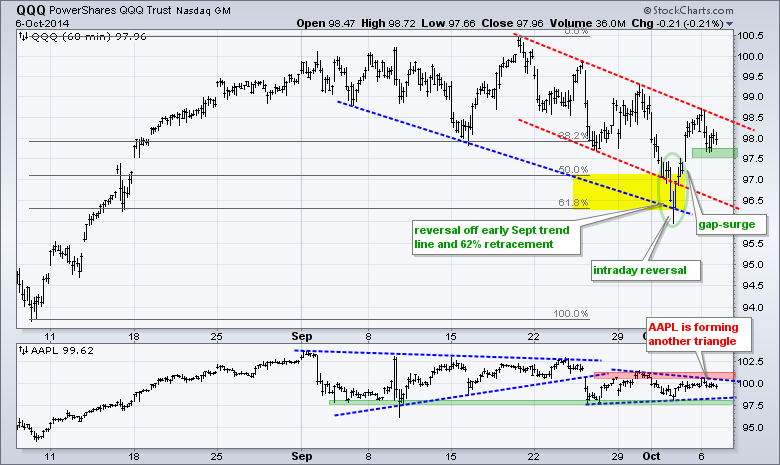
QQQ reversed on Thursday, surged on Friday and fell back on Monday. A small fall back is ok, but I am not giving this reversal much wiggle room because the ETF turned back at the mid September trend line. A move below 97.5 would suggest that the bulls are getting cold feet and the downtrend could then resume. The indicator window shows AAPL forming another triangle after the late September triangle break.
**************************************************************
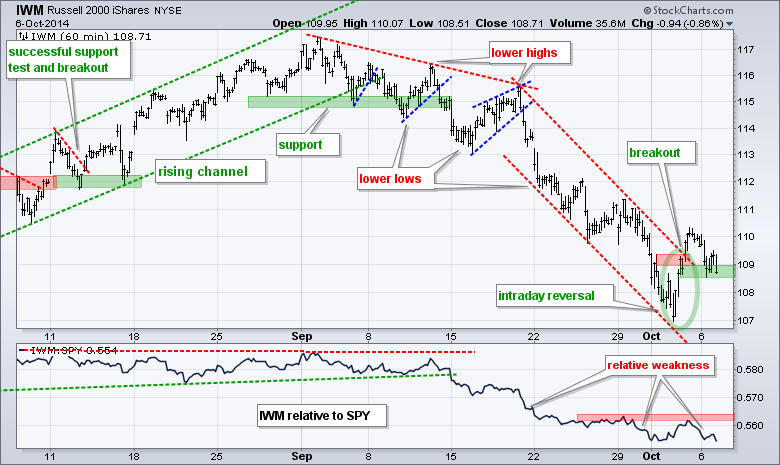
IWM surged to 110 early Friday and then moved below 109 on Monday. This breakout is already in jeopardy and small-caps continue to show relative weakness. This is not a good combination and a move below 108.5 would suggest that the breakout is failing. The indicator window shows the IWM:SPY ratio sinking again over the last two days.
**************************************************************
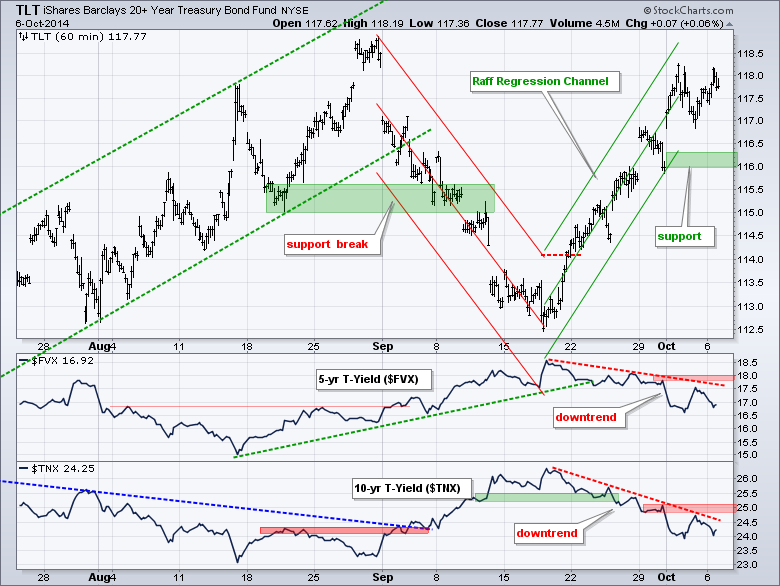
No change. The 20+ YR T-Bond ETF (TLT) remains in a steep uptrend and I am using the Raff Regression Channel to define this advance. The lower trend line and a buffer mark support at 116. I will remain short-term bullish on Treasuries as long as the 5-year Treasury Yield ($FVX) and the 10-YR Treasury Yield ($TNX) remain in downtrends. The indicator windows show both with resistance levels marked in red.
**************************************************************
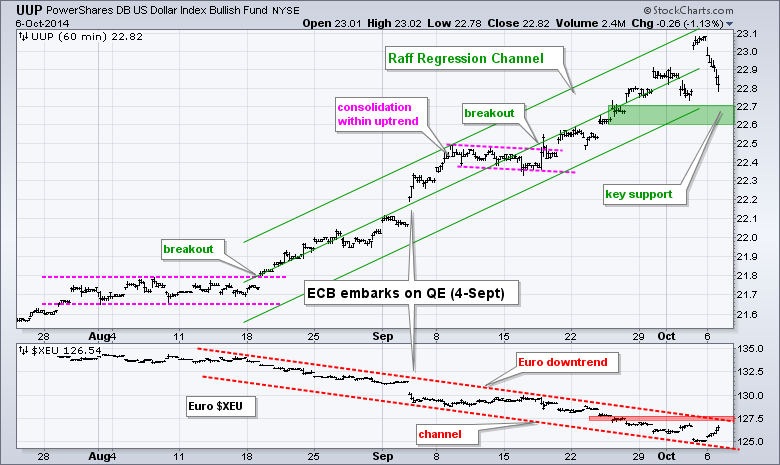
No change. UUP is in the midst of a moonshot as the Euro continues to plunge. The quantitative easing announcement by the ECB on 4-Sept was a true watershed event. Even so, both the Dollar and the Euro are getting extended. I am marking UUP support in the 22.69-22.7 area and Euro resistance in the 127.5 area.
**************************************************************
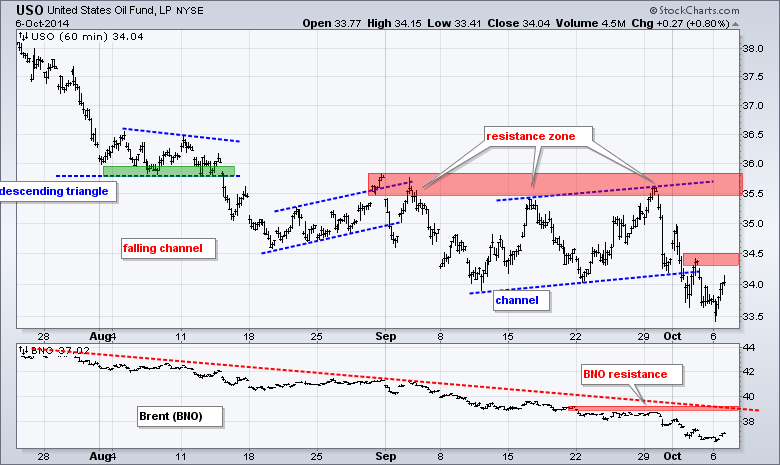
No change. A strong Dollar, increasing support and weakening demand are weighing on oil. The USO Oil Fund (USO) broke channel support last week to signal a continuation lower. The broken support levels mark first resistance in the 34.5 area. I am leaving key resistance at 35.8 though. The US Brent Oil ETF (BNO) also sank to new lows and key resistance is set at 40
**************************************************************
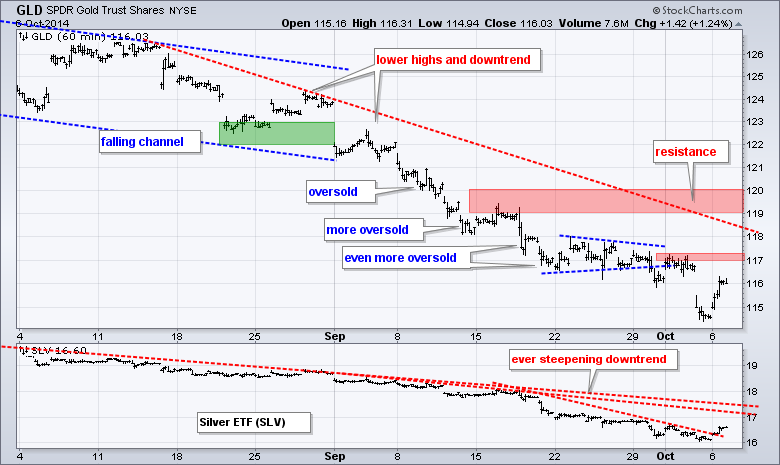
No change. Strength in the Dollar is also taking its toll on gold, which sank to a new low for the year. The Gold SPDR (GLD) plunged below 115 as the Dollar surged on Friday. Last week's highs mark first resistance in the 117.2 area. The August trend line and mid September highs mark key resistance in the 119-120 area.
***************************************************************
Key Reports and Events (all times Eastern):
Tue - Oct 07 - 10:00 - JOLTS - Job Openings
Tue - Oct 07 - 15:00 - Consumer Credit
Wed - Oct 08 - 07:00 - MBA Mortgage Index
Wed - Oct 08 - 10:30 - Crude Inventories
Wed - Oct 08 - 14:00 - FOMC Minutes
Thu - Oct 09 - 08:30 - Continuing Claims
Thu - Oct 09 - 10:30 - Natural Gas Inventories
Tue - Nov 04 - 09:00 - Midterm Elections
Chart Setups on Tuesday and Thursday.

This commentary and charts-of-interest are designed to stimulate thinking. This analysis is not a recommendation to buy, sell, hold or sell short any security (stock ETF or otherwise). We all need to think for ourselves when it comes to trading our own accounts. First, it is the only way to really learn. Second, we are the only ones responsible for our decisions. Think of these charts as food for further analysis. Before making a trade, it is important to have a plan. Plan the trade and trade the plan. Among other things, this includes setting a trigger level, a target area and a stop-loss level. It is also important to plan for three possible price movements: advance, decline or sideways. Have a plan for all three scenarios BEFORE making the trade. Consider possible holding times. And finally, look at overall market conditions and sector/industry performance.


