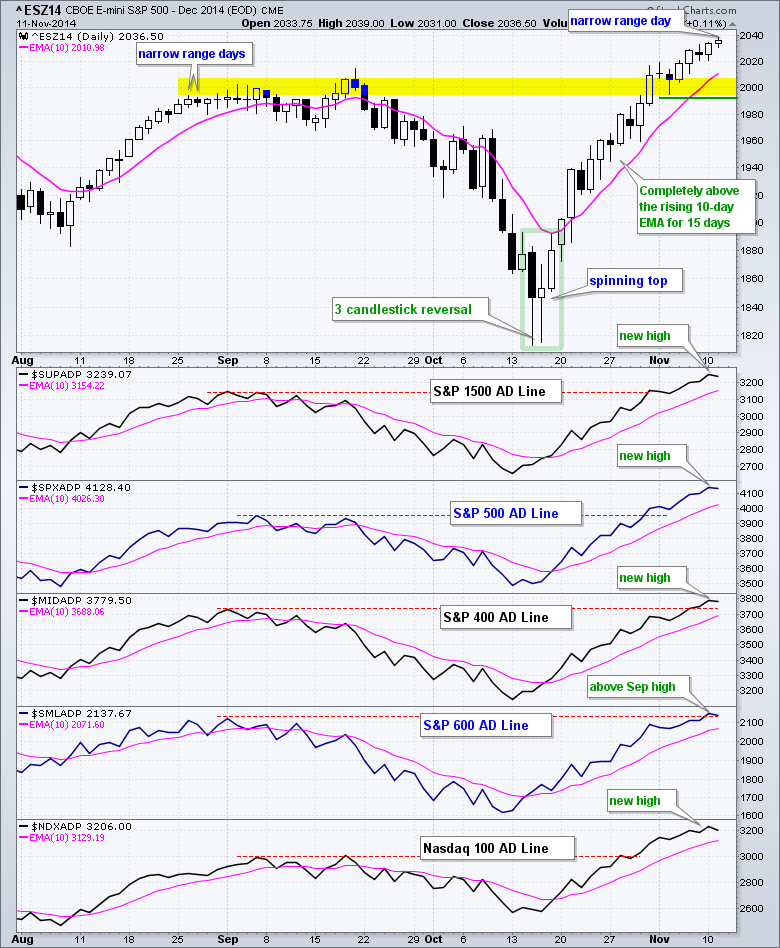
Trading was rather lackluster on Tuesday as the major index ETFs finished with fractional gains, and I do mean fractional. QQQ gained .31%, SPY rose .10% and IWM advanced .07%. Buying pressure is waning, but we have yet to see any significant selling pressure. Of note, the high-low range for the December E-mini S&P 500 (^ESZ14) was the smallest since the rally began. This is called a narrow range day and it signals some serious indecision. As with a doji, the narrow range day is the first step to a possible short-term reversal or pullback. Note that there were narrow range days in late August and the S&P 500 traded flat for the next two weeks. Even if we get a break below 2020 and some sort of short-term reversal, I would not expect it to last long and would look for support in the 2000 area. I am raising support to 1990.
**This chart analysis is for educational purposes only, and should not
be construed as a recommendation to buy, sell or sell-short said securities**
Even though I don't trade the e-mini, I like to use it for analysis purposes because it trades 23 hours a day and does not have the clutter of an ETF (dividends, management fees, NYSE hours). It is just another way of looking at the S&P 500, which is the benchmark for the stock market. You can find out more at cmegroup.com.
Short-term Overview (12-November-2014):
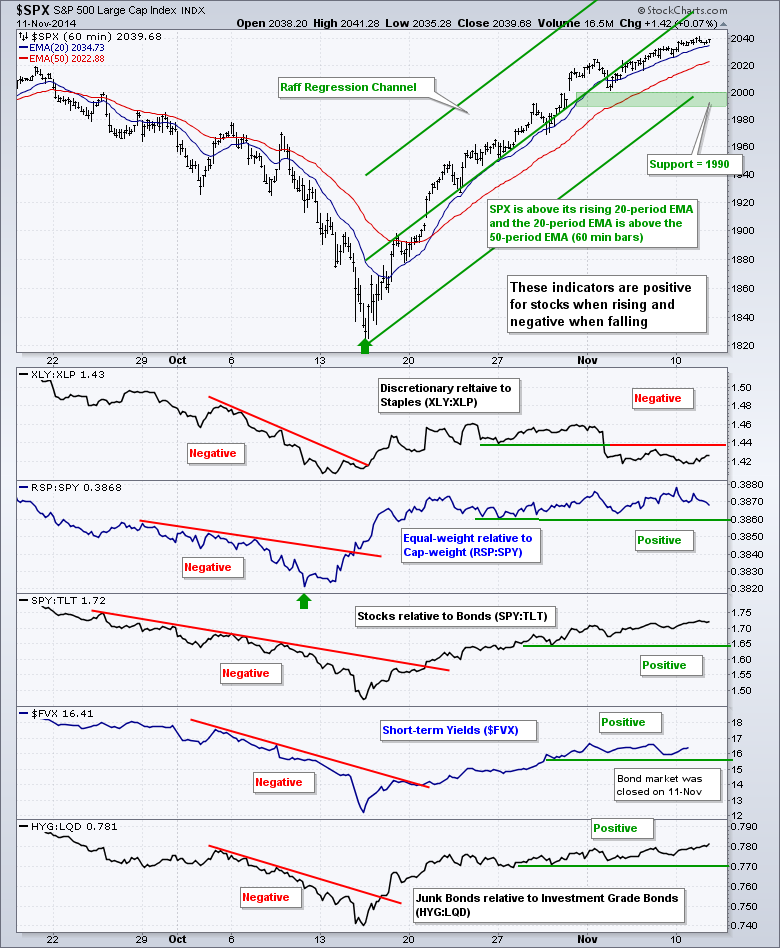
- Four of the five risk indicators remain positive for stocks.
- All five AD Lines are in short-term uptrends.
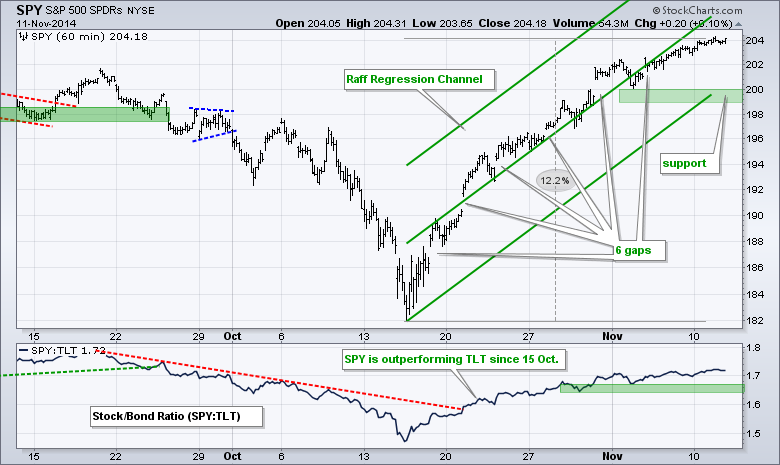
- SPY is stalling within an uptrend and I raised key support to 199.
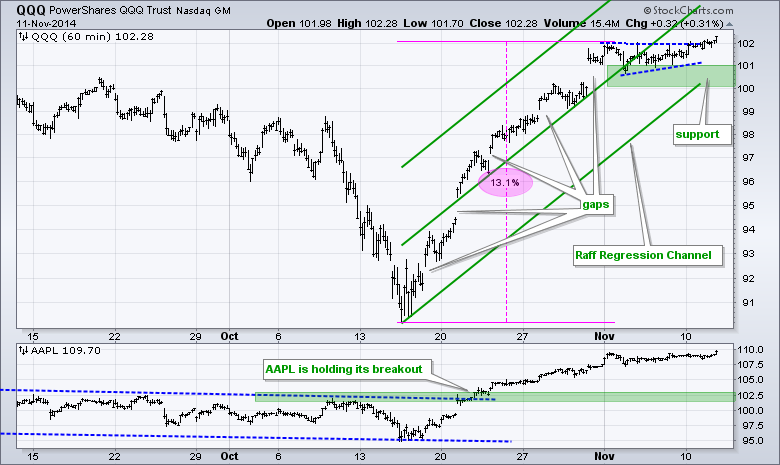
- QQQ broke pennant resistance on Tuesday and support remains at 100.
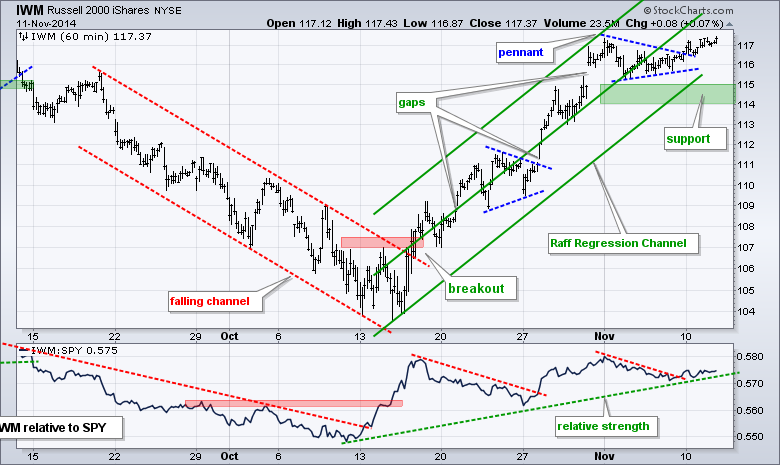
- IWM broke pennant resistance on Friday and support remains at 114.
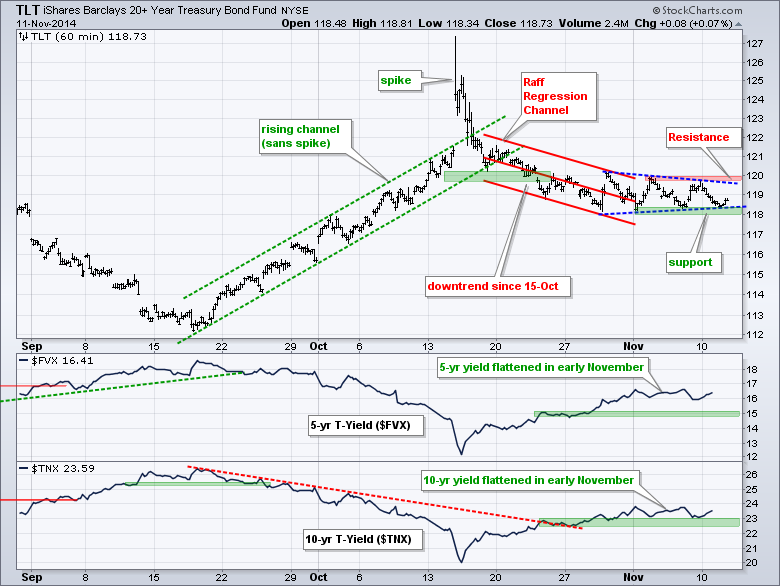
- TLT remains within a downtrend and I am watching pennant support at 118.
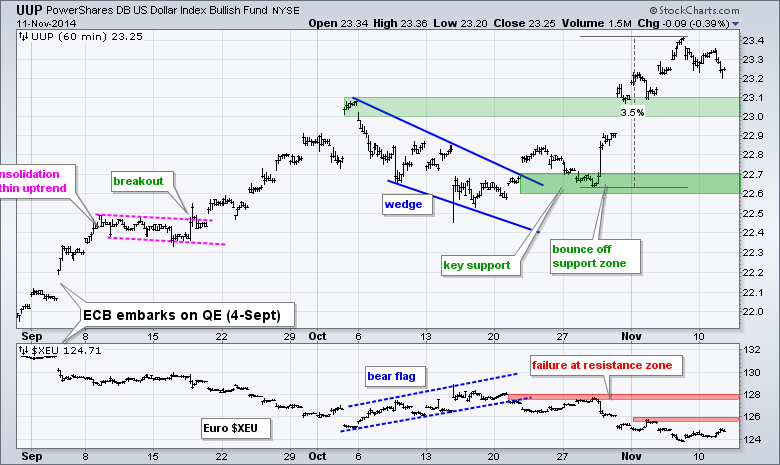
- UUP pulled back after a big surge and first support is at 23-23.1.
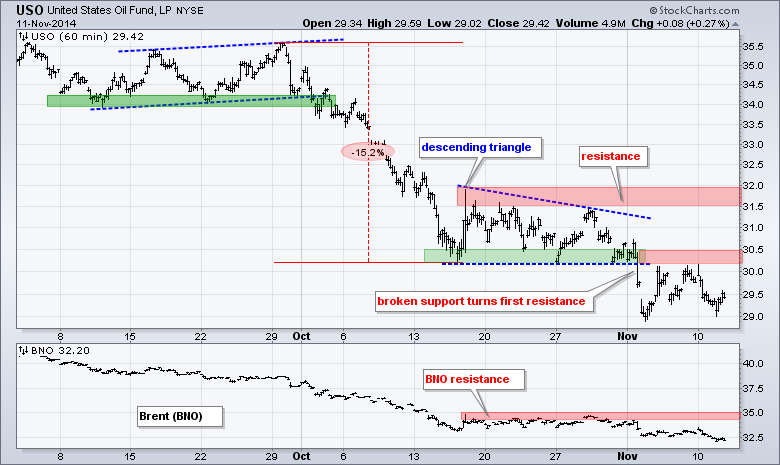
- USO remains below its support break, which turned into resistance.
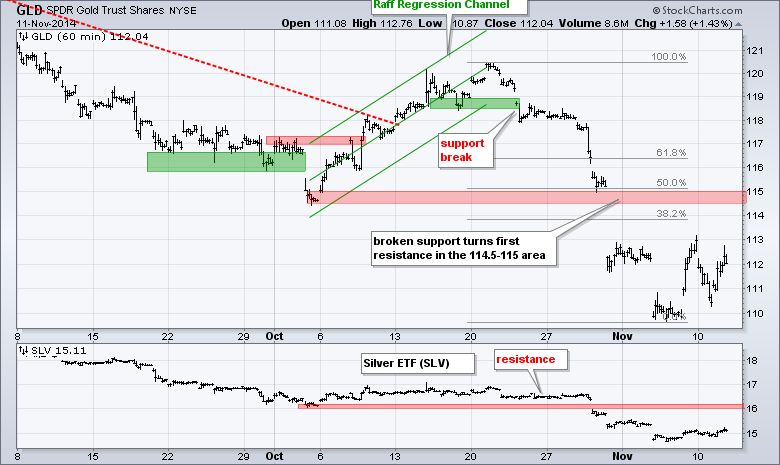
- GLD is turning volatile, but remains within an overall downtrend.
There is no change with the risk on-off chart. The XLY:XLP ratio broke down and remains below this break. The other risk indicators are either rising or flat. Either way, they are above their green support lines and remain positive for stocks. The bond market was closed on Tuesday so there is no data for the 5-year Treasury Yield ($FVX).
SPY stalled in the 204 area, but remains in an uptrend and I raised key support to the 199-200 area. The Raff Regression Channel, early November low and a buffer mark support here.
**************************************************************
QQQ moved to a new high and broke the pennant trend line. The Raff Regression Channel, pennant lows and a buffer mark key support in the 100-101 area.
**************************************************************
No change. IWM consolidated last week with a pennant and broke out on Friday-Monday to signal a continuation of the current uptrend. With a new closing high on Monday, I extended the Raff Regression Channel and raised key support to the 114-115 area.
**************************************************************
The bond market was closed on Tuesday so the 20+ YR T-Bond ETF (TLT) did not do much. The short-term trend is down because the ETF peaked in mid October. A triangle formed in November as TLT consolidated. A break below 118 would signal a continuation lower and this would be positive for stocks. A break above 120, however, would be bullish and this would be negative for stocks.
**************************************************************
No change. The US Dollar ETF (UUP) bottomed in mid October and surged over 3% the last seven days. The ETF may be short-term overbought, but the overall trend is clearly up. Broken resistance marks first support in the 23-23.1 area. Key support remains in the 22.6-22.7 area. First resistance for the Euro Index ($XEU) is set at 126 and key resistance at 128.
**************************************************************
No change. The USO Oil Fund (USO) broke support early last week and bounced back to broken support, which turns first resistance. While a move back above the support break would be positive, I would not turn bullish because this is a minor resistance level and the bigger downtrend still dominates. A break above 32 would be deemed short-term bullish and argue for a retracement of the October-November decline.
**************************************************************
Let the swings begin. The Gold SPDR (GLD) surged almost 3% on Friday, plunged over 2% on Monday and advanced 1.43% on Tuesday. There may be some support in the 110 area and the ETF is still quite oversold, but the bigger trend is down and this is the dominant force. I will leave first resistance in the 115 area.
***************************************************************
Key Reports and Events (all times Eastern):
Wed - Nov 12 - 07:00 - MBA Mortgage Index
Thu - Nov 13 - 08:30 - Initial Jobless Claims
Thu - Nov 13 - 10:00 - JOLTS Report
Thu - Nov 13 - 10:30 - NatGas Inventories
Thu - Nov 13 - 11:00 - Crude Oil Inventories
Fri - Nov 14 - 08:30 - Retail Sales
Fri - Nov 14 - 09:55 - Michigan Sentiment
Charts of Interest are on Tuesdays and Thursdays.
This commentary and charts-of-interest are designed to stimulate thinking. This analysis is not a recommendation to buy, sell, hold or sell short any security (stock ETF or otherwise). We all need to think for ourselves when it comes to trading our own accounts. First, it is the only way to really learn. Second, we are the only ones responsible for our decisions. Think of these charts as food for further analysis. Before making a trade, it is important to have a plan. Plan the trade and trade the plan. Among other things, this includes setting a trigger level, a target area and a stop-loss level. It is also important to plan for three possible price movements: advance, decline or sideways. Have a plan for all three scenarios BEFORE making the trade. Consider possible holding times. And finally, look at overall market conditions and sector/industry performance.


