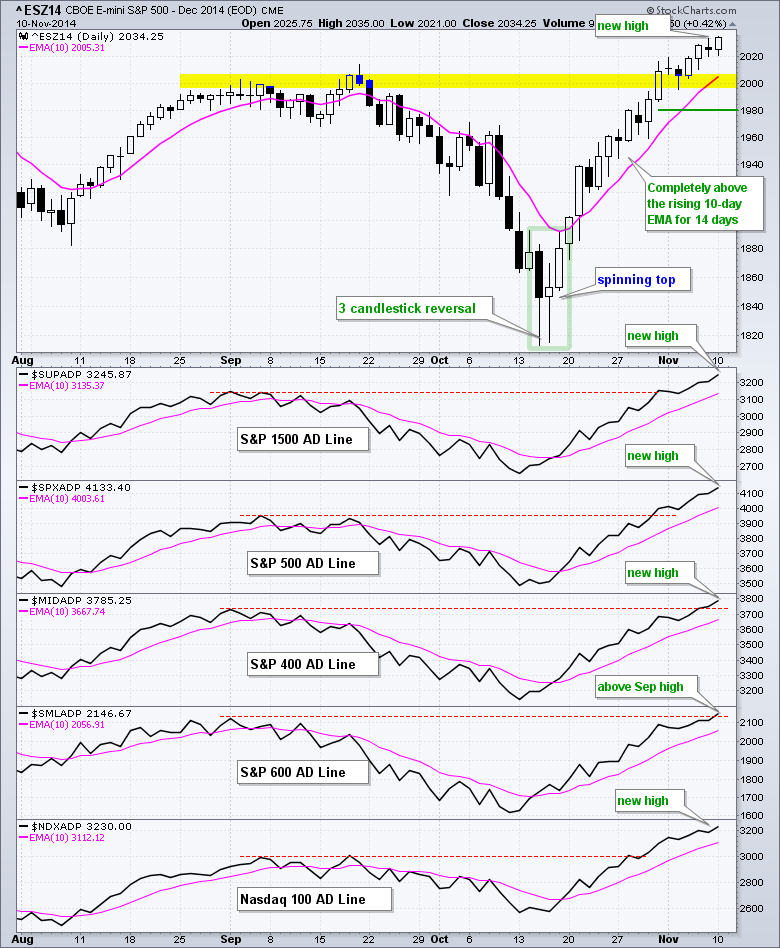
The December E-mini S&P 500 (^ESZ14) hit another new high with another incremental step. Since the close above 2000 at the end of October, the gains have been rather incremental and upside momentum has slowed. Is this bearish? Buying pressure may not be as strong as it was in October, but buying pressure is still stronger than selling pressure and this is not bearish. Even though stocks appear short-term overbought and ripe for a correction, that does not mean we will get one. The yellow shading marks the first support zone in the 2000 area and the 10-day EMA is at 2005. I think this area will act as the first support zone on any pullback. I will leave key support at 1980 for now.
**This chart analysis is for educational purposes only, and should not
be construed as a recommendation to buy, sell or sell-short said securities**
Short-term Overview (10-November-2014):
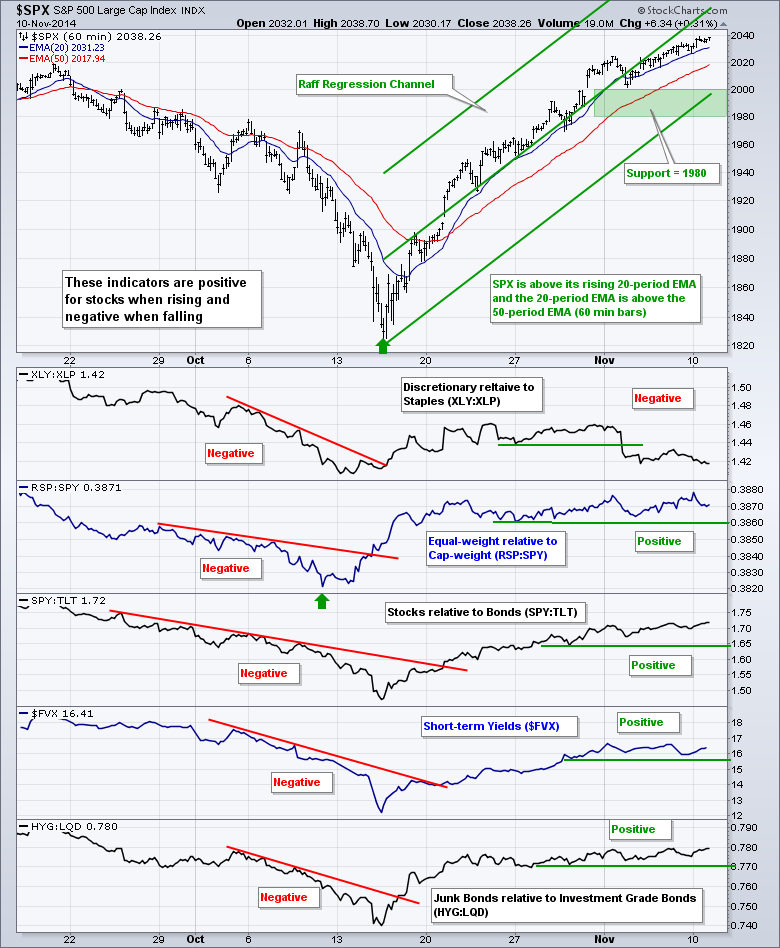
- Four of the five risk indicators remain positive for stocks.
- Breadth is bullish as all five AD Lines exceeded their September highs.
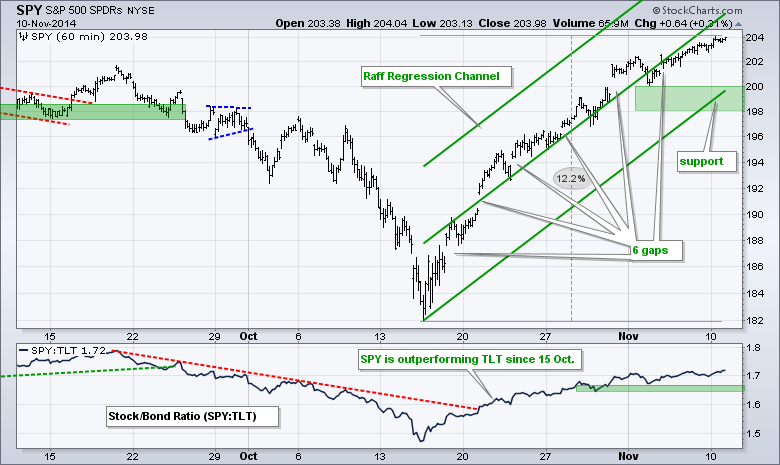
- SPY hit a new high for the move and key support remains at 198.
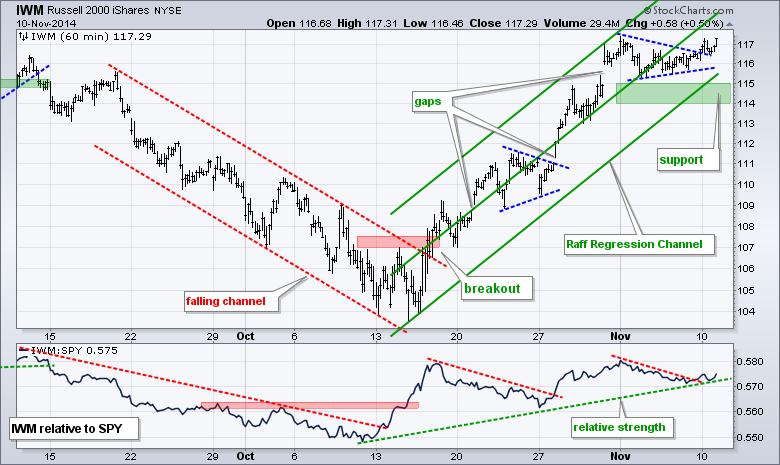
- IWM broke pennant resistance and I raised key support to 114.
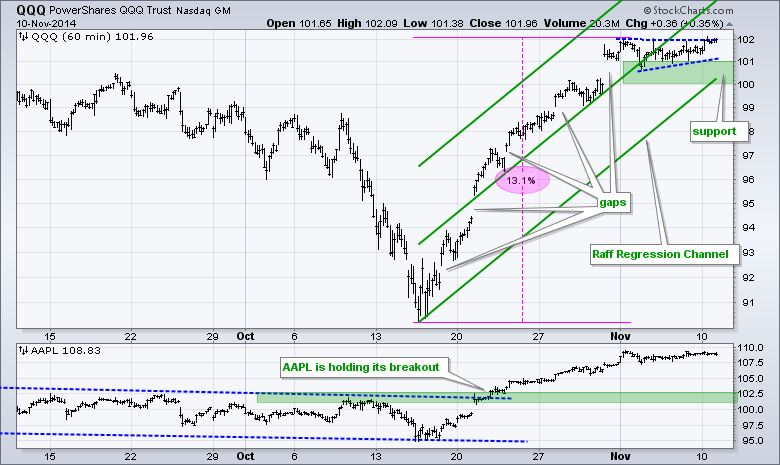
- QQQ is challenging pennant resistance and I raised key support to 100.
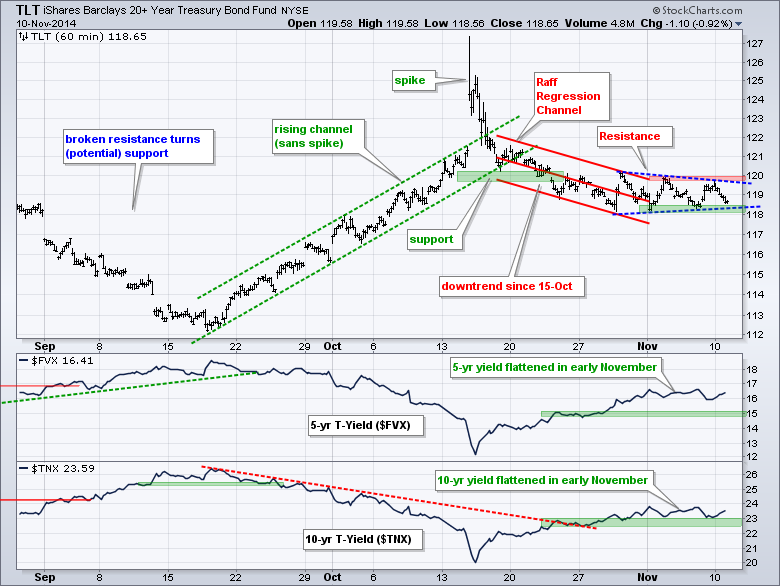
- TLT formed a pennant and moved to support on Monday.
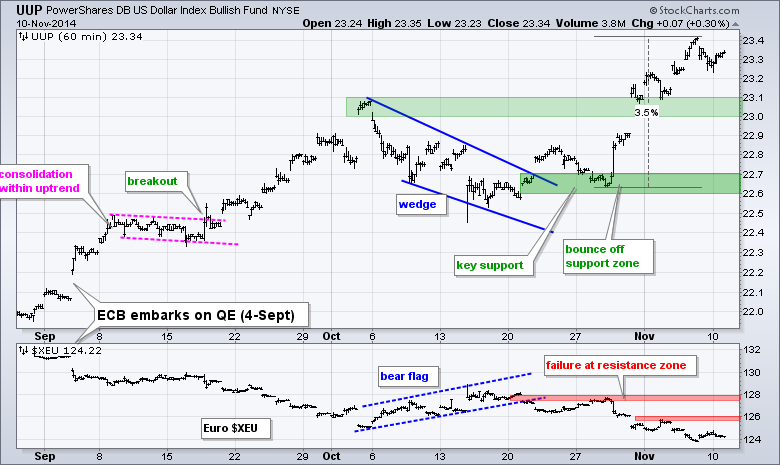
- UUP is a bit overbought, but in a clear uptrend.
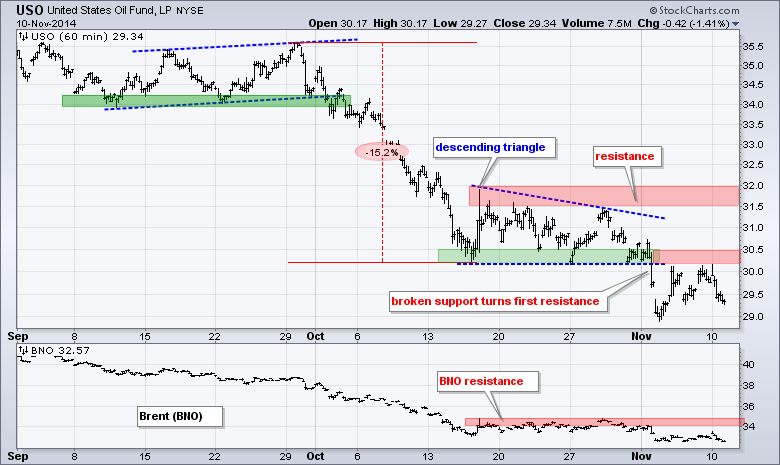
- USO is running into resistance from broken support.
- GLD gave back most of its gains and remains bearish overall.
There is no change with the risk on-off chart. The XLY:XLP ratio broke down and is the only indicator that is negative for stocks. Comcast (CMCSA) weighed on the consumer discretionary sector with a 4% decline on Monday. Priceline (PCLN) weighed last week with a gap and 8+ percent decline. I am, however, positive on retailers and housing. The Retail SPDR (XRT) hit a new high on Friday and the Home Construction iShares (ITB) broke out over the last few days. Retail is a big part of the consumer discretionary sector and a new high in XRT bodes well.
SPY is up some 12% from the mid October low and all six gaps held. The ETF hit a new high on Monday so I extended the Raff Regression Channel. I am marking key support in the 198-200 area. The Raff Regression Channel, last week's low and a buffer mark support here.
**************************************************************
QQQ edged higher on Monday and almost broke pennant resistance. With a new high on Monday, I extended the Raff Regression Channel and raised key support to the 100-101 area. The pennant lows, gap zone and lower trend line mark support here.
**************************************************************
IWM consolidated last week with a pennant and broke out on Friday-Monday to signal a continuation of the current uptrend. With a new closing high on Monday, I extended the Raff Regression Channel and raised key support to the 114-115 area.
**************************************************************
No change. Despite a slew of positive economic and labor reports last week, the 20+ YR T-Bond ETF (TLT) held support in the 118 area and closed near the top of its two week range. I was rather surprised at the resilience and will be watching the small triangle for a directional signal. The early November lows mark support at 118 and the highs mark resistance at 120.
**************************************************************
No change. The US Dollar ETF (UUP) bottomed in mid October and surged over 3% the last seven days. The ETF may be short-term overbought, but the overall trend is clearly up. Broken resistance marks first support in the 23-23.1 area. Key support remains in the 22.6-22.7 area. First resistance for the Euro Index ($XEU) is set at 126 and key resistance at 128.
**************************************************************
No change. The USO Oil Fund (USO) broke support early last week and bounced back to broken support, which turns first resistance. While a move back above the support break would be positive, I would not turn bullish because this is a minor resistance level and the bigger downtrend still dominates. A break above 32 would be deemed short-term bullish and argue for a retracement of the October-November decline.
**************************************************************
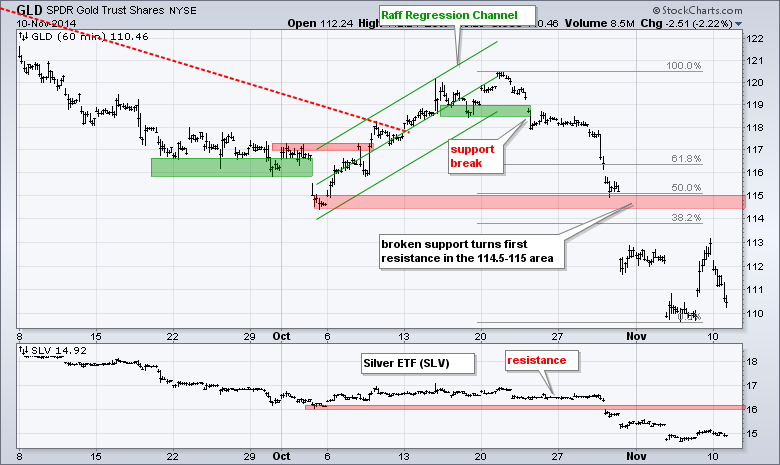
The Gold SPDR (GLD) gave back most of its surge with a sharp decline below 111. This is the challenge when picking a bottom in a strong downtrend. The downtrend will pull trump at some point. The bounce to 113 was considered a counter trend move and it failed miserably. Notice how GLD started the day with selling pressure, continued lower and ended near the low of the day. I will leave first resistance in the 115 area.
***************************************************************
Key Reports and Events (all times Eastern):
Wed - Nov 12 - 07:00 - MBA Mortgage Index
Thu - Nov 13 - 08:30 - Initial Jobless Claims
Thu - Nov 13 - 10:00 - JOLTS Report
Thu - Nov 13 - 10:30 - NatGas Inventories
Thu - Nov 13 - 11:00 - Crude Oil Inventories
Fri - Nov 14 - 08:30 - Retail Sales
Fri - Nov 14 - 09:55 - Michigan Sentiment
Charts of Interest are on Tuesdays and Thursdays.
This commentary and charts-of-interest are designed to stimulate thinking. This analysis is not a recommendation to buy, sell, hold or sell short any security (stock ETF or otherwise). We all need to think for ourselves when it comes to trading our own accounts. First, it is the only way to really learn. Second, we are the only ones responsible for our decisions. Think of these charts as food for further analysis. Before making a trade, it is important to have a plan. Plan the trade and trade the plan. Among other things, this includes setting a trigger level, a target area and a stop-loss level. It is also important to plan for three possible price movements: advance, decline or sideways. Have a plan for all three scenarios BEFORE making the trade. Consider possible holding times. And finally, look at overall market conditions and sector/industry performance.


