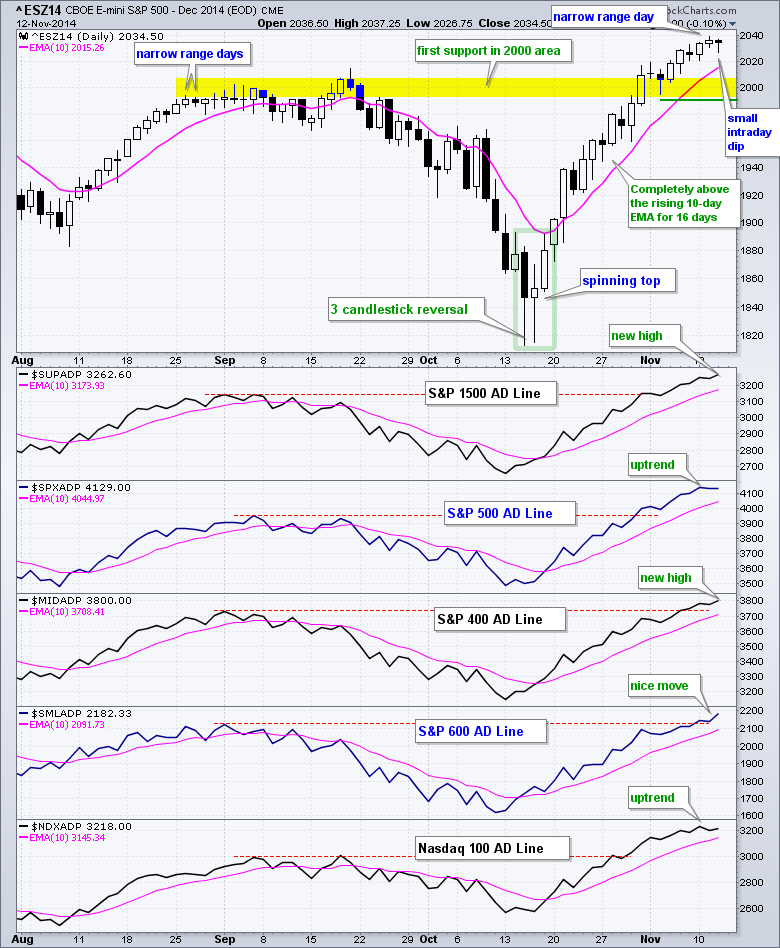
It was another lackluster day, but there were some notable pockets of strength. Small-caps perked up as the Russell 2000 iShares (+.45%) and S&P SmallCap iShares (+.68%) led the major index ETFs. The gains may be incremental, but they were gains and they were the leaders. The SmallCap Consumer Discretionary ETF (PSCD) led the small-cap sectors with a 1.22% gain. The Retail SPDR (1.86%) and the Regional Bank SPDR (1.51%) contributed to small-cap strength with nice gains. On the weak side, utilities and energy came under selling pressure. Energy stocks were hit with further weakness in oil as crude fell another 1%. Even though the SPY has stalled the last three days, IWM and QQQ continued to edge higher and carry the bullish torch. Small-caps are starting to outperform and this is positive overall. The chart below shows the December E-mini S&P 500 (^ESZ14) following up with narrow range day with a dip to 2027 intraday and a close above 2035. This was not much of a dip and yet buyers came in and pushed prices right back up. Key support remains at 1990.
**This chart analysis is for educational purposes only, and should not
be construed as a recommendation to buy, sell or sell-short said securities**
Short-term Overview (13-November-2014):
- To follow me on Twitter: @arthurhill
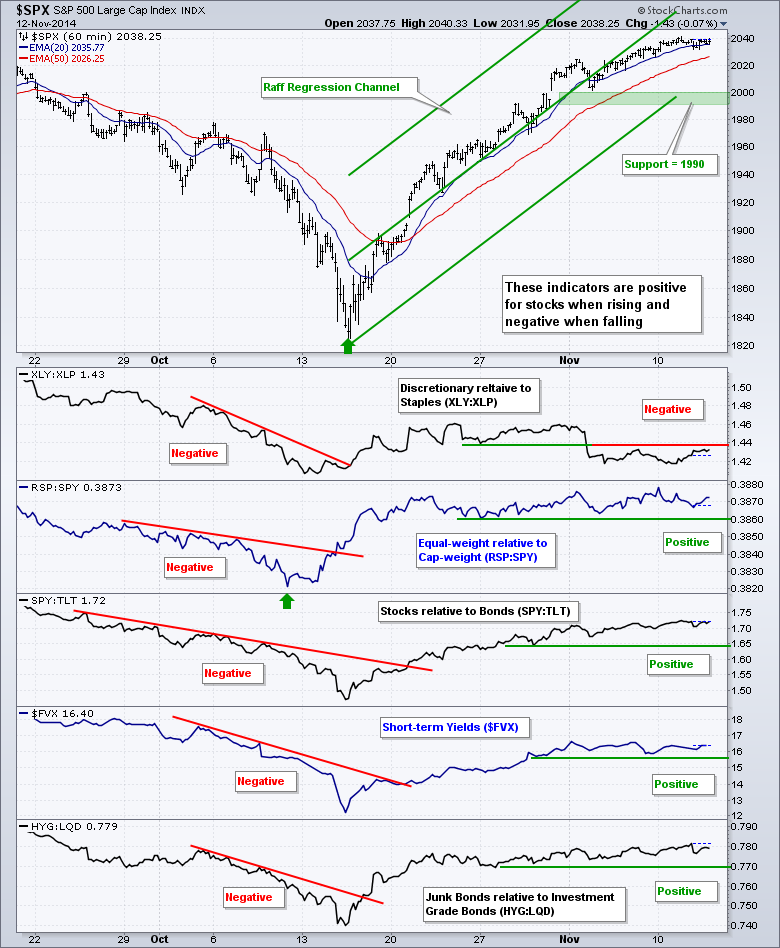
- Four of five risk indicators remain positive for stocks.
- All five AD Lines are in short-term uptrends and three hit new highs for the move.
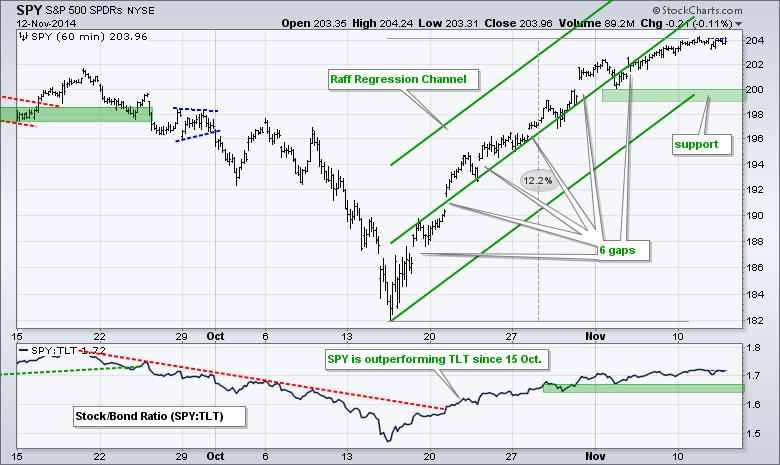
- SPY continued its stall within an uptrend and key support remains at 199.
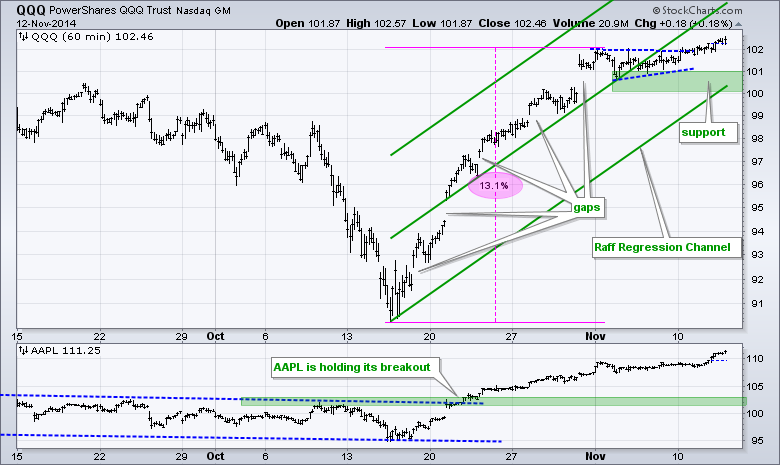
- QQQ broke pennant resistance on Tuesday and support remains at 100.
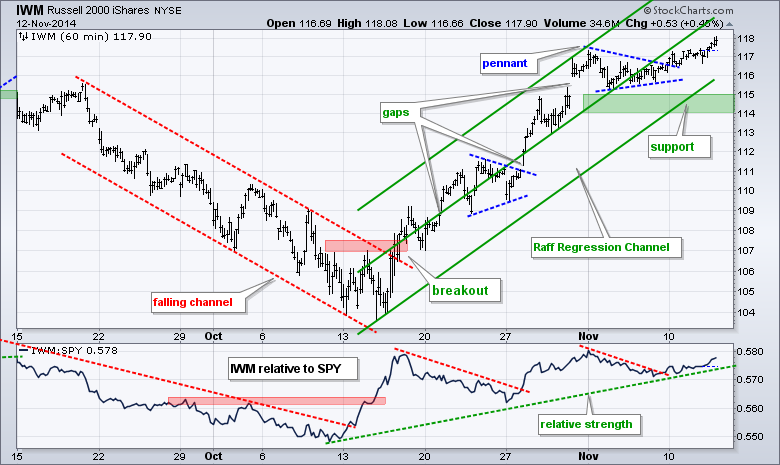
- IWM broke pennant resistance on Friday and support remains at 114.
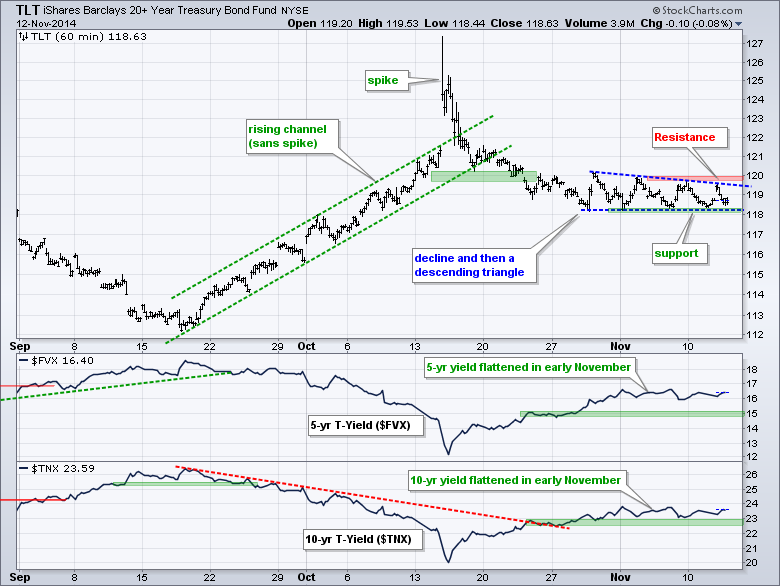
- TLT has a descending triangle working with support at 118.
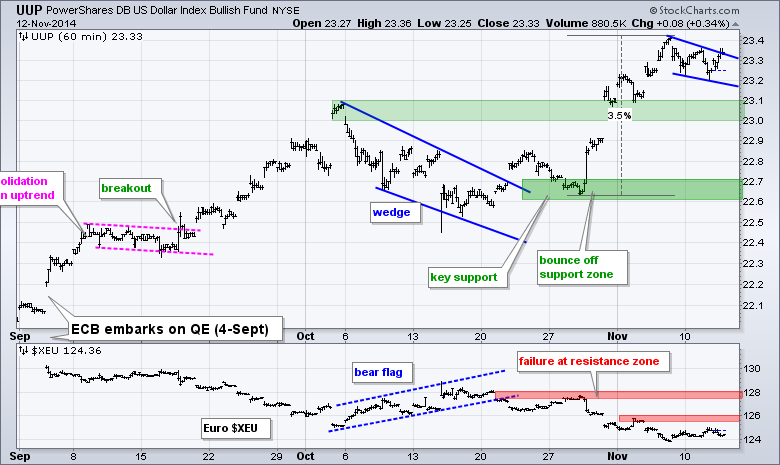
- UUP formed a bull flag with a small pullback and supports remain unchanged.
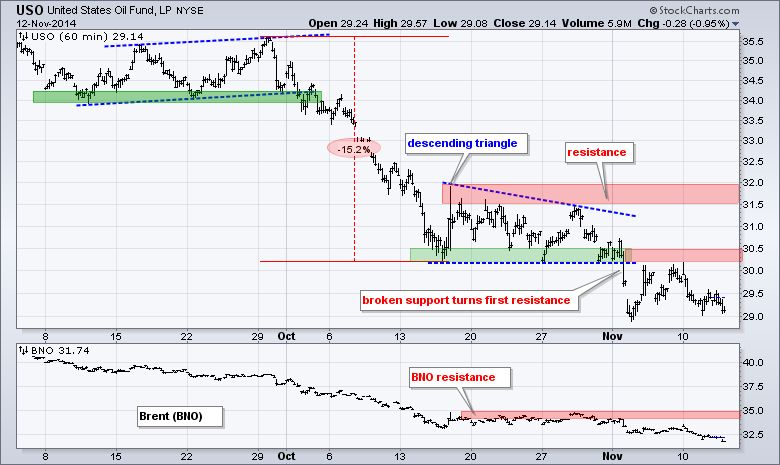
- USO failed at broken support twice and moved to its early November low.
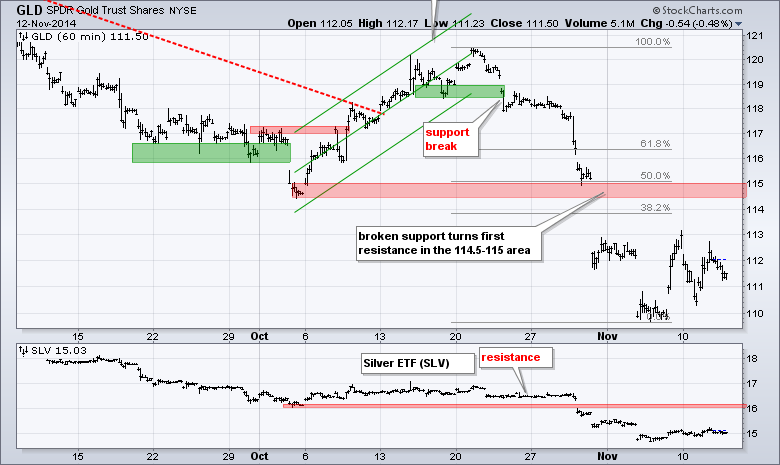
- GLD is turning volatile, but remains within an overall downtrend.
The XLY:XLP ratio broke down last week and then moved sideways the last five days. There was not much follow through to this break down and a move back above the support break would be positive for this risk indicator. Strength in the Retail SPDR and Home Construction iShares bodes well for the consumer discretionary sector. The other four risk indicators remain positive for the stock market. I am a bit concerned that the 5-year Treasury Yield ($FVX) did not continue higher this month and will be watching Treasuries closely in the coming days.
No change. SPY stalled in the 204 area, but remains in an uptrend and I raised key support to the 199-200 area. The Raff Regression Channel, early November low and a buffer mark support here.
**************************************************************
No change. QQQ moved to a new high and broke the pennant trend line. The Raff Regression Channel, pennant lows and a buffer mark key support in the 100-101 area.
**************************************************************
No change. IWM consolidated last week with a pennant and broke out on Friday-Monday to signal a continuation of the current uptrend. With a new closing high on Monday, I extended the Raff Regression Channel and raised key support to the 114-115 area.
**************************************************************
The 20+ YR T-Bond ETF (TLT) moved down to support and I am now considering this pattern a descending triangle. TLT fell sharply from 125 to 119 and then stalled for three weeks. The lower highs and equal lows suggest a descending triangle, which is a bearish continuation pattern. A break below 118 would signal a continuation lower and target a move to the 116 area. A move lower in TLT would imply a move higher in yields, which would be bullish for stocks (except utilities, perhaps).
**************************************************************
The US Dollar ETF (UUP) pulled back over the last four days and formed a falling flag/wedge. With the bigger trend up, a break above wedge resistance would signal a continuation higher. I am going to leave first support in the 23-23.1 area and key support in the 22.6-22.7 area.
**************************************************************
The USO Oil Fund (USO) broke support from a descending triangle, broken support turned into resistance and resistance held. USO failed twice near broken support and is now trading near its early November low. The US Brent Oil ETF (BNO) moved to a new low. I will leave first resistance at 30.5 and key resistance at 32.
**************************************************************
No change. Let the swings begin. The Gold SPDR (GLD) surged almost 3% on Friday, plunged over 2% on Monday and advanced 1.43% on Tuesday. There may be some support in the 110 area and the ETF is still quite oversold, but the bigger trend is down and this is the dominant force. I will leave first resistance in the 115 area.
***************************************************************
Key Reports and Events (all times Eastern):
Thu - Nov 13 - 08:30 - Initial Jobless Claims
Thu - Nov 13 - 10:00 - JOLTS Report
Thu - Nov 13 - 10:30 - NatGas Inventories
Thu - Nov 13 - 11:00 - Crude Oil Inventories
Fri - Nov 14 - 08:30 - Retail Sales
Fri - Nov 14 - 09:55 - Michigan Sentiment
Charts of Interest are on Tuesdays and Thursdays.
This commentary and charts-of-interest are designed to stimulate thinking. This analysis is not a recommendation to buy, sell, hold or sell short any security (stock ETF or otherwise). We all need to think for ourselves when it comes to trading our own accounts. First, it is the only way to really learn. Second, we are the only ones responsible for our decisions. Think of these charts as food for further analysis. Before making a trade, it is important to have a plan. Plan the trade and trade the plan. Among other things, this includes setting a trigger level, a target area and a stop-loss level. It is also important to plan for three possible price movements: advance, decline or sideways. Have a plan for all three scenarios BEFORE making the trade. Consider possible holding times. And finally, look at overall market conditions and sector/industry performance.


