Stocks continued to take baby steps higher with the S&P 500 and Dow Industrials closing at all time (closing) highs. Even though the Russell 2000 and S&P Small-Cap 600 remain below their prior highs, they are less than 4% from these highs and both formed bullish engulfing patterns on Thursday. Stocks opened weak, immediately bottomed and moved higher the rest of the day. The S&P Small-Cap 600 and Russell 2000 closed near the high of the day. Even though the stock market is acting like a seesaw lately, it is hard to argue with this kind of price action. The seesaw affect happens when one index group gains 1+ percent and the other just gains a fraction. We are seeing this in the sectors as well as the rotations keep producing incremental gains in the broader market. An advance is still an advance and we must judge the broader market ($SPX) in aggregate.
**This chart analysis is for educational purposes only, and should not
be construed as a recommendation to buy, sell or sell-short said securities**
Short-term Overview (Friday, 21-November-2014):
- The incremental gains continue and evidence still tilts bullish.
- All five AD Lines are back above their rising 10-day EMAs.
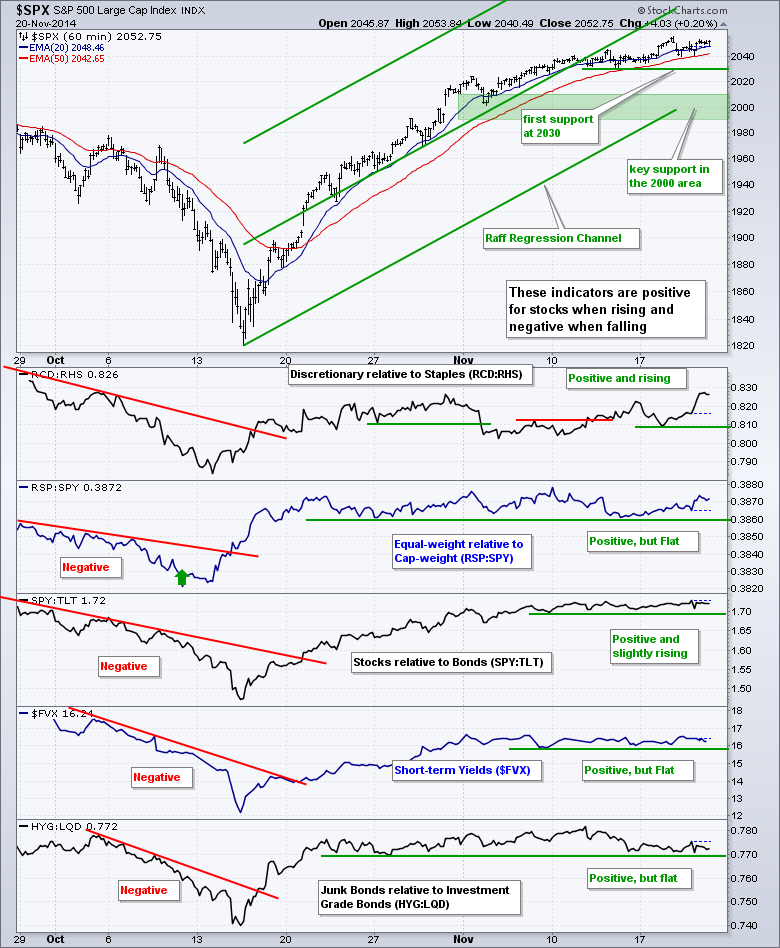
- The five risk on-off indicators are positive, but three have been flat for weeks.
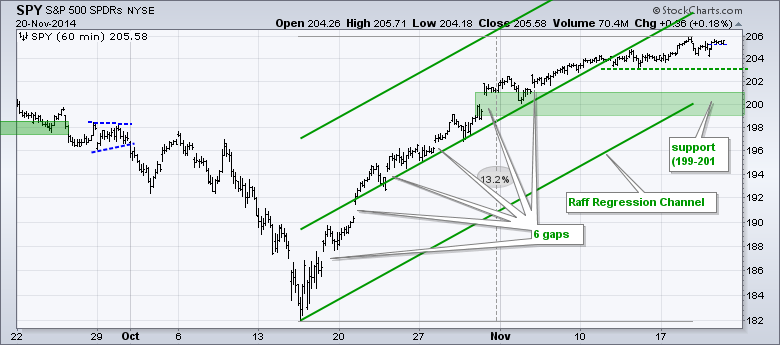
- SPY hit a new high on Tuesday and key support remains in the 200 area.
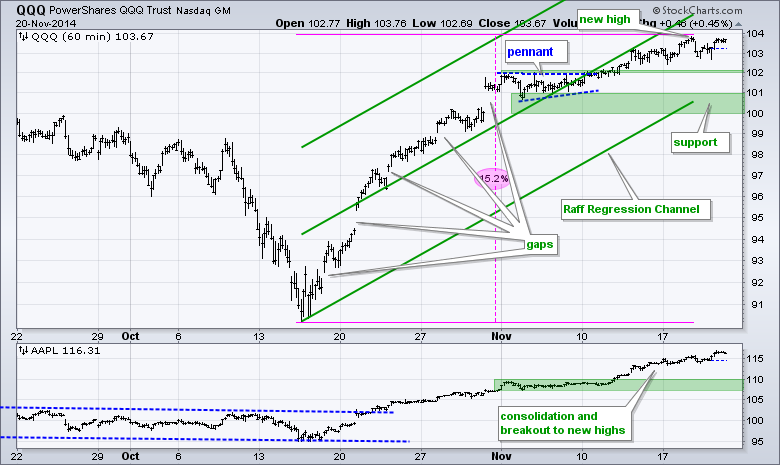
- QQQ hit a new high on Tuesday and key support remains in the 100 area.
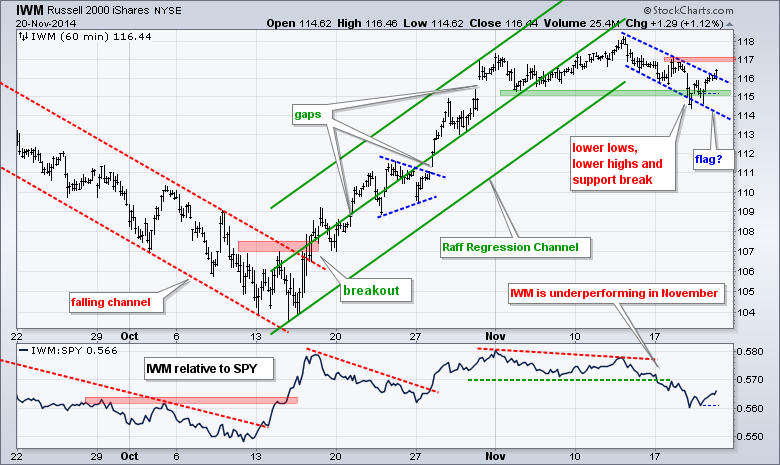
- IWM rebounded and led for a day with a flag break, but remains a laggard overall.
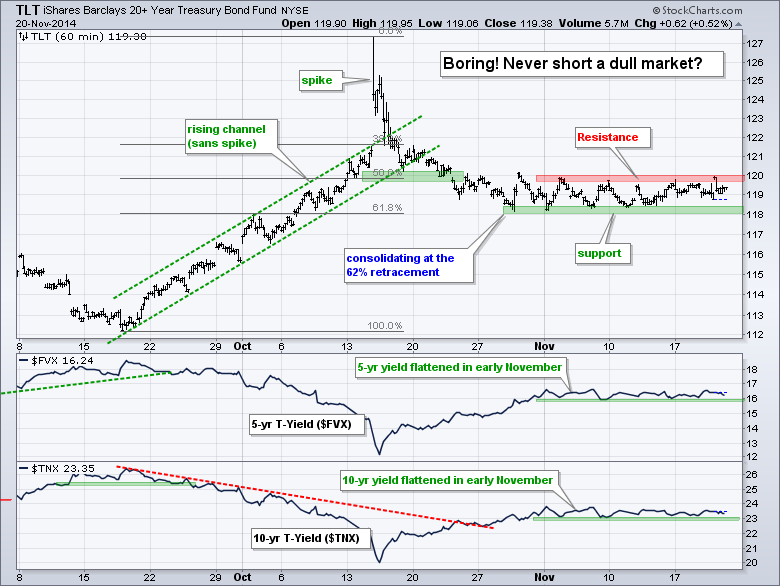
- TLT continues to bore with a tight consolidation (118-120).
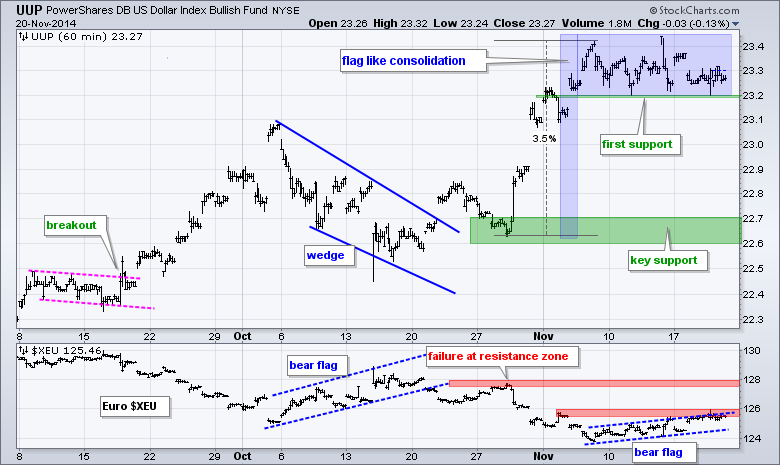
- UUP formed a flat, and bullish, flag over the past week.
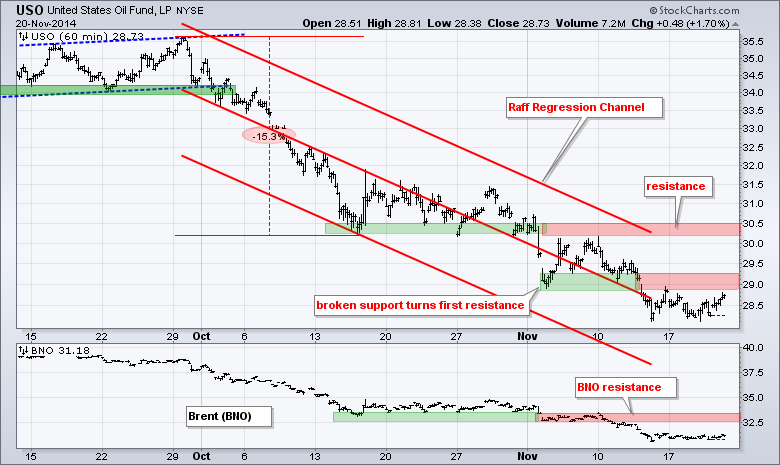
- USO remains in a downtrend with resistance at 30.5.
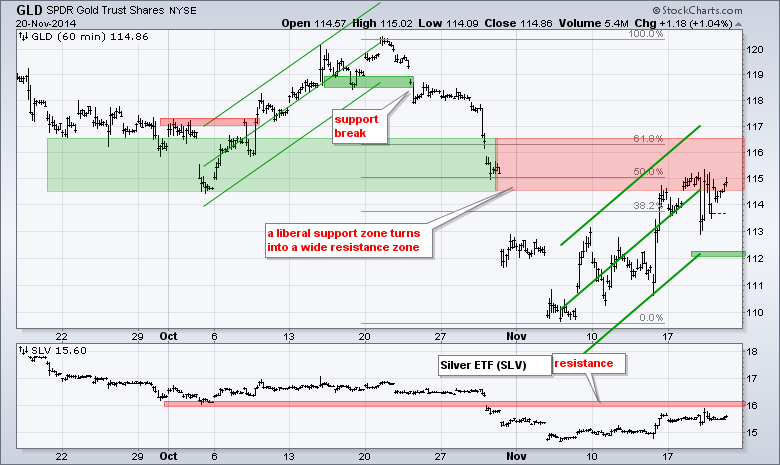
- GLD remains in a volatile upswing that is now defined with a Raff Regression Channel.
The December E-mini S&P 500 (^ESZ14) dipped below 2040 again - and again rallied to close near the high of the day. The lower line of the 3-day price channel and Monday's low mark first support at 2020. Even though a break here would be negative, I would not get too bearish because the bigger trend is up, the yearend is here and support at 2000 is possible.
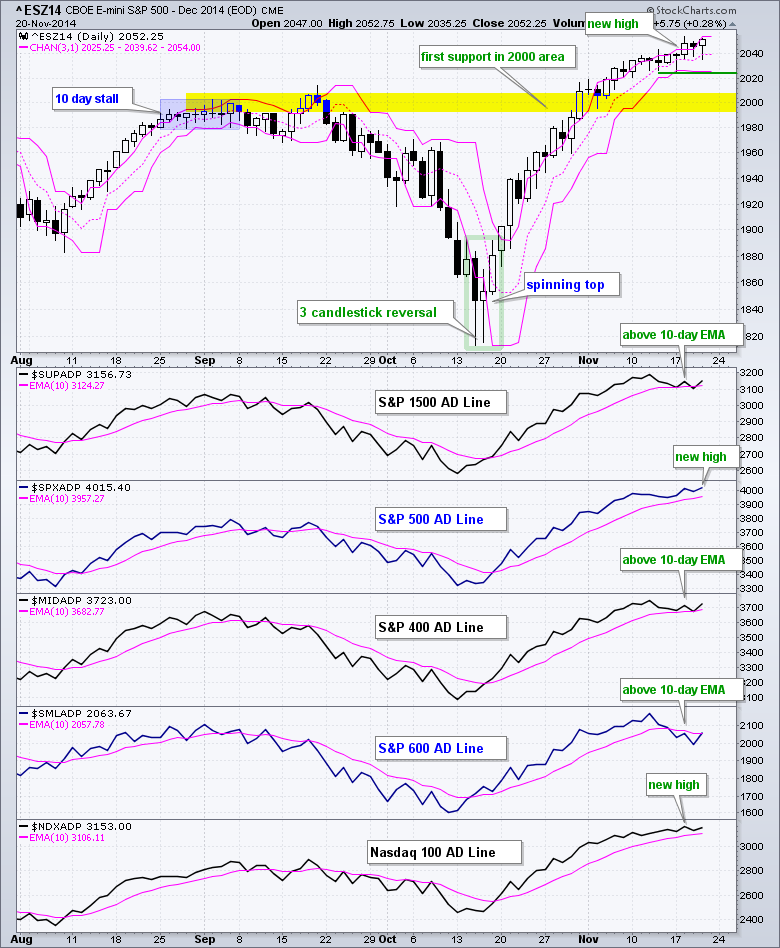
The S&P 500 AD Line hit a new high and remains the strongest of the five AD Lines, thanks to the industrials, finance and consumer discretionary sectors. The Nasdaq 100 AD Line remains above its 10-day EMA and the other three AD Lines are back above their 10-day EMAs. On balance, the AD Lines are bullish and support a short-term uptrend in stocks. The S&P Small-Cap 600 AD Line is still the weakest of the group, but got a big lift on Thursday and I am looking for follow through.
There is no change for the risk on-off indicators as all five remain positive for stocks. The consumer discretionary sector has been outperforming the consumer staples sector for two weeks. Stocks have been outperforming bonds for five weeks. The other three indicators are flat and uninspiring, but have yet to break down and turn negative for stocks.
No change. SPY moved to a new high on Tuesday and I extended the Raff Regression Channel to match this high. There is still no real change on the chart. Last week's lows mark first support at 203. The late October gap, early November low and Raff Regression Channel mark key support in the 200 area.
**************************************************************
No change. QQQ moved to another new high on Tuesday and remains one of the strongest major index ETFs. I extended the Raff Regression Channel to this high and will leave key support at 100 for now. Broken resistance and this week's low mark first support at 102. This level could be used for stop-losses, but I would not consider short positions.
**************************************************************
IWM dipped below support in the 115 area twice and rebounded with a move above 116 on Thursday. The move broke the upper trend line of the falling flag and provides the first sign of a trend reversal. As tempting as small-caps are, they are still lagging and not the preferred vehicle right now.
**************************************************************
No change. Given the positive economic reports in early November and better-than-expected retail sales report last week, I would have expected the 20+ YR T-Bond ETF (TLT) to break support and move lower. It did not and this could foreshadow an upside breakout. TLT spiked above 127 in mid October and then fell back to the 118 area in late October. The ETF is at an interesting juncture because it retraced 62% of the prior decline, which is normal for a correction within an uptrend. A break above 120 would break consolidation resistance and signal an end to the consolidation. Key support is set at 118.
**************************************************************
No change. The US Dollar ETF (UUP) surged from 22.5 to 23.4 and then consolidated. This looks like a flat flag and a break above the highs would signal a continuation higher. The flag lows mark first support in the 23.2 area. I will leave key support in the 22.6-22.7 area for now. The indicator window shows the Euro Index ($XEU) forming a bear flag over the past week.
**************************************************************
No change. The USO Oil Fund (USO) got a big bounce on Friday, but still closed down for the week and remains in a clear downtrend. Broken support in the 30.5 area turns resistance and the upper line of the Raff Regression Channel extends to this area as well. USO broke down again last week and broken support in the 29-29.3 area turns first resistance.
**************************************************************
There is clearly an upswing present since early November, but defining this upswing is a challenge so a broad in the Raff Regression Channel. It does a pretty good job of defining direction and accounting for volatility, which we are seeing now. The lower trend line ends around 112 and I will mark support here. The long-term trend for gold is still down and GLD has a big resistance zone in the 115-116.50 area.
***************************************************************
Key Reports and Events (all times Eastern):
Fri - Nov 21 - 08:30 - TGIF!
Charts of Interest are on Tuesdays and Thursdays.
This commentary and charts-of-interest are designed to stimulate thinking. This analysis is not a recommendation to buy, sell, hold or sell short any security (stock ETF or otherwise). We all need to think for ourselves when it comes to trading our own accounts. First, it is the only way to really learn. Second, we are the only ones responsible for our decisions. Think of these charts as food for further analysis. Before making a trade, it is important to have a plan. Plan the trade and trade the plan. Among other things, this includes setting a trigger level, a target area and a stop-loss level. It is also important to plan for three possible price movements: advance, decline or sideways. Have a plan for all three scenarios BEFORE making the trade. Consider possible holding times. And finally, look at overall market conditions and sector/industry performance.


