Stocks surged out of the gate on Friday, but fell back in the afternoon and closed off their highs. The action was mostly positive, but small-caps again underperformed as the S&P SmallCap iShares (IJR) closed fractionally lower. Large-caps still rule the rally. All sectors were up with industrials, materials and energy leading the way. Materials were helped by strength in mining and steel stocks, which were boosted by a surprise rate cut from the Chinese central bank. Japan is levering up with quantitative easing, Europe is threatening QE action and China is easing again. Like it or not, global money continues to flow and this is positive for stocks, especially large-caps. Programming note: I am taking off the rest of this week for time with family and friends. I wish everyone a happy and safe Thanksgiving week, and I will be back again next Monday, December 1st.
**This chart analysis is for educational purposes only, and should not
be construed as a recommendation to buy, sell or sell-short said securities**
Short-term Overview (Monday, 24-November-2014):
- The incremental gains continue, the evidence remains bullish and large-caps rule.
- Three AD Lines hit new highs and the other two are above their 10-day EMAs.
- The five risk on-off indicators are positive, but three have been flat for weeks.
- SPY hit a new high on Friday and key support remains in the 200 area.
- QQQ hit a new high on Friday and key support remains in the 100 area.
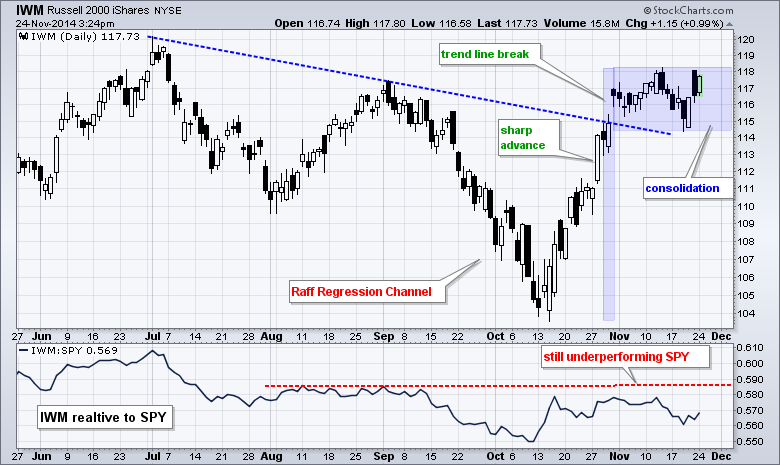
- IWM reversed its downswing with a gap and breakout at 116.
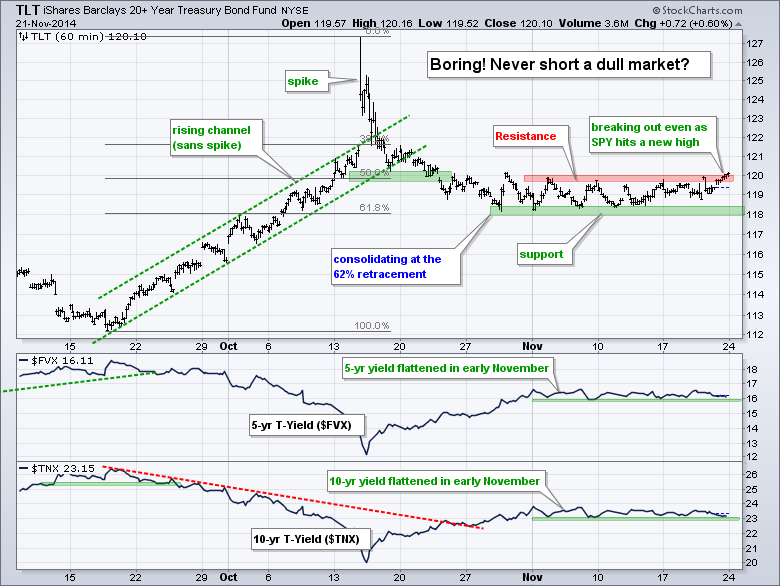
- TLT is making a breakout bid with a close above 120.
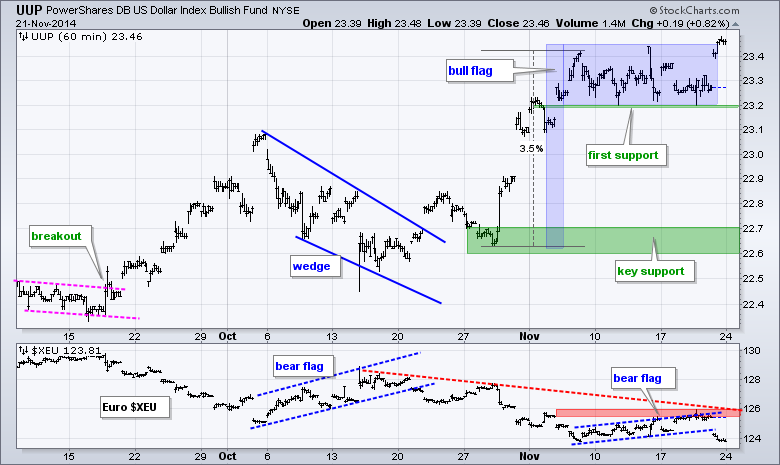
- UUP is making another breakout bid with a move above flag resistance.
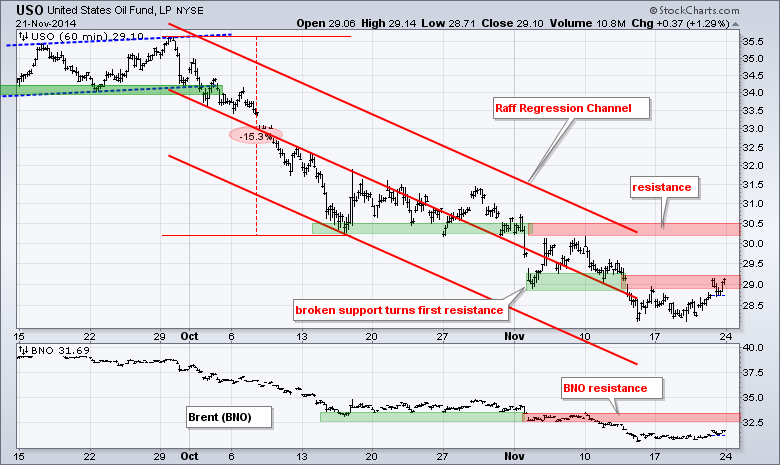
- USO remains in a downtrend with resistance at 30.5.
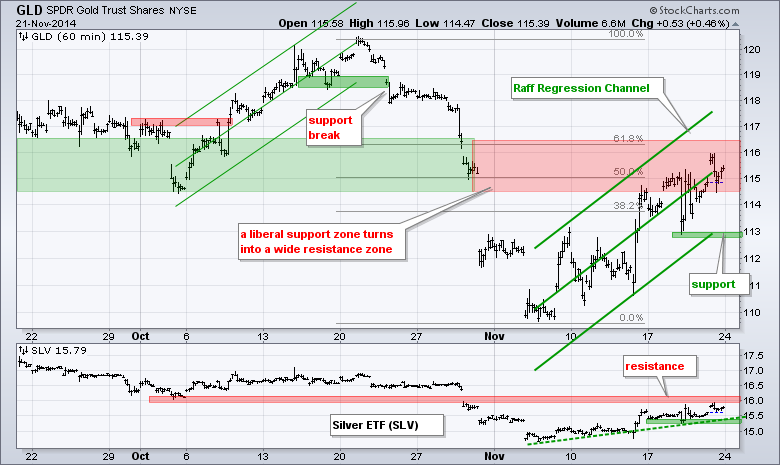
- GLD remains in a volatile upswing with support in the 113 area.
The December E-mini S&P 500 (^ESZ14) surged above 2070 in early trading and then faded with a close at 2061. Even though this candlestick sports a relatively long upper shadow, the trend is up and one day does not a trend change make. Last week's lows marking first support in the 2020-2030 area.
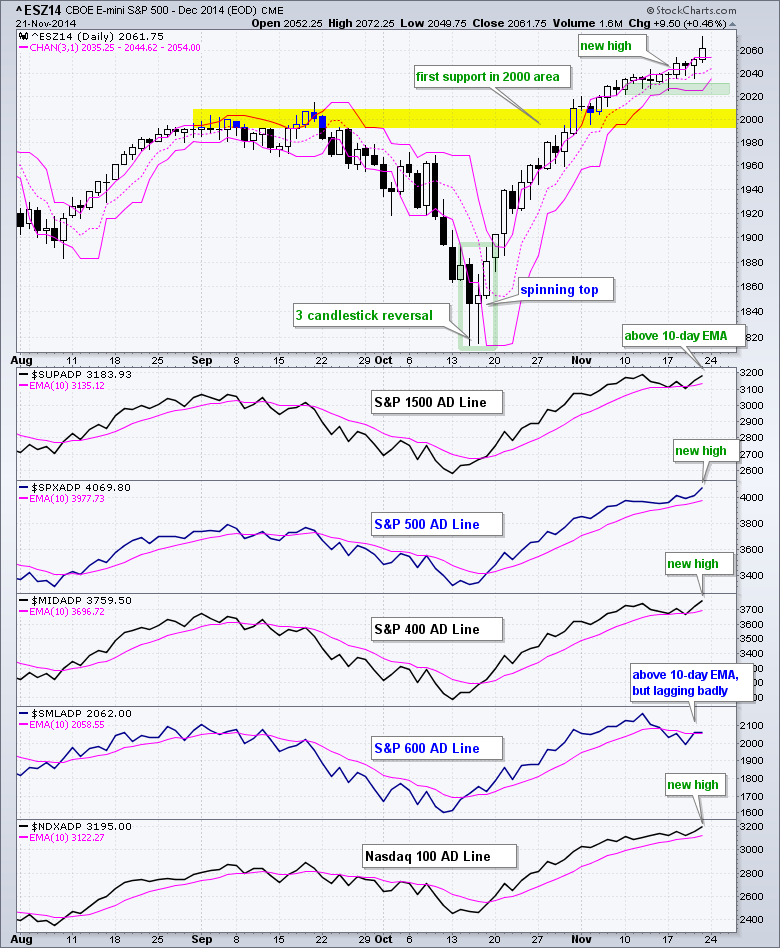
The AD Lines for the S&P 500, Nasdaq 100 and S&P MidCap 400 hit new highs on Friday. Large-caps continued to dominate the advance, but it is nice to see mid-caps join in with a new high. The AD Lines for the S&P 1500 and S&P Small-Cap 600 are both above their 10-day EMAs, but the small-cap AD Line continues to lag, which is a negative for small-caps, not large-caps.
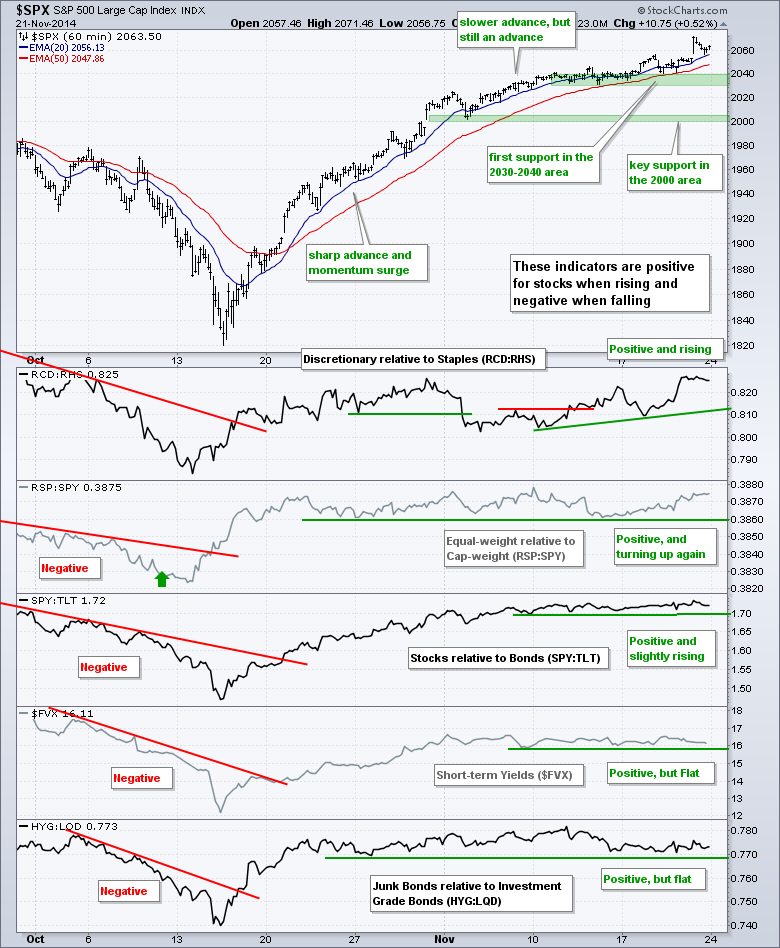
There is no change for the risk on-off indicators as all five remain positive for stocks. The consumer discretionary sector has been outperforming the consumer staples sector for two weeks. Stocks have been outperforming bonds for 5+ weeks. The other three indicators are flat and uninspiring, but have yet to break down and turn negative for stocks.
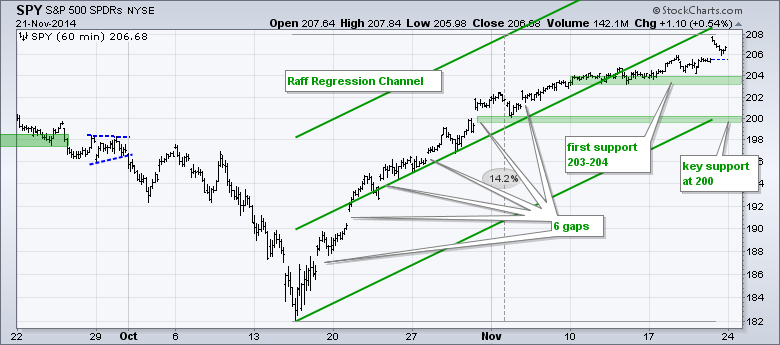
SPY gapped above 207 and then fell back below 207, but still closed with a gain and I extended the Raff Regression Channel yet again. The channel is a bit wide, but I think it captures the short-term uptrend quite well. Note that there was a surge in the second half of October and then a slow-steady advance in November. Upside momentum is not as strong as in October, but upside momentum is clearly in charge because there are simply no signs of selling pressure. The lows of the last two weeks mark first support in the 204 area. I will leave key support in the 200 area.
**************************************************************
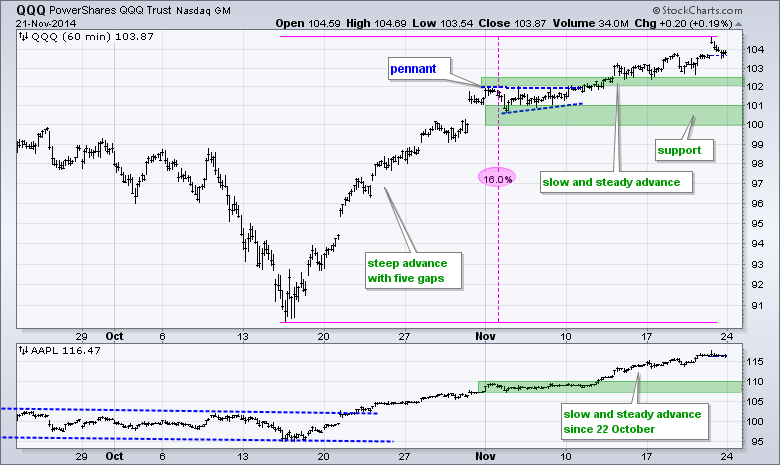
QQQ looks pretty much like SPY: a surge in the second half of October and then a steady advance in November. Broken resistance from the early November pennant and last week's lows mark first support in the 102-102.5 area. I will leave key support in the 100-101 area for now.
**************************************************************
IWM is a bit of a mess with a widening range this month. Even though some chartists would call this a bearish broadening formation, my bias is still up for the stock market overall and that include small-caps. However, large-caps show relative strength and are preferred over small-caps right now. With a gap-surge above 116, IWM reversed the downswing of the prior six days and then tested the breakout with an afternoon dip. 116 needs to hold to keep this breakout alive.
**************************************************************
Treasuries are making a breakout bid as the 20+ YR T-Bond ETF (TLT) broke above 120 on Friday. It is a bit strange to see stocks AND Treasury bonds moving higher, but it is what it is and the breakout is bullish until proven otherwise. Failure to hold and a break below 118 would be bearish. Perhaps Japanese QE is finding its way into the US bond market as well.
**************************************************************
The US Dollar ETF (UUP) is making a breakout bid with a move above flag resistance. The Dollar may be overbought and sentiment may seem overly bullish, but there is no denying the trend and price action is bullish. The flag lows mark first support in the 23.2 area. The indicator window shows the Euro Index ($XEU) breaking flag support with a sharp decline on Friday.
**************************************************************
The USO Oil Fund (USO) firmed last week and even got a bounce the last two days, but remains in a downtrend overall. Broken support turns first resistance in the 29-29.3 area. The Raff Regression Channel and early November highs combine to mark key resistance in the 30.5 area.
**************************************************************
The Gold SPDR (GLD) remains in an upswing that is defined by a wide Raff Regression Channel. Volatility increased this month so I am using rather wide ranges for resistance as well. Broken support and the 50-62% retracement zone turn resistance in the 115-116 area. The bigger trend is clearly down so I think this is just another counter trend bounce or bear market rally. The Raff Regression Channel and last week's low mark key support in the 113 area.
***************************************************************
Key Reports and Events (all times Eastern):
Tue - Nov 25 - 08:30 - GDP
Tue - Nov 25 - 09:00 - Case-Shiller 20-city Index
Tue - Nov 25 - 09:00 - FHFA Housing Price Index
Tue - Nov 25 - 10:00 - Consumer Confidence
Wed - Nov 26 - 07:00 - MBA Mortgage Index
Wed - Nov 26 - 08:30 - Initial Jobless Claims
Wed - Nov 26 - 08:30 - Durable Goods Orders
Wed - Nov 26 - 08:30 - Personal Income & Personal Spending
Wed - Nov 26 - 08:30 - PCE Prices
Wed - Nov 26 - 09:45 - Chicago PMI
Wed - Nov 26 - 09:55 - Michigan Sentiment
Wed - Nov 26 - 10:00 - New Home Sales
Wed - Nov 26 - 10:00 - Pending Home Sales
Wed - Nov 26 - 10:30 - Crude Oil Inventories
Wed - Nov 26 - 12:00 - Natural Gas Inventories
Charts of Interest are on Tuesdays and Thursdays.
This commentary and charts-of-interest are designed to stimulate thinking. This analysis is not a recommendation to buy, sell, hold or sell short any security (stock ETF or otherwise). We all need to think for ourselves when it comes to trading our own accounts. First, it is the only way to really learn. Second, we are the only ones responsible for our decisions. Think of these charts as food for further analysis. Before making a trade, it is important to have a plan. Plan the trade and trade the plan. Among other things, this includes setting a trigger level, a target area and a stop-loss level. It is also important to plan for three possible price movements: advance, decline or sideways. Have a plan for all three scenarios BEFORE making the trade. Consider possible holding times. And finally, look at overall market conditions and sector/industry performance.


