Small-caps weighed on the stock market again as IWM fell over 1%. Techs were also a bit weak with QQQ falling a half percent and SPY held up the best with a fractional loss. Despite a mixed and overbought stock market, there were some positive takeaways on Wednesday. The Retail SPDR (XRT) hit another new high and the consumer discretionary sector was the second strongest sector. Note that eight of the nine small-cap sectors were down and the only gainer was the SmallCap Consumer Discretionary ETF (PSCD). A little relative strength in the consumer discretionary sector is welcome news ahead of the holiday season. We also saw a small uptick in short-term Treasury yields, which signals some selling in this safe haven. A continued rise in yields and decline in Treasury bonds would be positive for stocks.
**This chart analysis is for educational purposes only, and should not
be construed as a recommendation to buy, sell or sell-short said securities**
Short-term Overview (Thursday, 20-November-2014):
- The bulk of the evidence remains bullish for stocks, but a little less bullish.
- Three of the five AD Lines are in short-term downtrends ($SML, $MID, $SPSUPX).
- The five risk on-off indicators are positive for stocks, but three have been flat for weeks.
- SPY hit a new high on Tuesday and key support remains in the 200 area.
- QQQ hit a new high on Tuesday and key support remains in the 100 area.
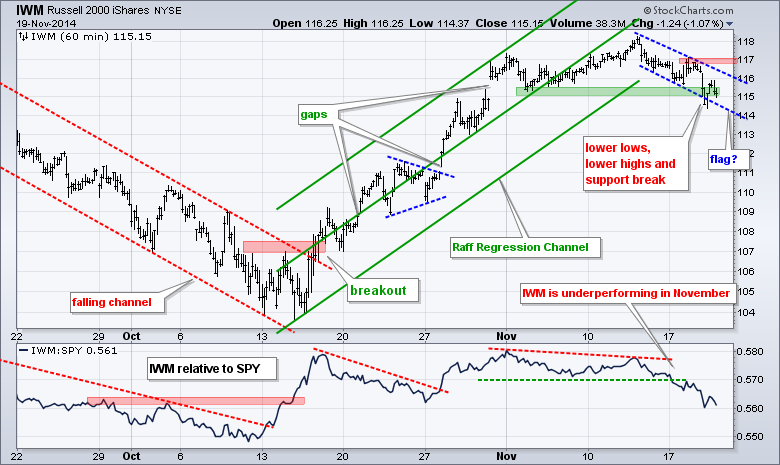
- IMW broke support and is in a short-term downtrend with resistance at 117.20.
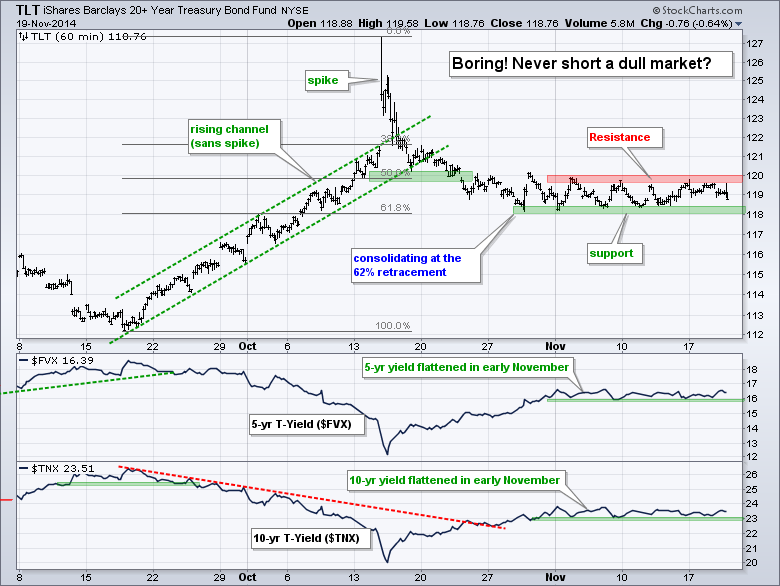
- TLT continues to bore with a tight consolidation (118-120).
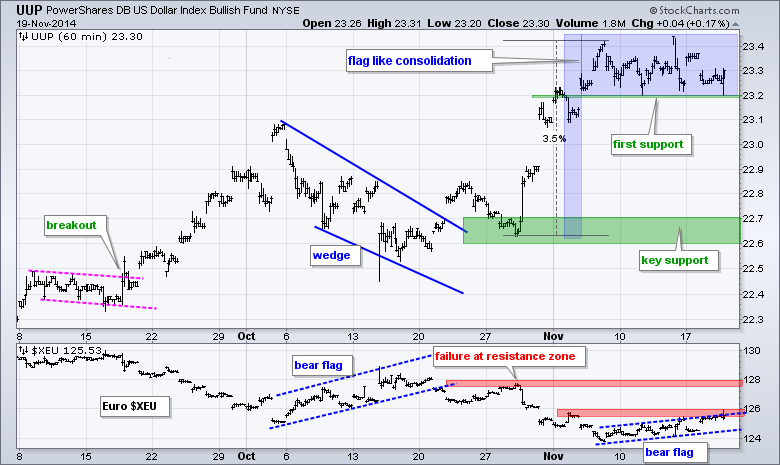
- UUP formed a flat, and bullish, flag over the past week.
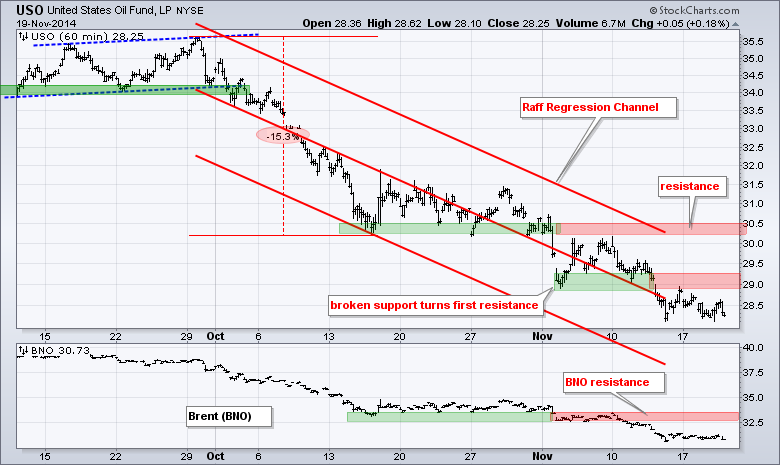
- USO remains in a downtrend with resistance at 30.5.
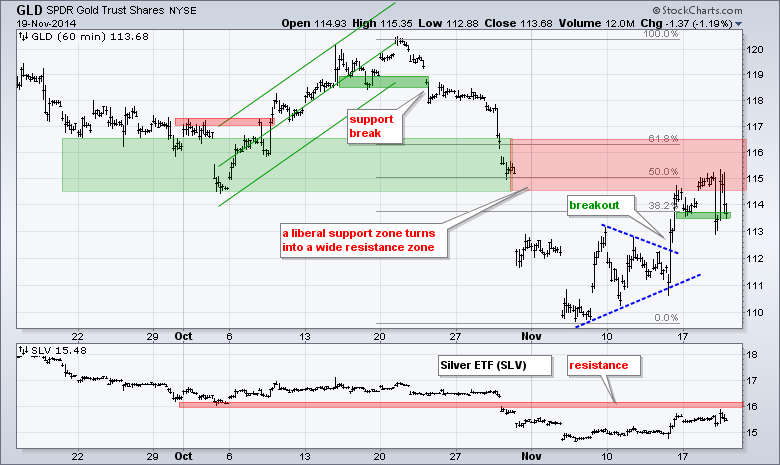
- GLD turned volatile near a big resistance zone and I consider it untradeable.
The December E-mini S&P 500 (^ESZ14) dipped in the morning, bounced and closed with a fractional loss. The uptrend is slowing, but it has yet to reverse. The pink lines show a 3-day price channel with the upper line marking the three day high and the lower line marking the three day low, which has held since October 20th. A close below 2025 would break first support and would argue for a pullback of some sorts. Again, I am not sure how far it will extend because the bigger trend is up I think the S&P 500 will find support in the 2000 area.
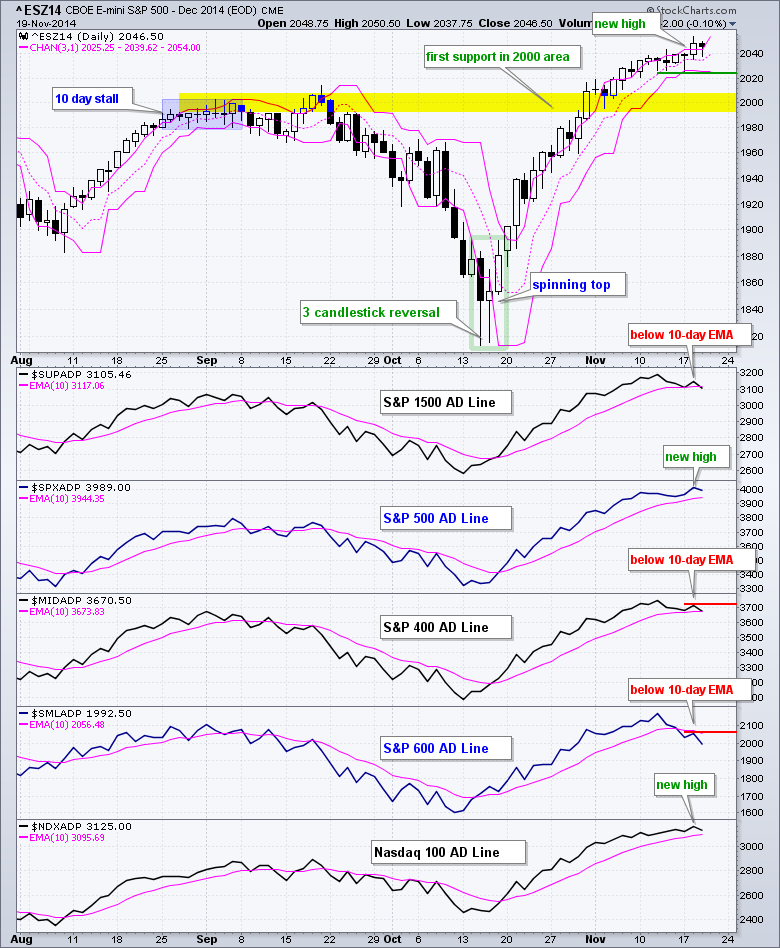
The S&P 500 and Nasdaq 100 AD Lines hit new highs on Tuesday and remain in clear uptrends. These two large-cap dominated indices are the strongest by far. The S&P Small-Cap 600 AD Line turned down last week and broke its 10-day EMA, while the S&P MidCap 400 AD Line edged below its 10-day EMA yesterday. Weakness in these two finally weighed enough on the S&P 1500 AD Line and it broke its 10-day EMA. Thus, on balance, the AD Lines are bearish by a three to two margin.
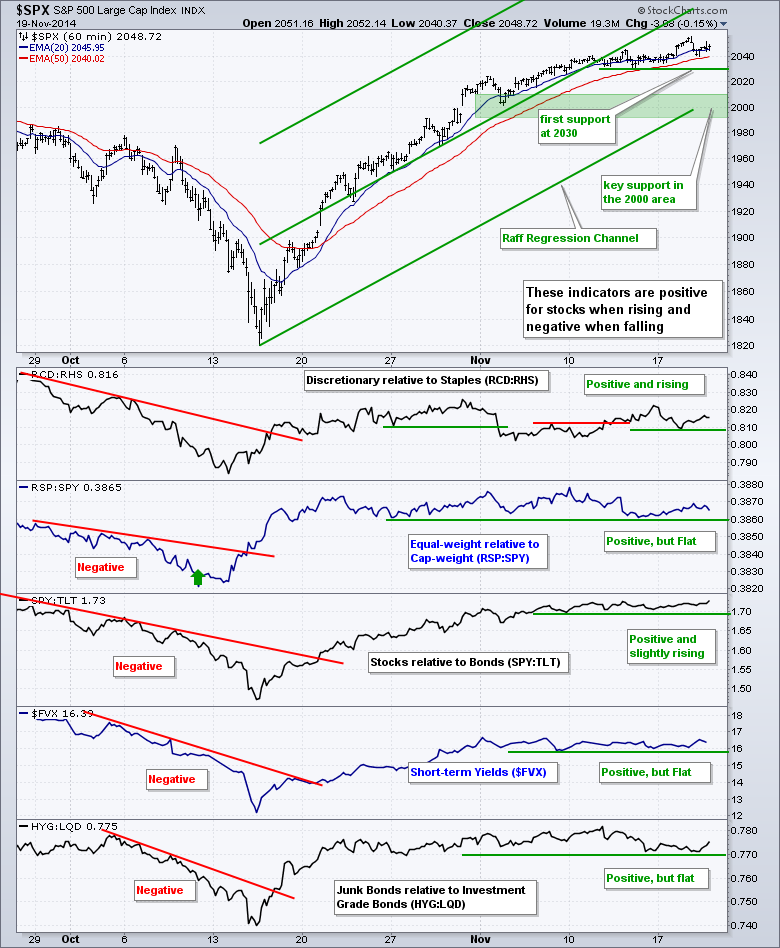
There is no change for the risk on-off indicators as all five remain positive for stocks. The consumer discretionary sector has been outperforming the consumer staples sector for two weeks. Stocks have been outperforming bonds for five weeks. The other three indicators are flat and uninspiring, but have yet to break down and turn negative for stocks.
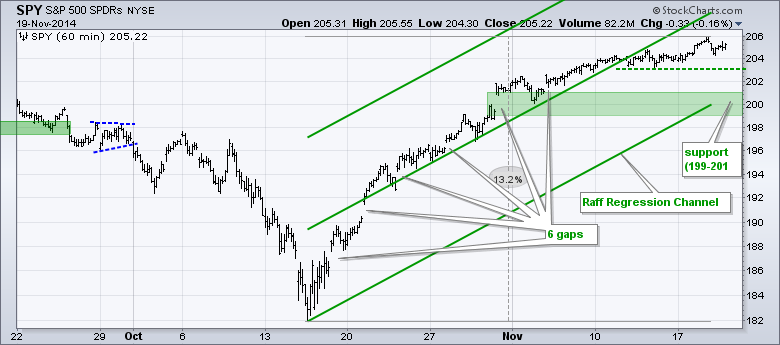
No change. SPY moved to a new high and I extended the Raff Regression Channel to match this high. There is still no real change on the chart. Last week's lows mark first support at 203. The late October gap, early November low and Raff Regression Channel mark key support in the 200 area.
**************************************************************
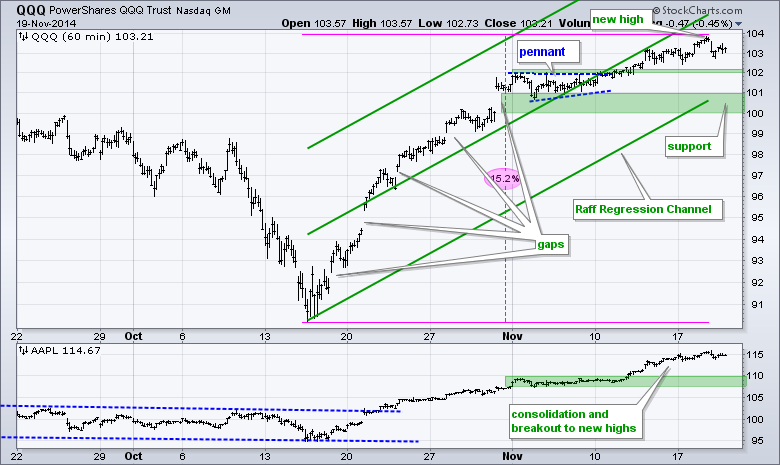
No change. QQQ moved to another new high and remains one of the strongest major index ETFs. I extended the Raff Regression Channel to this high and will leave key support at 100 for now. Broken resistance and this week's low mark first support at 102. This level could be used for stop-losses, but I would not consider short positions.
**************************************************************
Small-caps remain under pressure. The small-cap AD Line is trending lower, IWM is underperforming SPY and IWM hit a new low for the month. I do not consider this a negative for the broader market because IWM represents less than 8% of the total US stock market. SPY and QQQ are still fine. The six day pattern in IWM looks like a falling flag and this week's highs mark resistance in the 117 area.
**************************************************************
No change. Given the positive economic reports in early November and better-than-expected retail sales report last week, I would have expected the 20+ YR T-Bond ETF (TLT) to break support and move lower. It did not and this could foreshadow an upside breakout. TLT spiked above 127 in mid October and then fell back to the 118 area in late October. The ETF is at an interesting juncture because it retraced 62% of the prior decline, which is normal for a correction within an uptrend. A break above 120 would break consolidation resistance and signal an end to the consolidation. Key support is set at 118.
**************************************************************
No change. The US Dollar ETF (UUP) surged from 22.5 to 23.4 and then consolidated. This looks like a flat flag and a break above the highs would signal a continuation higher. The flag lows mark first support in the 23.2 area. I will leave key support in the 22.6-22.7 area for now. The indicator window shows the Euro Index ($XEU) forming a bear flag over the past week.
**************************************************************
No change. The USO Oil Fund (USO) got a big bounce on Friday, but still closed down for the week and remains in a clear downtrend. Broken support in the 30.5 area turns resistance and the upper line of the Raff Regression Channel extends to this area as well. USO broke down again last week and broken support in the 29-29.3 area turns first resistance.
**************************************************************
What a mess. The Gold SPDR (GLD) remains volatile and untradeable at the moment - for me at least. The long-term trend is clearly down and the ETF is encountering resistance near the 50% retracement and broken support. Yes, this is a liberal (wide) support zone, but it jibes with the 50-62% retracement. The Dollar remains strong and this is a negative for gold.
***************************************************************
Key Reports and Events (all times Eastern):
Thu - Nov 20 - 08:30 - Initial Claims
Thu - Nov 20 - 08:30 - Consumer Price Index (CPI)
Thu - Nov 20 - 10:00 - Existing Home Sales
Thu - Nov 20 - 10:00 - Philadelphia Fed
Thu - Nov 20 - 10:00 - Leading Economic Indicators
Thu - Nov 20 - 10:30 - Natural Gas Inventories
Charts of Interest are on Tuesdays and Thursdays.
This commentary and charts-of-interest are designed to stimulate thinking. This analysis is not a recommendation to buy, sell, hold or sell short any security (stock ETF or otherwise). We all need to think for ourselves when it comes to trading our own accounts. First, it is the only way to really learn. Second, we are the only ones responsible for our decisions. Think of these charts as food for further analysis. Before making a trade, it is important to have a plan. Plan the trade and trade the plan. Among other things, this includes setting a trigger level, a target area and a stop-loss level. It is also important to plan for three possible price movements: advance, decline or sideways. Have a plan for all three scenarios BEFORE making the trade. Consider possible holding times. And finally, look at overall market conditions and sector/industry performance.


