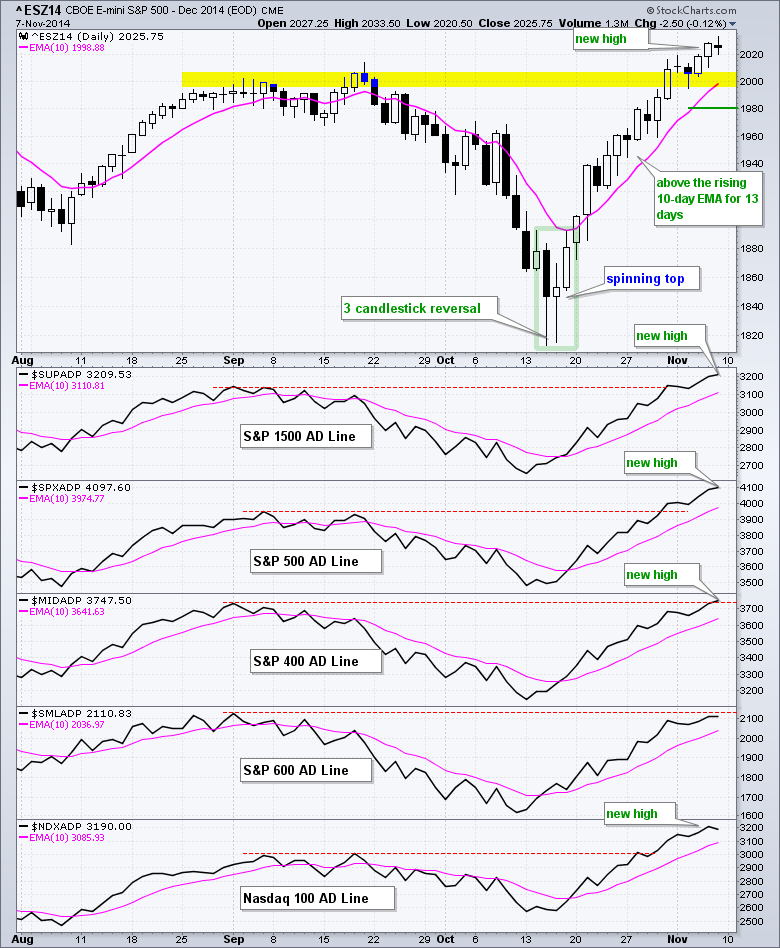
The December E-mini S&P 500 (^ESZ14) hit a new high intraday, but closed slightly lower and formed a doji on the day. These candlesticks signal indecision, which is caused by a standoff between buying and selling pressure. The current upswing is quite amazing because the emini has been above its rising 10-day EMA for 13 days.
I am marking key support in the 1980 area, but I would also look for support in the 2000 area because the first pullback will likely attract buyers. Broken resistance and last week's low mark support here. The indicator windows show four of the five AD Lines hitting new highs last week. The S&P 400 Mid-Cap AD Line ($MIDADP) joined the group with a new high. The S&P SmallCap AD Line ($SMLADP) remains just below its early September high, but is in a clear uptrend.
**This chart analysis is for educational purposes only, and should not
be construed as a recommendation to buy, sell or sell-short said securities**
Short-term Overview (10-November-2014):
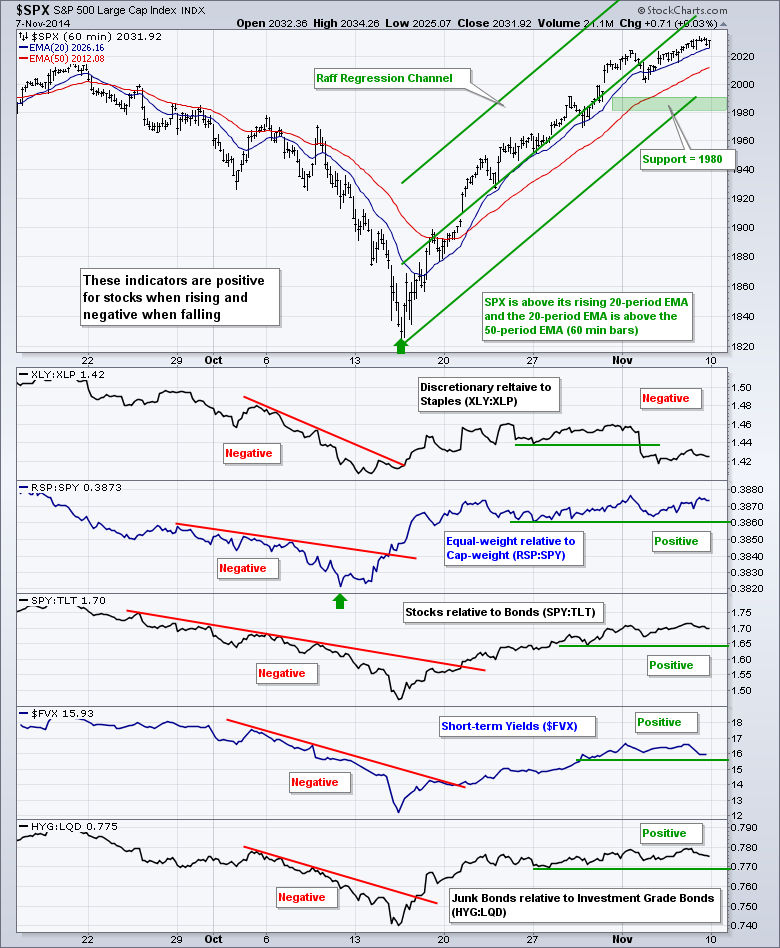
- Four of the five risk indicators remain positive for stocks.
- Breadth is bullish as four of the five AD Lines hit new highs.
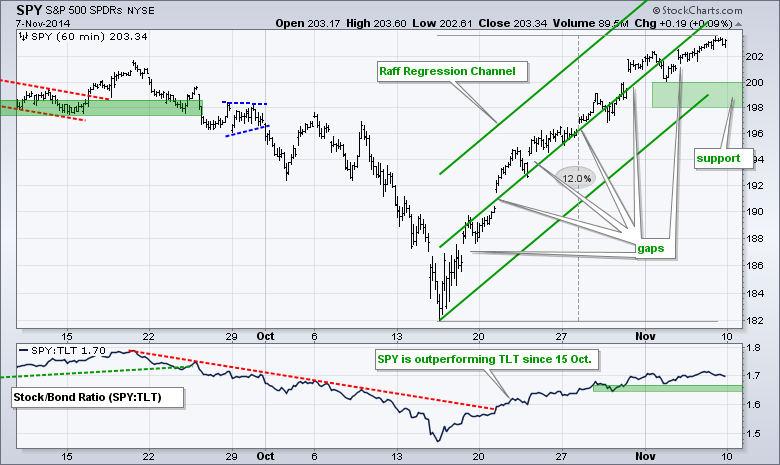
- SPY remains in a clear uptrend with support at 198.
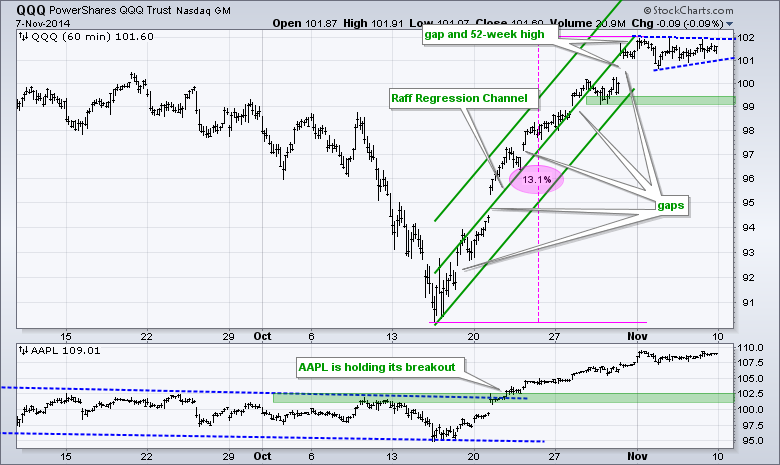
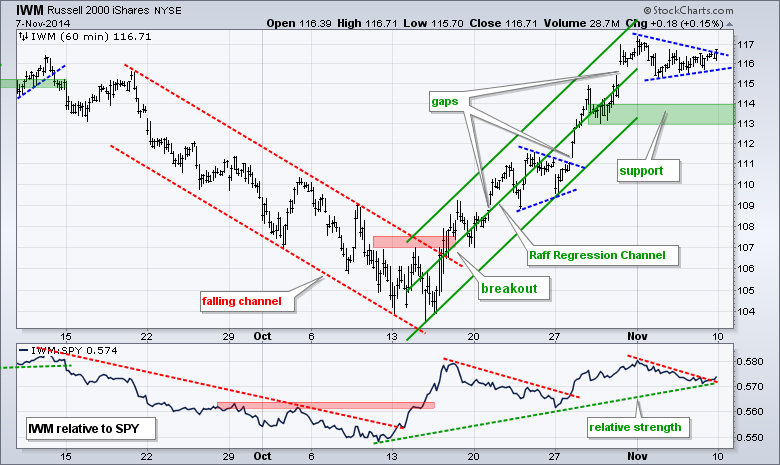
- IWM and QQQ consolidated with pennants and support is unchanged.
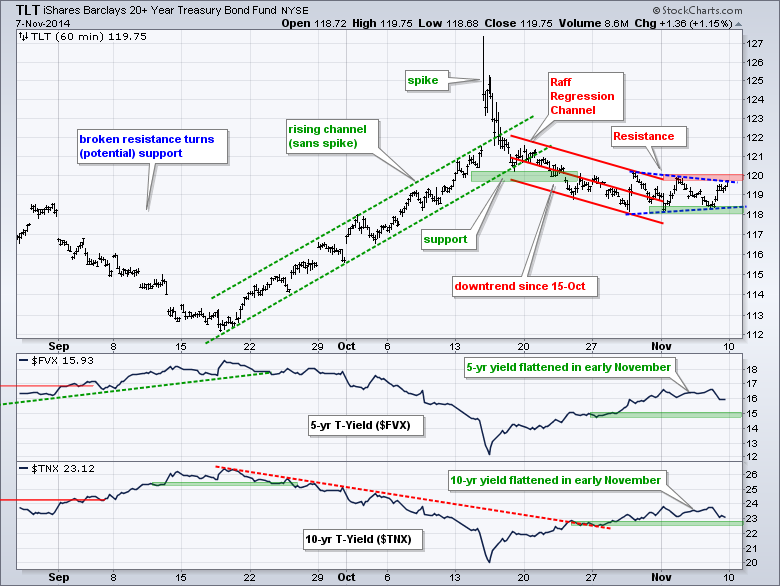
- TLT consolidated with a pennant and the support-resistance tightened.
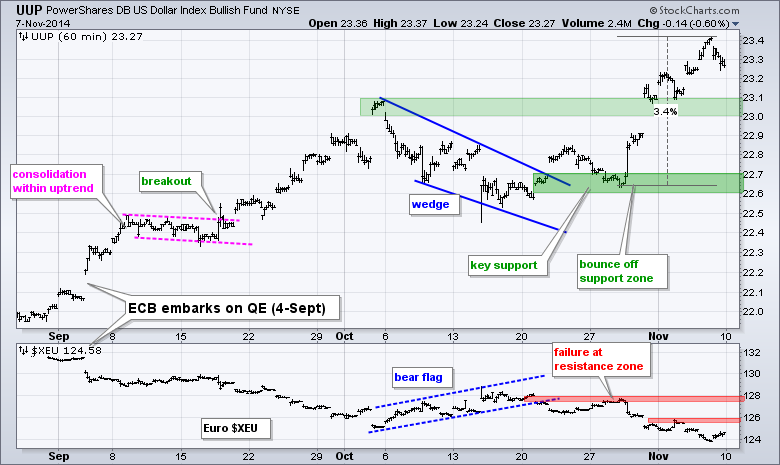
- UUP is a bit overbought, but in a clear uptrend with a new support area.
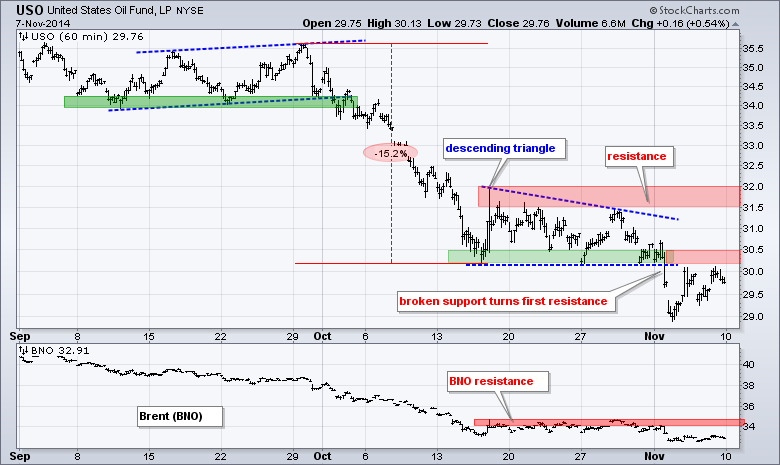
- USO is trying to reclaim last week's support break.
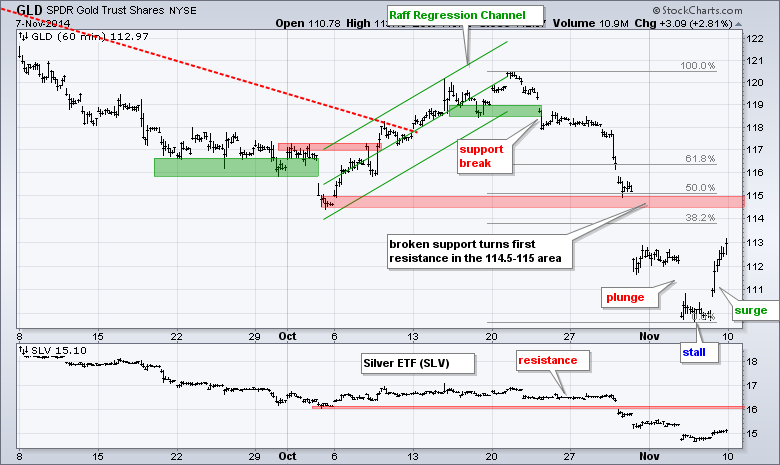
- GLD surged within its downtrend and a key retracement marks resistance.
The risk on-off indicators remain net bullish with one negative and four positive. The XLY:XLP ratio broke down last week as the consumer discretionary sector started underperforming the consumer staples sector. On the positive side, the RSP:SPY ratio remains in an uptrend, stocks are outperforming Treasuries (SPY:TLT ratio), the 5-year Treasury Yield ($FVX) has yet to break down and junk bonds are outperforming investment grade bonds (JNK:LQD ratio).
SPY is now up 12% from the mid October low to the early November high. The ETF may seem overbought, but there are no signs of selling pressure. As noted on the emini chart, I think the 200 area may act as support on any short-term pullback. I am marking key support in the 198-200 area. The Raff Regression Channel, last week's low and a buffer mark support here.
**************************************************************
QQQ simply consolidated last week and formed a pennant. This means the gap above 100.5 held and this gap is bullish as long as it holds. It is tempting to move key support to 100, but I will maintain key support in the 99-99.5 area. The Raff Regression Channel and 29-Oct low mark key support here.
**************************************************************
IWM also consolidated last week and formed a pennant. The ETF closed strong on Friday and moved just above the pennant trend line for an early breakout signal. I could use the pennant lows to mark support at 115, but I think this is too tight and will leave key support in the 113-114 area for now.
**************************************************************
Despite a slew of positive economic and labor reports last week, the 20+ YR T-Bond ETF (TLT) held support in the 118 area and closed near the top of its two week range. I was rather surprised at the resilience and will be watching the small triangle for a directional signal. The early November lows mark support at 118 and the highs mark resistance at 120.
**************************************************************
The US Dollar ETF (UUP) bottomed in mid October and surged over 3% the last seven days. The ETF may be short-term overbought, but the overall trend is clearly up. Broken resistance marks first support in the 23-23.1 area. Key support remains in the 22.6-22.7 area. First resistance for the Euro Index ($XEU) is set at 126 and key resistance at 128.
**************************************************************
The USO Oil Fund (USO) broke support early last week and bounced back to broken support, which turns first resistance. While a move back above the support break would be positive, I would not turn bullish because this is a minor resistance level and the bigger downtrend still dominates. A break above 32 would be deemed short-term bullish and argue for a retracement of the October-November decline.
**************************************************************
Gold got a big oversold bounce as the Gold SPDR (GLD) surged to 113. A short-term bullish reversal has triggered with the plunge below 111, the stall around 110 and surge above 112. Despite a big move, the bigger trend is still down and this is deemed a counter trend move. Broken support and the 50% retracement mark first resistance in the 115 area.
***************************************************************
Key Reports and Events (all times Eastern):
Wed - Nov 12 - 07:00 - MBA Mortgage Index
Thu - Nov 13 - 08:30 - Initial Jobless Claims
Thu - Nov 13 - 10:00 - JOLTS Report
Thu - Nov 13 - 10:30 - NatGas Inventories
Thu - Nov 13 - 11:00 - Crude Oil Inventories
Fri - Nov 14 - 08:30 - Retail Sales
Fri - Nov 14 - 09:55 - Michigan Sentiment
Charts of Interest are on Tuesdays and Thursdays.
This commentary and charts-of-interest are designed to stimulate thinking. This analysis is not a recommendation to buy, sell, hold or sell short any security (stock ETF or otherwise). We all need to think for ourselves when it comes to trading our own accounts. First, it is the only way to really learn. Second, we are the only ones responsible for our decisions. Think of these charts as food for further analysis. Before making a trade, it is important to have a plan. Plan the trade and trade the plan. Among other things, this includes setting a trigger level, a target area and a stop-loss level. It is also important to plan for three possible price movements: advance, decline or sideways. Have a plan for all three scenarios BEFORE making the trade. Consider possible holding times. And finally, look at overall market conditions and sector/industry performance.


