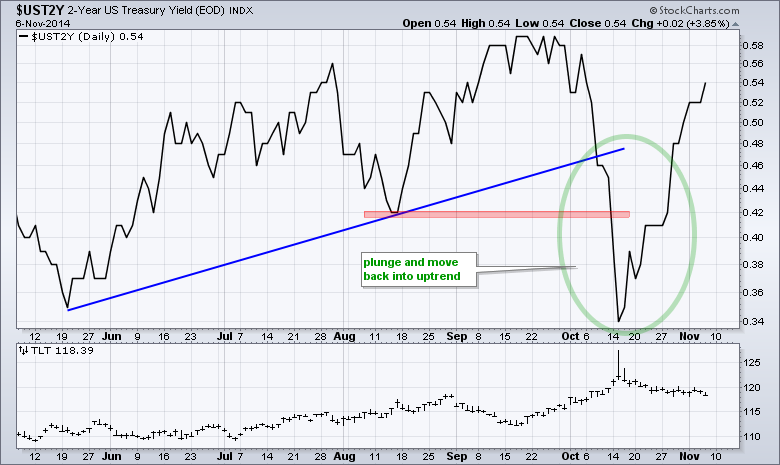
And now for the employment report. This week's economic reports were positive, the ADP Report was above 200K and initial claims continue to fall. The economic cup is clearly half full and this bodes well for today's employment report. Stocks have perhaps already priced in some of this news, but the bond market could have more work to do. The 20+ YR T-Bond ETF (TLT) stalled the last two weeks and a break below the late October low would signal a continuation lower. The 2-year Treasury Yield ($UST2Y) ticked up again on Thursday and remains in a steep short-term uptrend. In fact, this key short-term rate appears to be back in its long-term uptrend because the prior break down was negated. Rising short-term yields are positive for stocks because they support the thesis that the economy and labor market are improving, not deteriorating.
**This chart analysis is for educational purposes only, and should not
be construed as a recommendation to buy, sell or sell-short said securities**
**************************************************************
Short-term Overview (7-November-2014):
- Four of the five risk indicators remain positive for stocks.
- Breadth is bullish as three of the five AD Lines hit new highs.
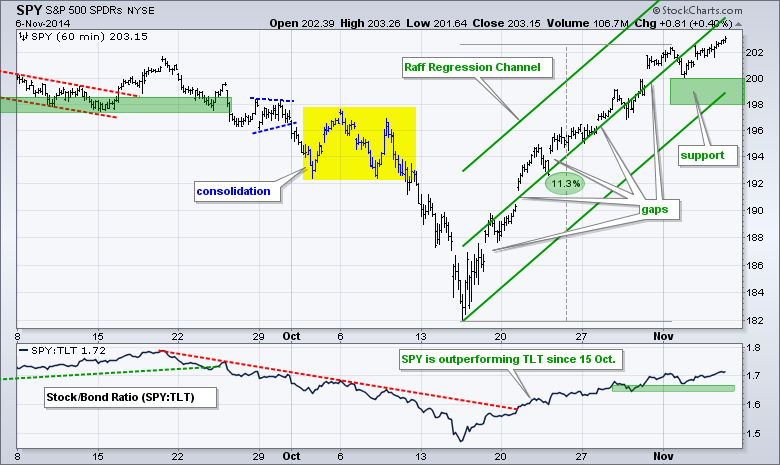
- SPY continues to lead with a new high on Thursday and I raised support.
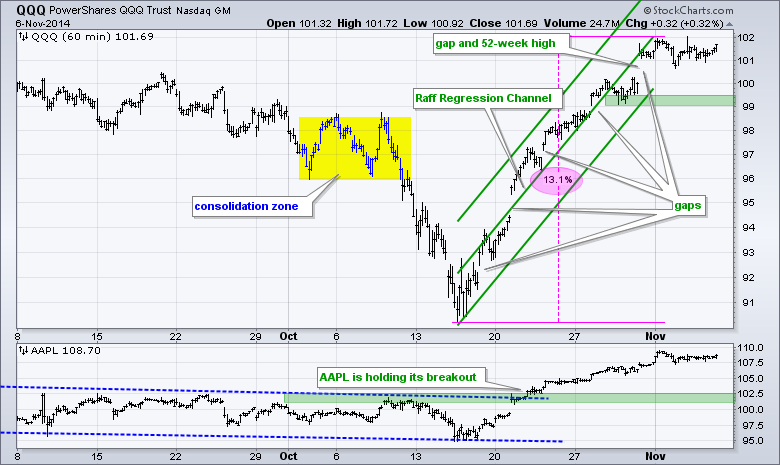
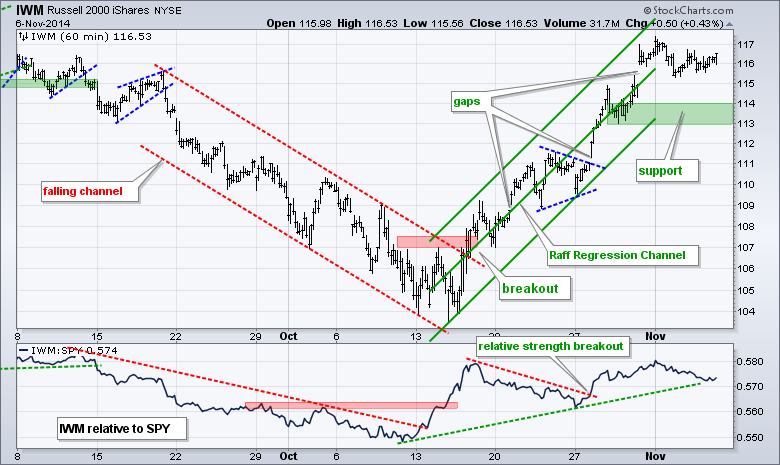
- IWM and QQQ consolidated this week and support remains unchanged.
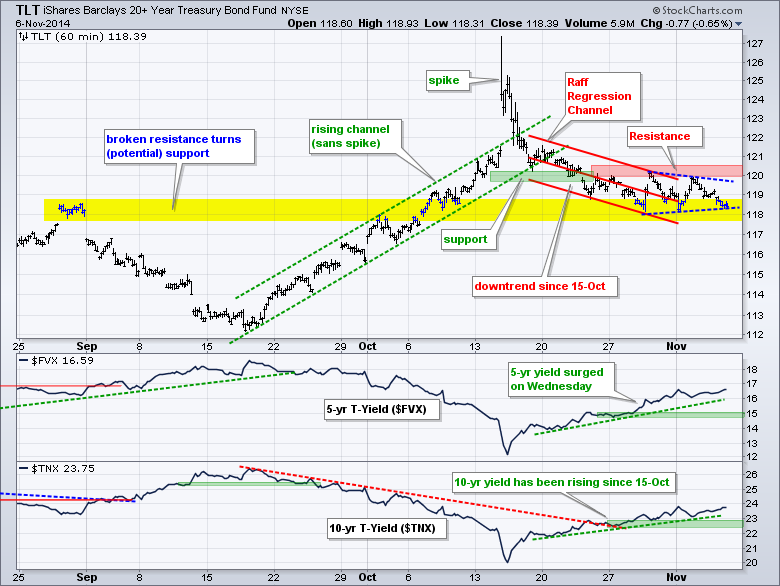
- TLT is in a downtrend since 15-Oct and key resistance remains unchanged.
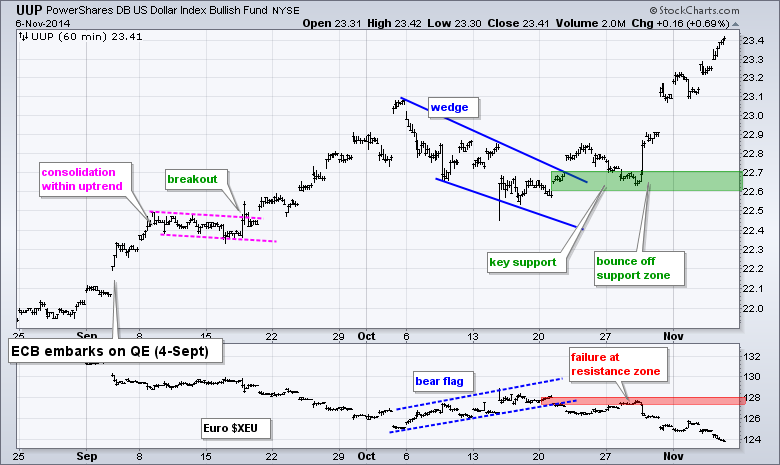
- UUP hit another new high as the Euro hit another new low.
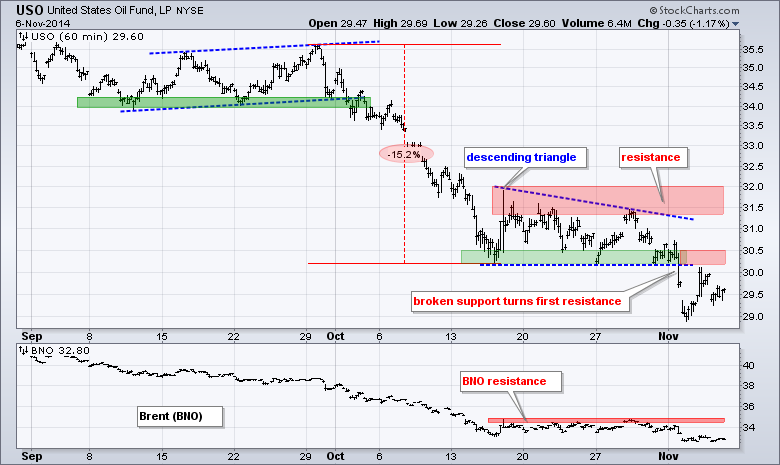
- USO remains in a downtrend and the most recent support break is holding.
- GLD became even more oversold on Wednesday and then consolidated on Thursday.
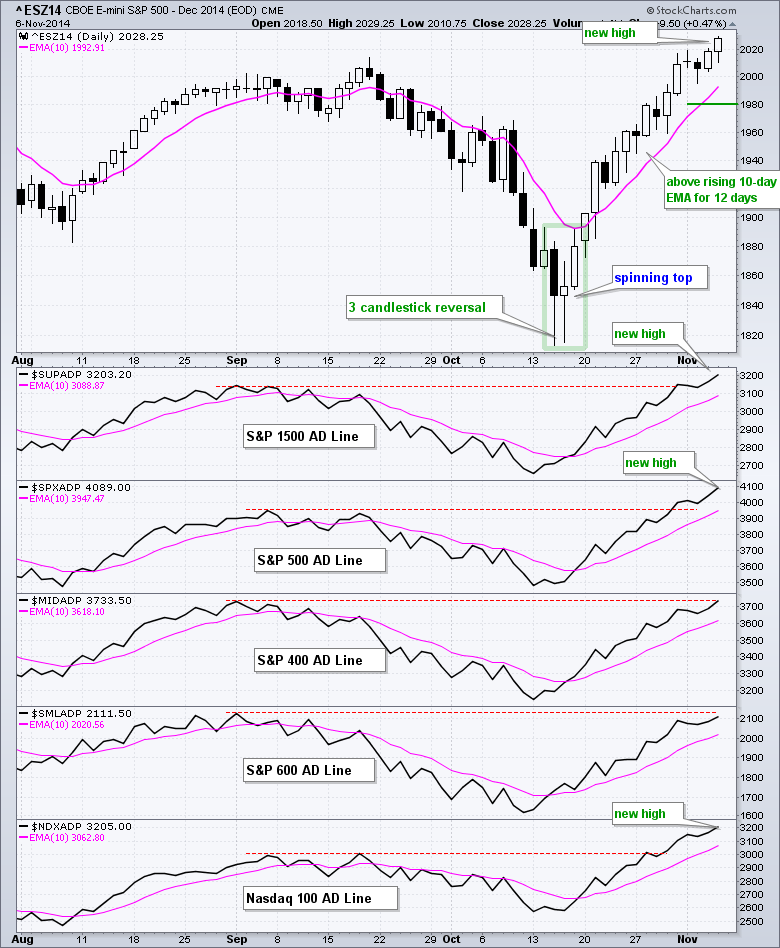
The December E-mini S&P 500 (^ESZ14) hit a new high to affirm the current uptrend. This new high allows me to raise support to the 1980 level. Note that the e-mini has not even touched the rising 10-day EMA since October 21st, which was thirteen days ago. All five AD Lines are in clear uptrends with three of the five hitting new highs. The S&P MidCap 400 AD Line is right at its September high and the S&P Small-Cap 600 ($SML) AD Line is closing in on its September high. There are no signs of selling pressure on these charts.
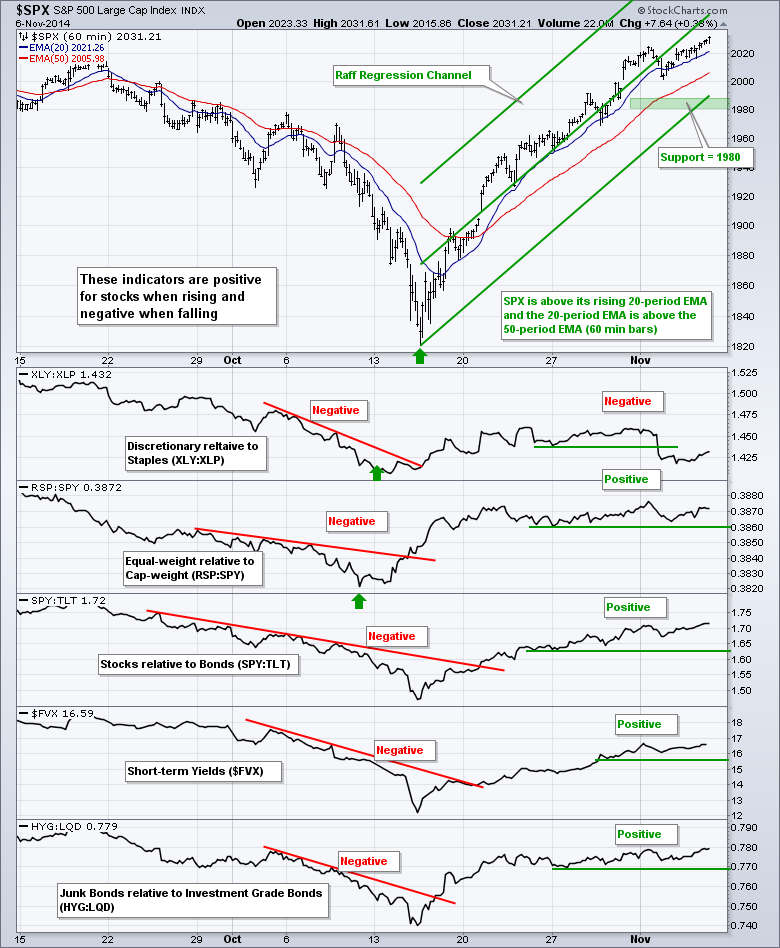
There is no change on the risk chart because four of the indicators remain positive for stocks. The XLY:XLP ratio broke down on Tuesday and remains below this support break, which means the consumer discretionary sector is lagging the consumer staples sector. The other four indicators are still trending higher and positive for stocks.
SPY moved to a new high so I extended the Raff Regression Channel to this high. This week's low, the lower trend line and a buffer mark key support in the 198-200 area. The trend is clearly up as long as this level holds.
**************************************************************
QQQ simply consolidated this week. This means the gap above 100.5 held for five days and is bullish as long as it holds. The Raff Regression Channel and 29-Oct low mark key support in the 99-99.5 area.
**************************************************************
IWM did not move to a new high and has lagged SPY this week. The trend, however, is still up with the Raff Regression Channel and 29-Oct lows marking key support in the 113-114 area.
**************************************************************
No change. The 20+ YR T-Bond ETF (TLT) remains in a short-term downtrend with the Raff Regression Channel and late October highs marking resistance in the 120-120.5 area. The 5-year Treasury Yield ($FVX) is in an uptrend with support around 1.5% (15) and the 10-YR Treasury Yield ($TNX) is in an uptrend with support around 2.25% (22.5).
**************************************************************
No change. The Dollar surged to a new high as both the Euro and the Yen fell. The European Central Bank (ECB) meets today and this could affect the Euro. The Bank of Japan has given the ECB every reason for quantitative easing because the Euro is actually appreciating versus the Yen. The US is stopping QE and this is bullish for the Dollar.
**************************************************************
No change. The USO Oil Fund (USO) broke support and bounced back to broken support on Wednesday. Broken support turns first resistance to watch here. While a move back above the support break would be positive, I would not turn bullish because this is a minor resistance level and the bigger downtrend still dominates. A break above the 32 would be deemed short-term bullish and argue for a retracement of the October-November decline.
**************************************************************
No change. Gold continued its free fall as the Gold SPDR (GLD) moved below 110 for the first time since March 2010. Gold is even more oversold after this decline, but oversold conditions are secondary to the underlying trend, which is clearly down. I have no idea where to mark resistance - or support for that matter.

***************************************************************
Key Reports and Events (all times Eastern):
Thu - Nov 06 - 07:30 - Challenger Jobs Report
Thu - Nov 06 - 08:30 - Initial Jobless Claims
Thu - Nov 06 - 10:30 - Nat Gas Inventories
Fri - Nov 07 - 08:30 - Employment Report
Charts of Interest are on Tuesdays and Thursdays.
This commentary and charts-of-interest are designed to stimulate thinking. This analysis is not a recommendation to buy, sell, hold or sell short any security (stock ETF or otherwise). We all need to think for ourselves when it comes to trading our own accounts. First, it is the only way to really learn. Second, we are the only ones responsible for our decisions. Think of these charts as food for further analysis. Before making a trade, it is important to have a plan. Plan the trade and trade the plan. Among other things, this includes setting a trigger level, a target area and a stop-loss level. It is also important to plan for three possible price movements: advance, decline or sideways. Have a plan for all three scenarios BEFORE making the trade. Consider possible holding times. And finally, look at overall market conditions and sector/industry performance.


