Stocks moved higher on Tuesday with the major index ETFs posting modest gains. Incremental gains are the hallmark of this advance since late October. SPY is up ten of the last twelve days and the total advance is around 2%. Sure, upside momentum is slowing and buying pressure is waning, but upside momentum is clearly stronger than downside momentum and buying pressure is certainly stronger than selling pressure. IWM shows a more mixed dynamic, but is still net bullish. IWM is up seven of the last twelve days, but down .15% for the month. For reference, QQQ is up nine of the last twelve days and up 2.25% month-to-date.
**This chart analysis is for educational purposes only, and should not
be construed as a recommendation to buy, sell or sell-short said securities**
Short-term Overview (Wednesday, 19-November-2014):
- The bulk of the evidence remains bullish for stocks.
- The S&P 500 and Nasdaq 100 AD Lines hit new highs.
- The five risk on-off indicators are positive, but three have been flat for weeks.
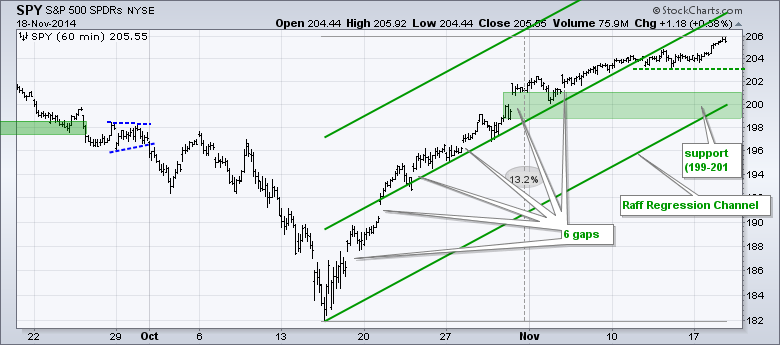
- SPY hit a new high and key support remains in the 200 area.
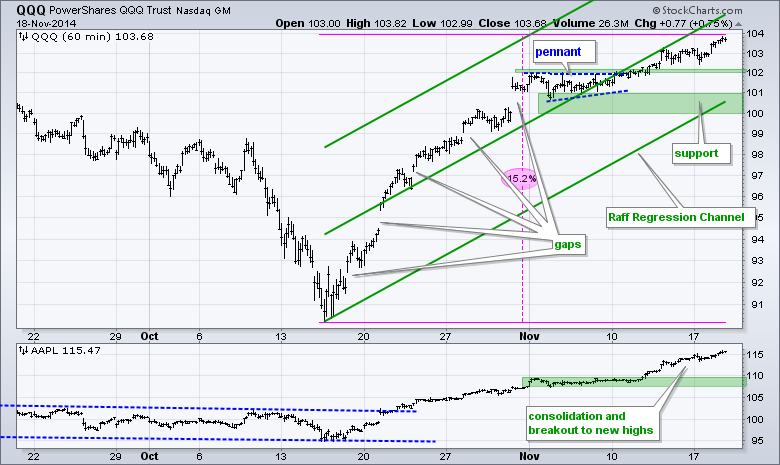
- QQQ hit a new high and key support remains in the 100 area.
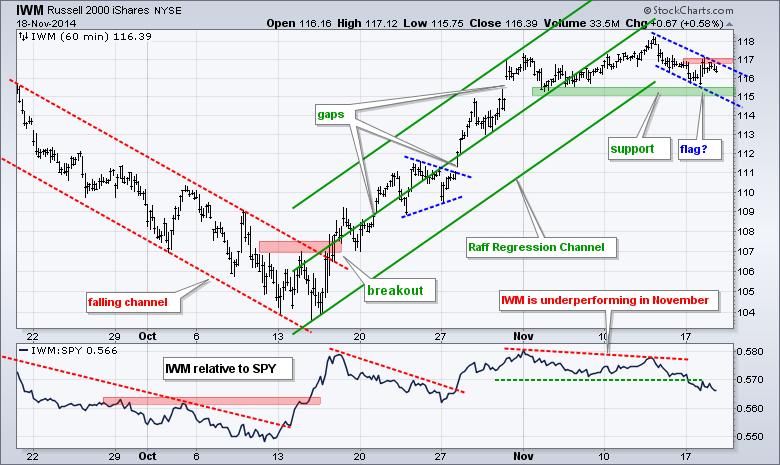
- IWM has been flat and lagging so I am raising key support to 115.
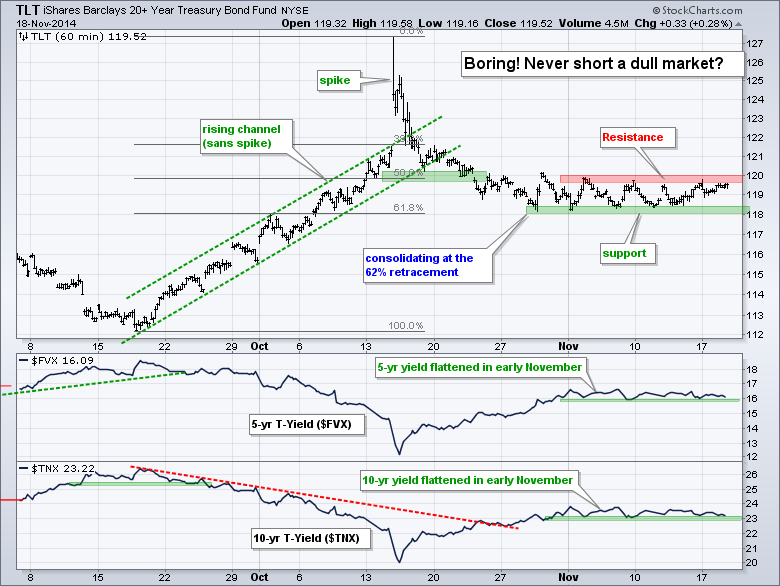
- TLT continues to bore with a tight consolidation (118-120).
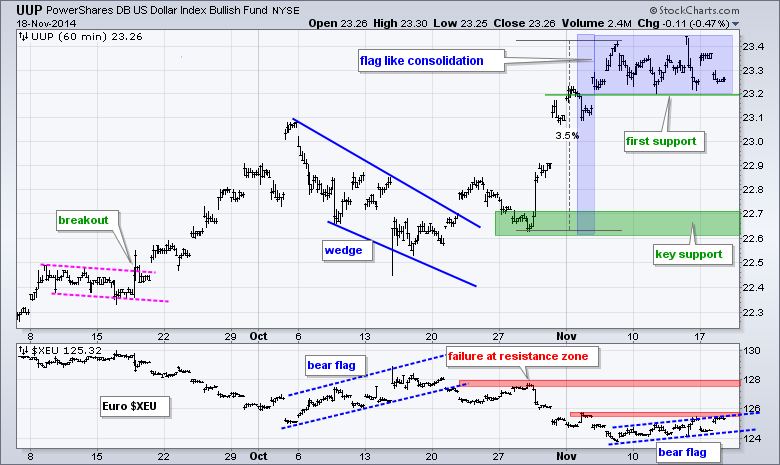
- UUP formed a flat, and bullish, flag over the past week.
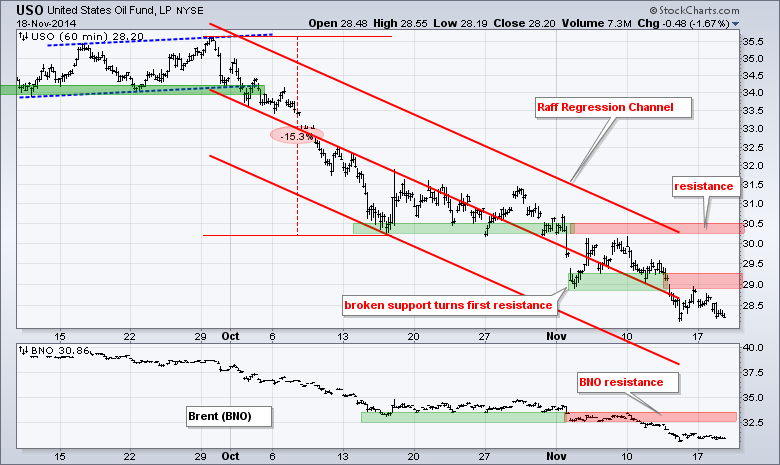
- USO remains in a downtrend with resistance at 30.5
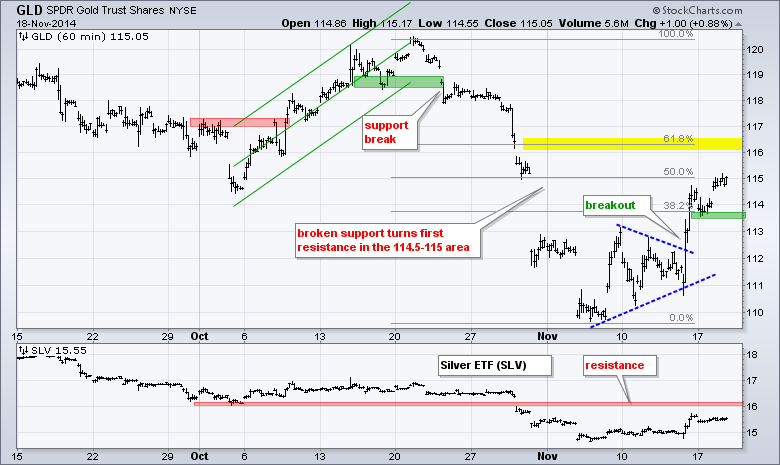
- GLD held its triangle breakout and could reach the 62% retracement
The December E-mini S&P 500 (^ESZ14) stalled for five days with a tight range and then moved to yet another new high. Even though the gain may seem tepid, it is an advance and there is no denying the short-term uptrend. Selling pressure is pretty much non-existent right now. I added a three day price channel and shifted it forward one day. The lower line marks the three day low and the upper line marks the three day high. A close below the lower line would provide the first sign of weakness.
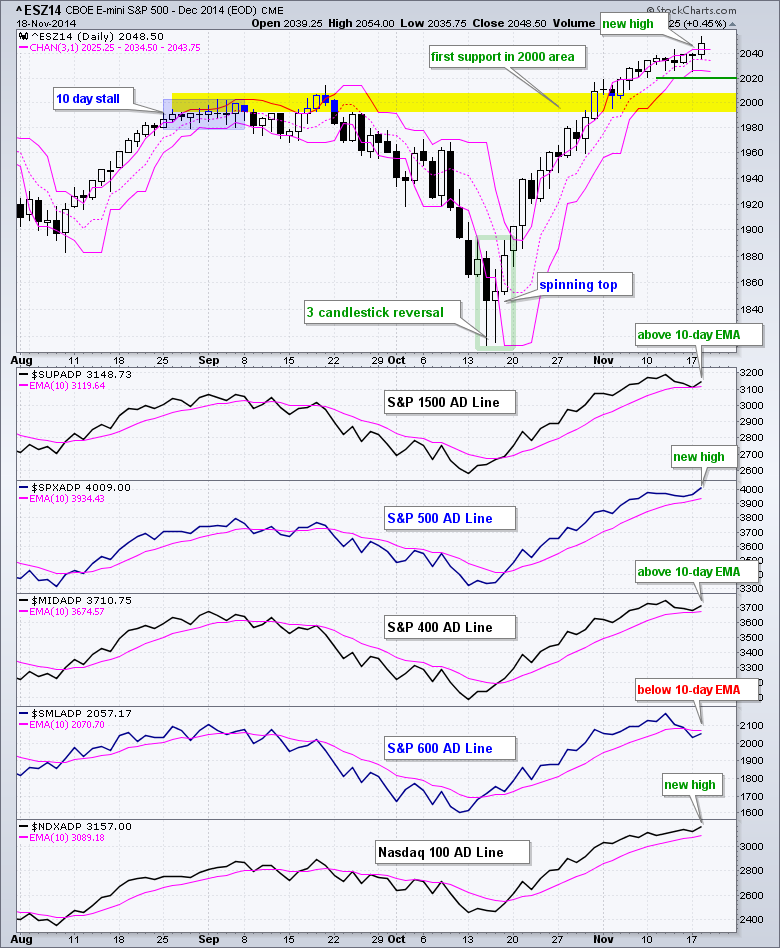
The S&P 500 and Nasdaq 100 AD Lines hit new highs, while the S&P 1500 and the S&P MidCap 400 AD Lines remain in clear uptrends (above their 10-day EMAs). The S&P Small-Cap 600 AD Line is the only one that can be considered in a downtrend because it broke its 10-day EMA. Overall, four of five AD Lines are in clear uptrends and this is short-term bullish.
There is no change for the risk on-off indicators as all five remain positive for stocks. The RSP:SPY ratio, 5-year Treasury Yield ($FVX) and JNK:LQD ratio have flattened, but they have yet to break down and turn negative.
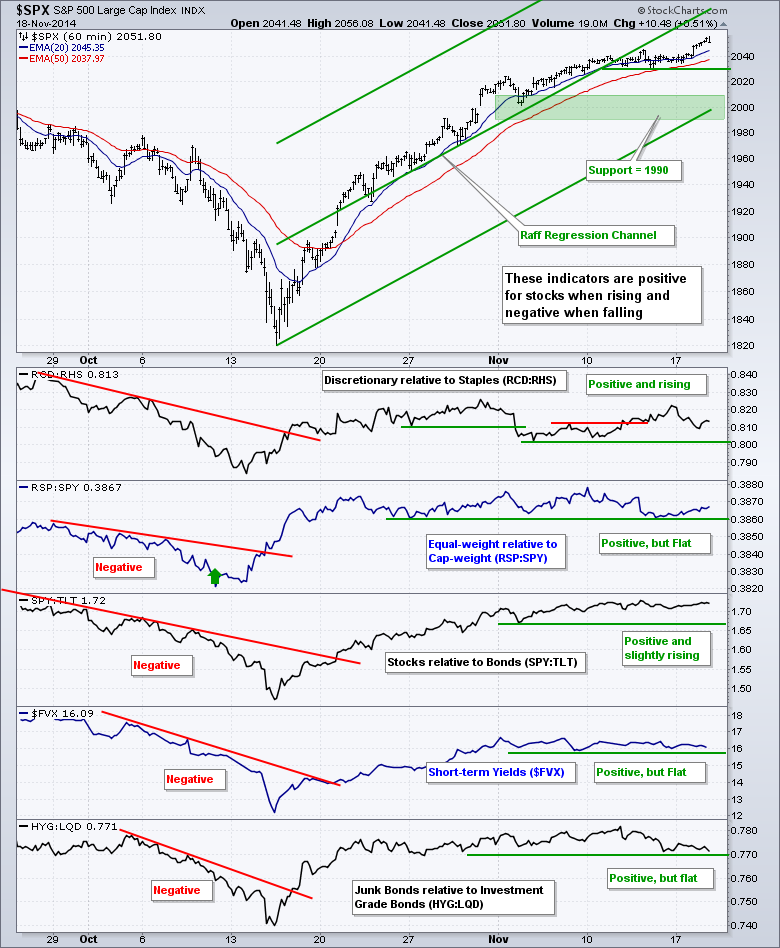
SPY moved to a new high and I extended the Raff Regression Channel to match this high. There is still no real change on the chart. Last week's lows mark first support at 203. The late October gap, early November low and Raff Regression Channel mark key support in the 200 area.
**************************************************************
QQQ moved to another new high and remains one of the strongest major index ETFs. I extended the Raff Regression Channel to this high and will leave key support at 100 for now. Broken resistance and this week's low mark first support at 102. This level could be used for stop-losses, but I would not consider short positions.
**************************************************************
There is some concern with small-caps because IWM has traded flat this month and underperformed SPY. The decline over the last few days could be a falling flag with resistance around 117. A break above yesterday's high would reverse this decline. I am raising key support to 115 because further weakness below this level would be short-term bearish.
**************************************************************
No change. Given the positive economic reports in early November and better-than-expected retail sales report last week, I would have expected the 20+ YR T-Bond ETF (TLT) to break support and move lower. It did not and this could foreshadow an upside breakout. TLT spiked above 127 in mid October and then fell back to the 118 area in late October. The ETF is at an interesting juncture because it retraced 62% of the prior decline, which is normal for a correction within an uptrend. A break above 120 would break consolidation resistance and signal an end to the consolidation. Key support is set at 118.
**************************************************************
The US Dollar ETF (UUP) surged from 22.5 to 23.4 and then consolidated. This looks like a flat flag and a break above the highs would signal a continuation higher. The flag lows mark first support in the 23.2 area. I will leave key support in the 22.6-22.7 area for now. The indicator window shows the Euro Index ($XEU) forming a bear flag over the past week.
**************************************************************
No change. The USO Oil Fund (USO) got a big bounce on Friday, but still closed down for the week and remains in a clear downtrend. Broken support in the 30.5 area turns resistance and the upper line of the Raff Regression Channel extends to this area as well. USO broke down again last week and broken support in the 29-29.3 area turns first resistance.
**************************************************************
The Gold SPDR (GLD) broke triangle resistance and surged to the 50% retracement line. The move looks strong and it is holding, but the long-term trend for gold is still down. This precludes me from getting too bullish on the short-term because the long-term trend can pull trump at any time. The 62% retracement marks the next upside target. I will mark first support in the 113.5 area.
***************************************************************
Key Reports and Events (all times Eastern):
Wed - Nov 19 - 07:00 - MBA Mortgage Index
Wed - Nov 19 - 08:30 - Housing Starts
Wed - Nov 19 - 10:30 - Crude Oil Inventories
Wed - Nov 19 - 14:00 - FOMC Minutes
Thu - Nov 20 - 08:30 - Initial Claims
Thu - Nov 20 - 08:30 - Consumer Price Index (CPI)
Thu - Nov 20 - 10:00 - Existing Home Sales
Thu - Nov 20 - 10:00 - Philadelphia Fed
Thu - Nov 20 - 10:00 - Leading Economic Indicators
Thu - Nov 20 - 10:30 - Natural Gas Inventories
Charts of Interest are on Tuesdays and Thursdays.
This commentary and charts-of-interest are designed to stimulate thinking. This analysis is not a recommendation to buy, sell, hold or sell short any security (stock ETF or otherwise). We all need to think for ourselves when it comes to trading our own accounts. First, it is the only way to really learn. Second, we are the only ones responsible for our decisions. Think of these charts as food for further analysis. Before making a trade, it is important to have a plan. Plan the trade and trade the plan. Among other things, this includes setting a trigger level, a target area and a stop-loss level. It is also important to plan for three possible price movements: advance, decline or sideways. Have a plan for all three scenarios BEFORE making the trade. Consider possible holding times. And finally, look at overall market conditions and sector/industry performance.


