Stocks meandered again in mixed trading. Small-caps were weak as IWM fell .83%, but large-caps held firm as SPY and DIA closed with fractional gains. If you are looking for that small correction, look no further than small-caps because IWM is down around 2% in the last three days. If you are looking for relative strength, look no further than SPY and QQQ because these two held up quite well. SPY remains flat as a pancake, as does the 20+ YR T-Bond ETF (TLT). An upside break in SPY and downside break in TLT would be quite positive for stocks.
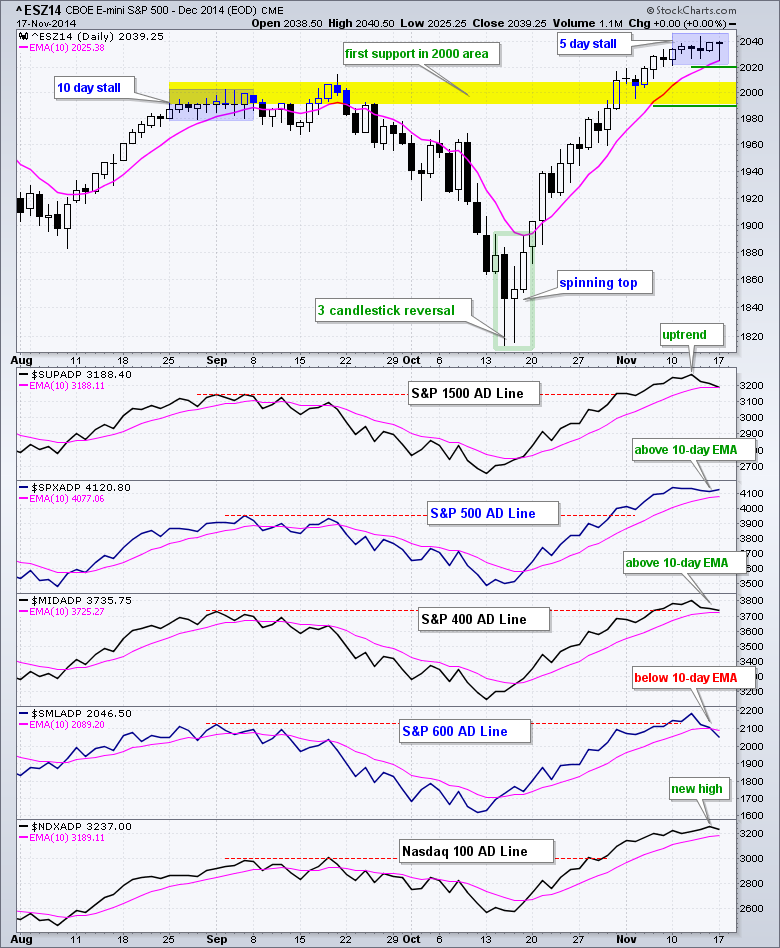
The December E-mini S&P 500 (^ESZ14) continued its stall for the fifth day. Over the last five days, the E-mini has traded within a 1% range and closed between 2033 and 2040. This is just indecision as buying pressure and selling pressure equalize. We have yet to see a real increase in selling pressure and first support at 2020 continues to hold. There was a similar consolidation in late August and early September when the E-mini traded flat for 10 days and then edged lower. A break below 2020 would be negative, but I think the E-mini and S&P 500 will find support in the 2000 area.
**This chart analysis is for educational purposes only, and should not
be construed as a recommendation to buy, sell or sell-short said securities**
Short-term Overview (18-November-2014):
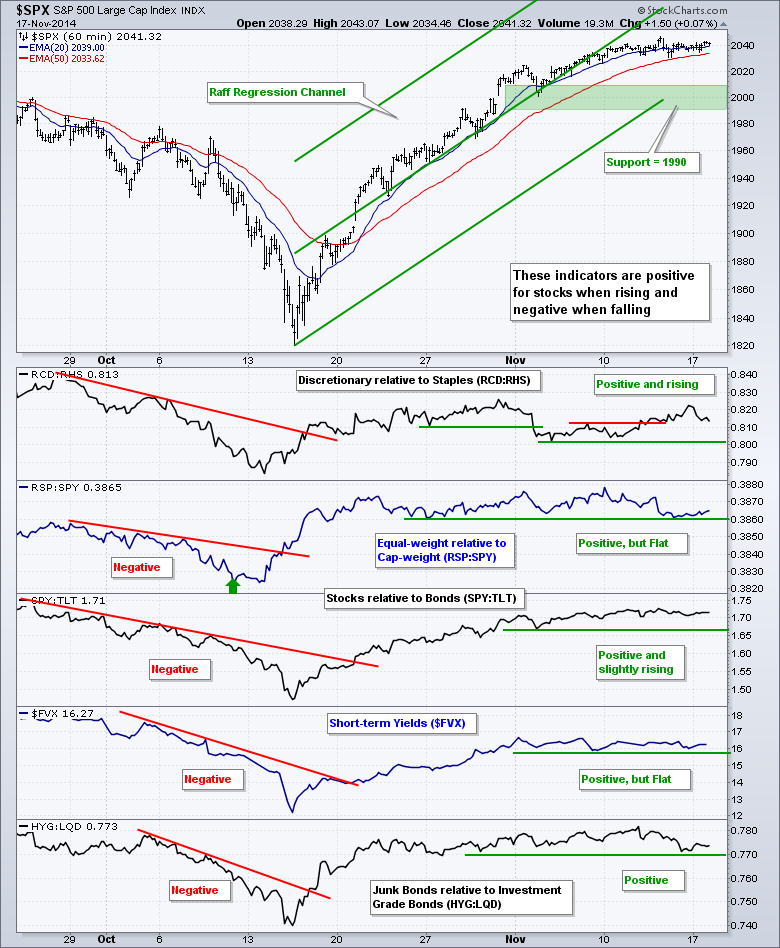
- Three of the five risk factors are flat, but have yet to turn negative.
- Four of five AD Lines are rising. The $SML AD Line broke its 10-day EMA.
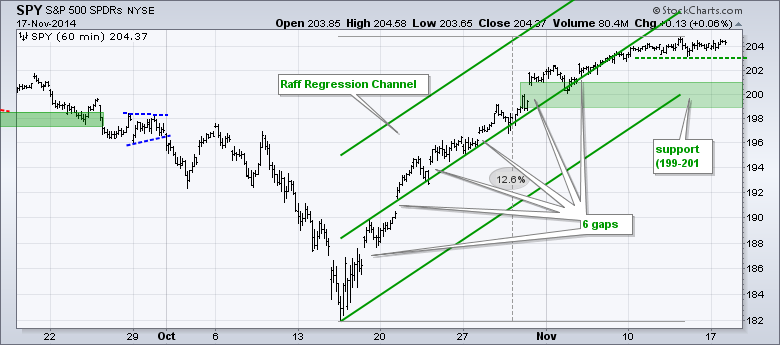
- SPY extended its consolidation and uptrend support remains at 199.
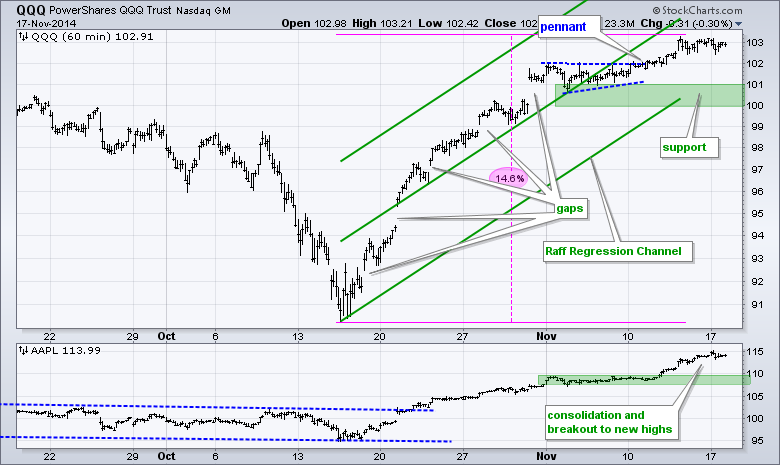
- QQQ is leading and uptrend support remains at 100-101.
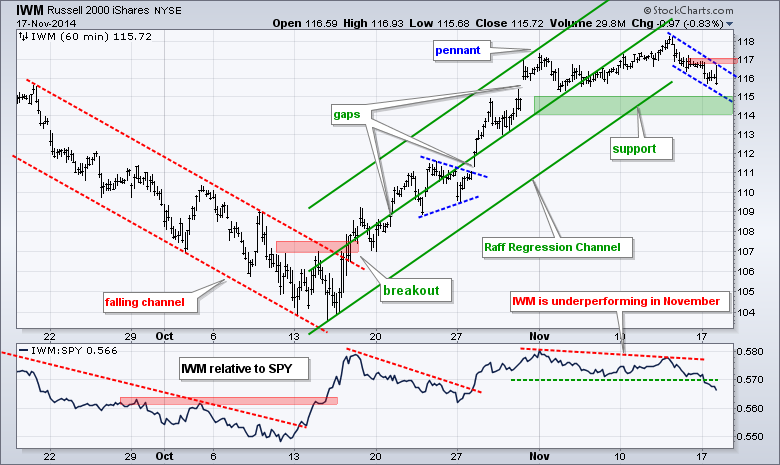
- IWM is lagging with a pullback, but the overall trend is up with support at 114-115.
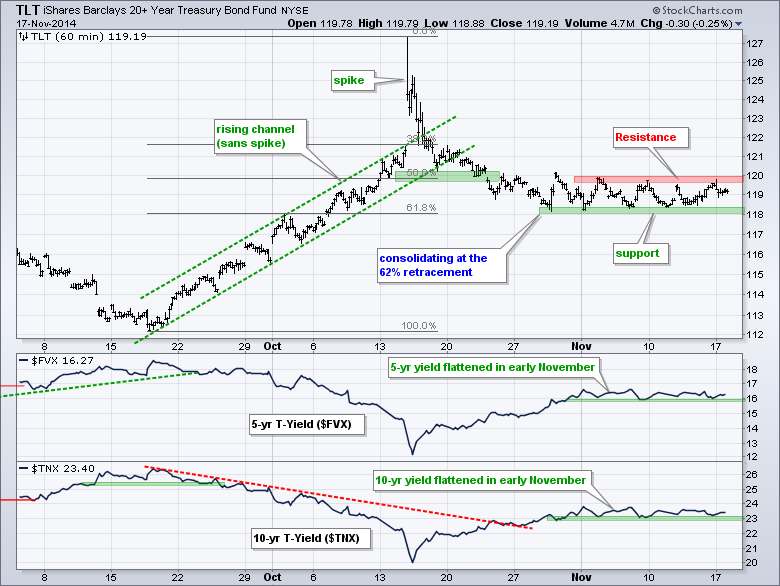
- TLT continues to bore with a tight consolidation (118-120).
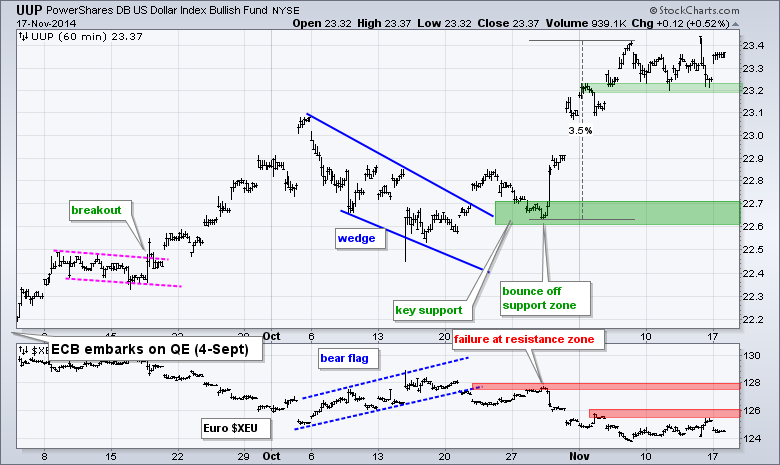
- UUP bounced off the early November lows and remains strong.
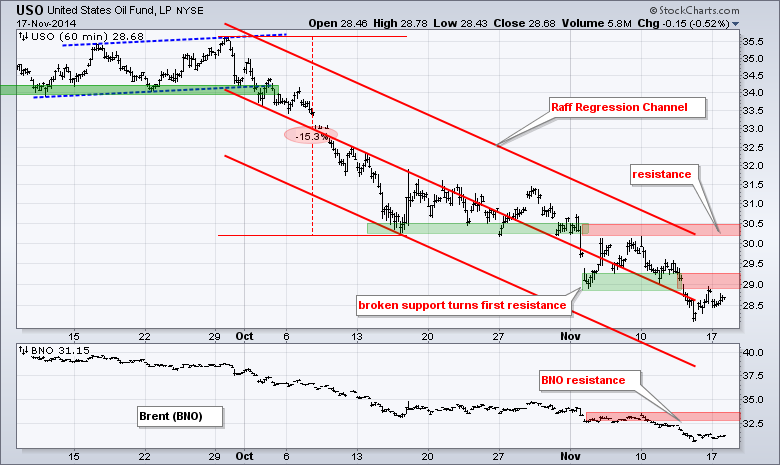
- USO remains in a downtrend with resistance at 30.5
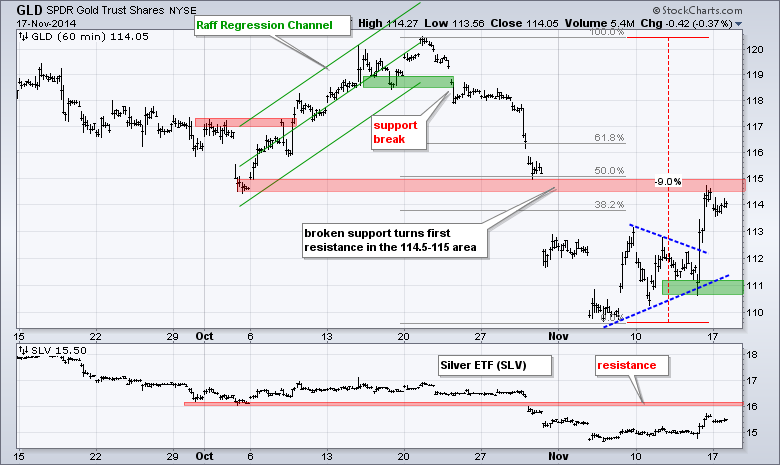
- GLD surged to the 50% retracement and stalled.
There is no change in the risk on-off indicators for stocks as all five remain bullish. The RSP:SPY ratio flattened over the last few weeks as the average S&P 500 stock performed in line with the large-cap S&P 500 stocks. The 5-year Treasury Yield ($FVX) remains flat in November and has yet to break either way. The direction of its break could provide a good indication for stocks. An upside break would be bullish, while a downside break would be bearish because lower yields would suggest that money is moving into short-term Treasuries and signal a flight to safety. High yield bonds took a hit last week, but the ratio of high yield bonds to investor grade bonds remains flat and has yet to break down.
SPY moved above 204 last week and then traded flat the last six days. A break below 203 would provide the first hint of a pullback. I am still looking for support sooner rather than later and will keep key support in the 199-201 area.
**************************************************************
No change. QQQ surged above 101 in late October, consolidated with a pennant and broke out last week. The Raff Regression Channel, pennant lows and a buffer mark key support in the 100-101 area. The indicator window shows Apple breaking consolidation support and moving to a new high ahead of the holiday season.
**************************************************************
IWM hit a new high for the move last week and then pulled back with a decline below 116. Those looking for a correction from overbought levels can find it in IWM and IJR. The overall trend remains up with the early November low, Raff Regression Channel and a buffer marking support in the 114-115 area. The short decline formed a small channel and a break above 117 would be positive.
**************************************************************
No change. Given the positive economic reports in early November and better-than-expected retail sales report last week, I would have expected the 20+ YR T-Bond ETF (TLT) to break support and move lower. It did not and this could foreshadow an upside breakout. TLT spiked above 127 in mid October and then fell back to the 118 area in late October. The ETF is at an interesting juncture because it retraced 62% of the prior decline, which is normal for a correction within an uptrend. A break above 120 would break consolidation resistance and signal an end to the consolidation. Key support is set at 118.
**************************************************************
No change. The US Dollar ETF (UUP) failed to hold above 23.4 twice and fell to support in the 23.20 area. Even though the big trend is up, the ETF is entitled to a breather within the uptrend and a break below the early November lows would argue for a pullback. I will leave key support in the 22.6-22.7 area because the bigger trend is up.
**************************************************************
No change. The USO Oil Fund (USO) got a big bounce on Friday, but still closed down for the week and remains in a clear downtrend. Broken support in the 30.5 area turns resistance and the upper line of the Raff Regression Channel extends to this area as well. USO broke down again last week and broken support in the 29-29.3 area turns first resistance.
**************************************************************
No change. The Gold SPDR (GLD) continued its volatile ways with a dip below 111 in the morning and subsequent surge above 114. This move broke triangle resistance and carried gold to the 50% retracement. The short-term trend must be considered up, but this move is not enough to affect the long-term downtrend. Broken support and the 50% retracement turn resistance in the 115 area.
***************************************************************
Key Reports and Events (all times Eastern):
Tue - Nov 18 - 08:30 - Producer Price Index (PPI)
Tue - Nov 18 - 10:00 - NAHB Housing Market Index
Wed - Nov 19 - 07:00 - MBA Mortgage Index
Wed - Nov 19 - 08:30 - Housing Starts
Wed - Nov 19 - 10:30 - Crude Oil Inventories
Wed - Nov 19 - 14:00 - FOMC Minutes
Thu - Nov 20 - 08:30 - Initial Claims
Thu - Nov 20 - 08:30 - Consumer Price Index (CPI)
Thu - Nov 20 - 10:00 - Existing Home Sales
Thu - Nov 20 - 10:00 - Philadelphia Fed
Thu - Nov 20 - 10:00 - Leading Economic Indicators
Thu - Nov 20 - 10:30 - Natural Gas Inventories
Charts of Interest are on Tuesdays and Thursdays.
This commentary and charts-of-interest are designed to stimulate thinking. This analysis is not a recommendation to buy, sell, hold or sell short any security (stock ETF or otherwise). We all need to think for ourselves when it comes to trading our own accounts. First, it is the only way to really learn. Second, we are the only ones responsible for our decisions. Think of these charts as food for further analysis. Before making a trade, it is important to have a plan. Plan the trade and trade the plan. Among other things, this includes setting a trigger level, a target area and a stop-loss level. It is also important to plan for three possible price movements: advance, decline or sideways. Have a plan for all three scenarios BEFORE making the trade. Consider possible holding times. And finally, look at overall market conditions and sector/industry performance.


