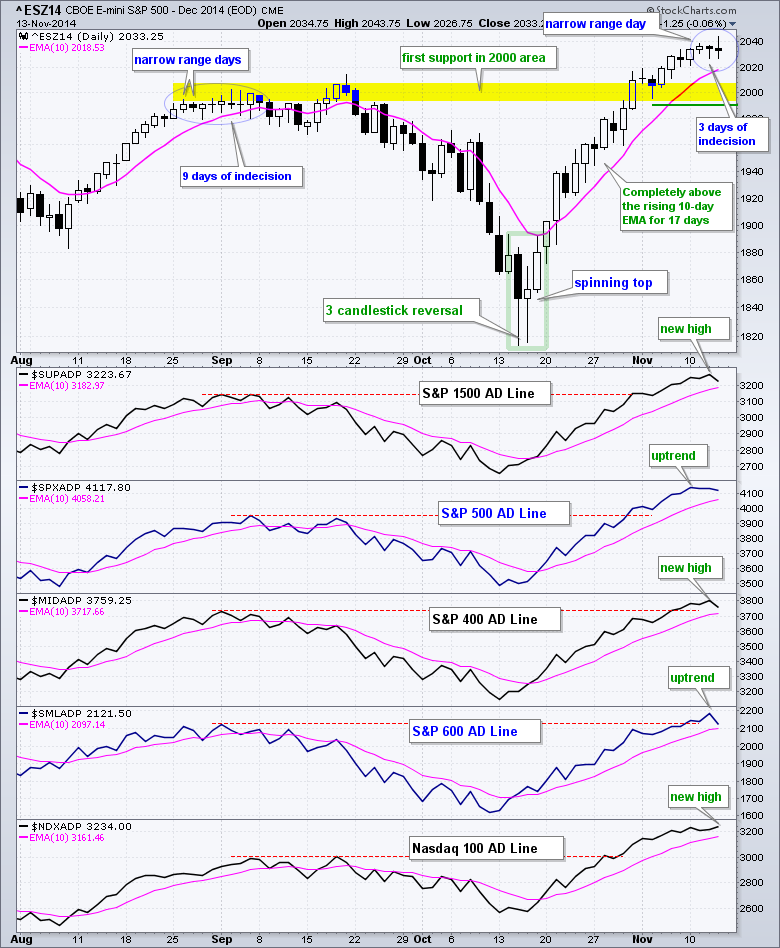
Stocks finished very mixed on Thursday. DIA, QQQ and SPY finished with small gains, while IWM and IWC finished with modest losses. The Russell 2000 iShares (IWM) fell .85% and the Russell MicroCap iShares (IWC) was down 1.10%. Weakness in small-caps is the reason many breadth indicators were negative on Thursday. The sector SPDRs and equal-weight sector ETFs were mixed, but all nine small-cap sectors were lower. Energy led the way in all three groups as oil fell below $80. Pretty much anything associated with raw materials was hit with selling pressure on Thursday (gold, copper, uranium, silver, steel, coal, natgas and oil). The Medical Devices ETF (IHI) and the Telecom iShares (IYZ) held up well and closed with small gains. Overall, the market continues to consolidate at relative high levels. The chart below shows the December E-mini S&P 500 (^ESZ14) forming a narrow range day on Tuesday and stalling the last two days. Stalling just means buying pressure and selling pressure have equalized. This is not bearish because we have yet to see an increase in selling pressure on the E-mini. Broken resistance and the early November lows mark support in the 2000 area.
**This chart analysis is for educational purposes only, and should not
be construed as a recommendation to buy, sell or sell-short said securities**
Short-term Overview (14-November-2014):
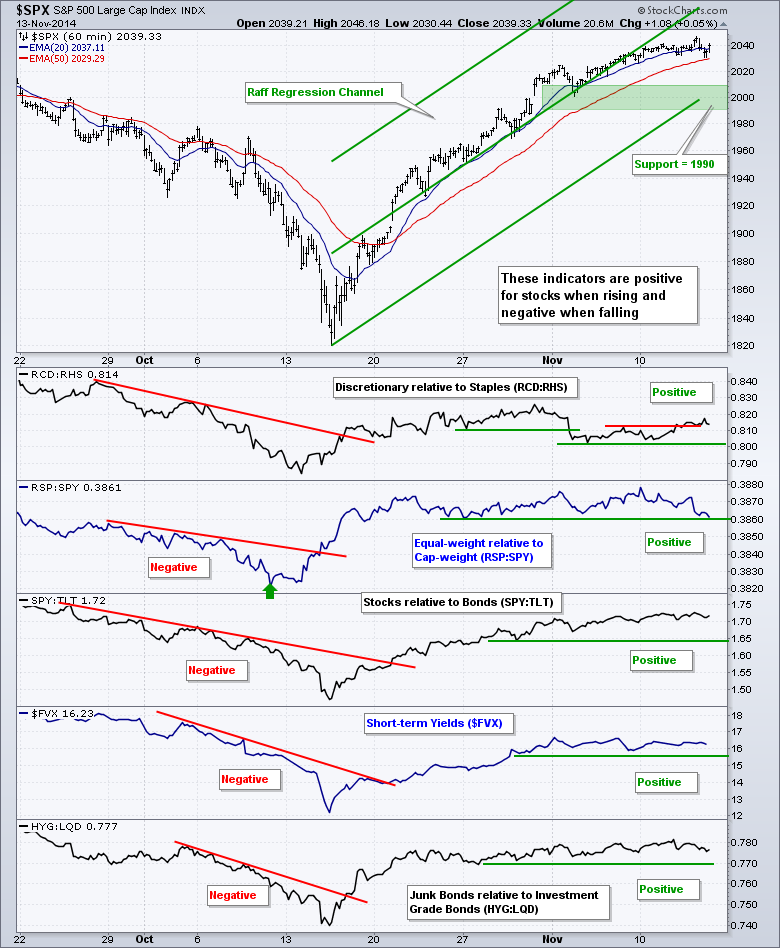
- All five risk indicators are now positive for stocks.
- All five AD Lines are above their rising 10-day EMAs.
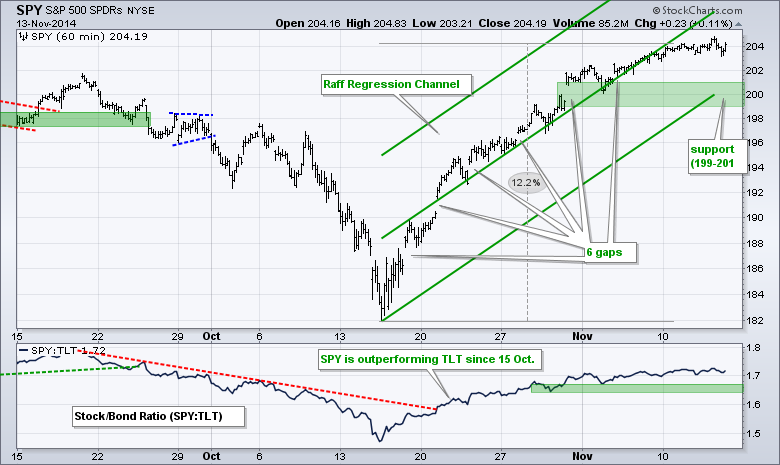
- SPY hit a new high and key support remains in the 199-201 area.
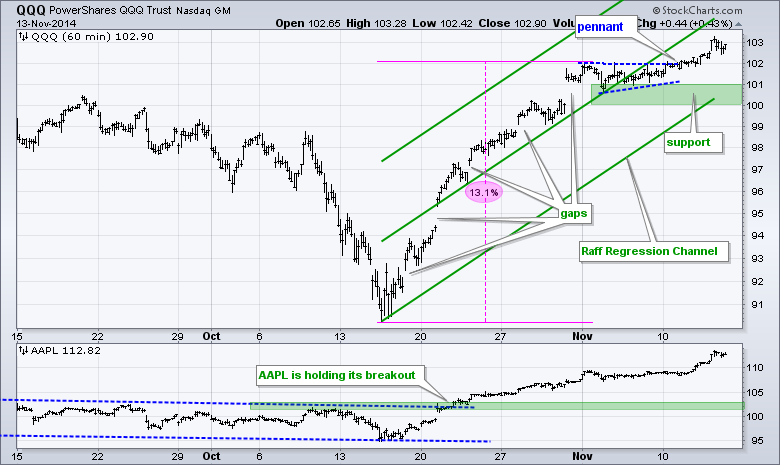
- QQQ broke pennant resistance on Tuesday and support remains at 100.
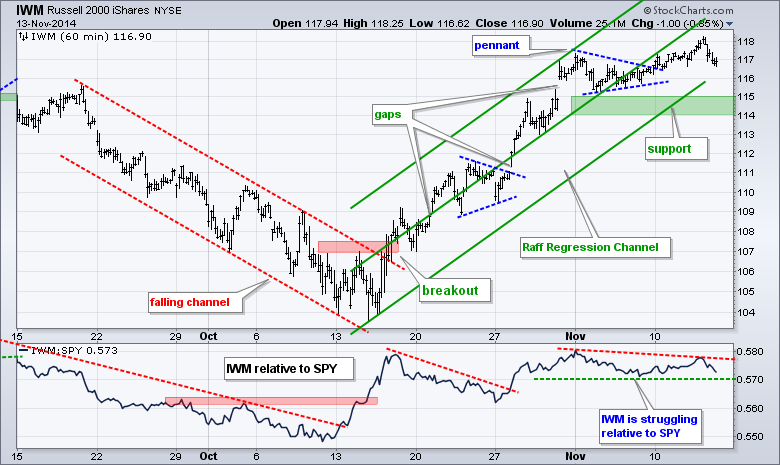
- IWM broke pennant resistance last Friday and support remains at 114.
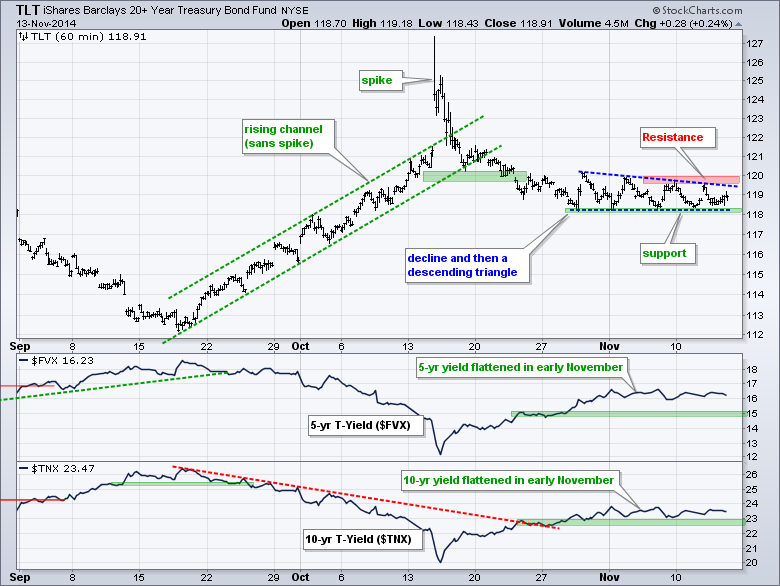
- TLT has a bearish descending triangle working with support at 118.
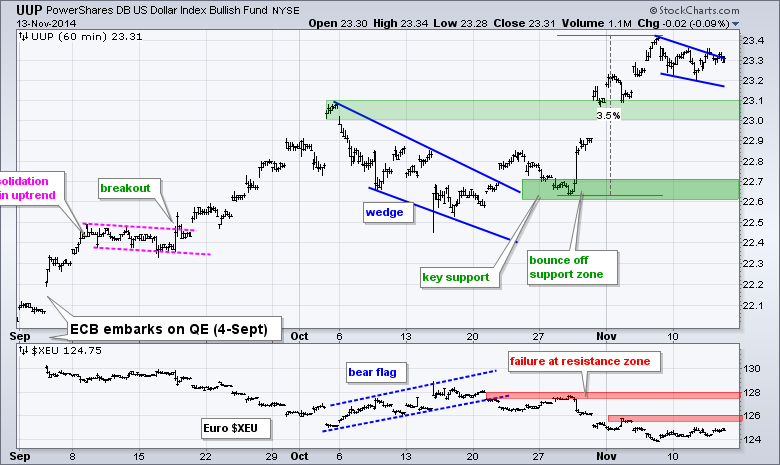
- UUP formed a bull flag with a small pullback and supports remain unchanged.
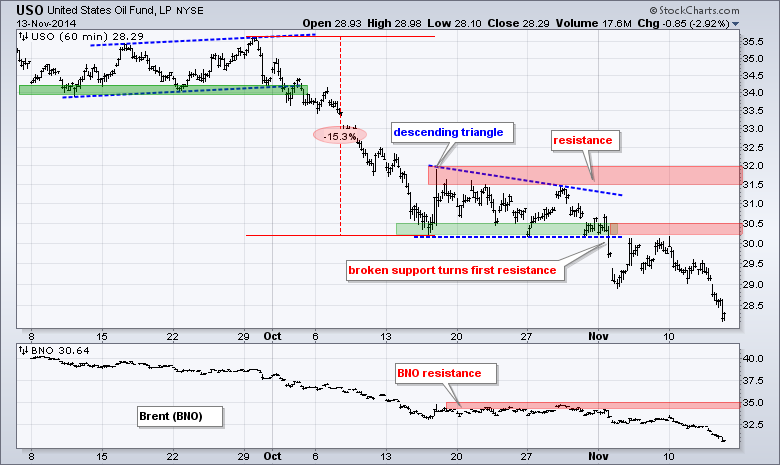
- USO failed at broken support twice and moved to new lows.
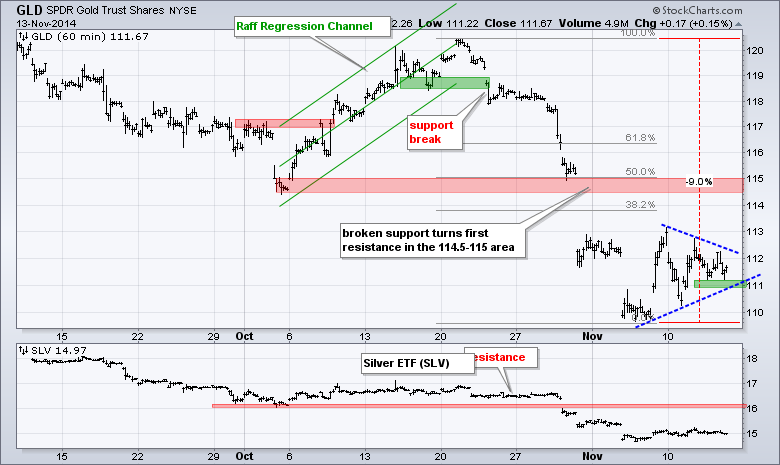
- GLD formed a bearish continuation pattern over the last five days.
I made a small change to the risk on-off chart. Instead of measuring the Consumer Discretionary SPDR (XLY) relative to the Consumer Staples SPDR (XLP), I am going to chart the ratio of the Equal-weight Consumer Discretionary ETF (RCD) to the Equal-weight Consumer Staples ETF (RHS). XLY and RCD have the same stocks, as do XLP and RHS, but the equal-weight versions are more representative of the sectors as a whole.
All five risk indicators are bullish for stocks. The equal-weight consumer discretionary sector bounced this week and started outperforming the equal-weight consumer staples sector. The equal-weight S&P 500 ETF, however, fell relative to SPY and is testing the late October low. A break would turn this risk indicator negative. Elsewhere, stocks are outperforming bonds, the 5-year Treasury Yield ($FVX) has yet to break down and junk bonds are outperforming investment grade bonds.
SPY eked out another new high so I extended the Raff Regression Channel. The lower trend line ends right at 200 and this is the middle of the support zone (199-201). A pullback to this area may provide a chance to partake on the long side.
**************************************************************
QQQ broke pennant resistance mid week and moved to a new high on Thursday. I extended the Raff Regression Channel accordingly, but will leave key support in the 100-101 area. The pennant lows and lower trend line mark support here. Apple hit a new high and continues to show relative strength.
**************************************************************
IWM broke pennant resistance on 7-Nov, moved above 118 on Thursday morning and fell back in the afternoon. With a new high for the move, I extended the Raff Regression Channel, but will leave key support in the 114-115 area for now. I like to add an extra buffer for IWM because it is more volatile than SPY. The indicator window shows the IWM:SPY ratio flattening this month as small-caps struggle to outperform large-caps.
**************************************************************
No change. The 20+ YR T-Bond ETF (TLT) moved down to support and I am now considering this pattern a descending triangle. TLT fell sharply from 125 to 119 and then stalled for three weeks. The lower highs and equal lows suggest a descending triangle, which is a bearish continuation pattern. A break below 118 would signal a continuation lower and target a move to the 116 area. A move lower in TLT would imply a move higher in yields, which would be bullish for stocks (except utilities, perhaps).
**************************************************************
No change. The US Dollar ETF (UUP) pulled back over the last four days and formed a falling flag/wedge. With the bigger trend up, a break above wedge resistance would signal a continuation higher. I am going to leave first support in the 23-23.1 area and key support in the 22.6-22.7 area.
**************************************************************
The USO Oil Fund (USO) broke support from a descending triangle, broken support turned into resistance and resistance held. USO failed twice near broken support and then moved to a new low on Thursday. The US Brent Oil ETF (BNO) moved to a new low. I will leave first resistance at 30.5 and key resistance at 32.
**************************************************************
Gold turned volatile the last five days, but not bullish by any means. The Gold SPDR (GLD) fell some 9% and then consolidated the last five days with a volatile range. The pattern at work looks like a triangle after a sharp decline and this is a continuation pattern, which makes it bearish. A break below 111 would signal yet another continuation lower.
***************************************************************
Key Reports and Events (all times Eastern):
Fri - Nov 14 - 08:30 - Retail Sales
Fri - Nov 14 - 09:55 - Michigan Sentiment
Charts of Interest are on Tuesdays and Thursdays.
This commentary and charts-of-interest are designed to stimulate thinking. This analysis is not a recommendation to buy, sell, hold or sell short any security (stock ETF or otherwise). We all need to think for ourselves when it comes to trading our own accounts. First, it is the only way to really learn. Second, we are the only ones responsible for our decisions. Think of these charts as food for further analysis. Before making a trade, it is important to have a plan. Plan the trade and trade the plan. Among other things, this includes setting a trigger level, a target area and a stop-loss level. It is also important to plan for three possible price movements: advance, decline or sideways. Have a plan for all three scenarios BEFORE making the trade. Consider possible holding times. And finally, look at overall market conditions and sector/industry performance.
